

Alterations in Adipose Tissue Distribution, Cell Morphology, and Function Mark Primary Insulin Hypersecretion in Youth With Obesity
- PMID: 37870826
- PMCID: PMC11109779
- DOI: 10.2337/db23-0450
Alterations in Adipose Tissue Distribution, Cell Morphology, and Function Mark Primary Insulin Hypersecretion in Youth With Obesity
Abstract
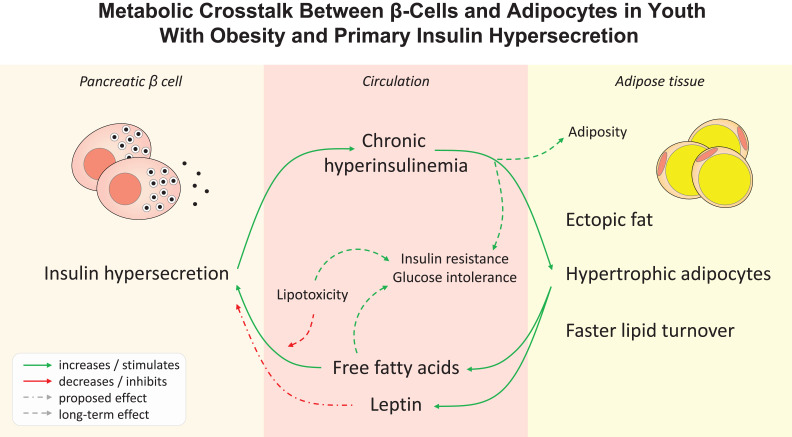
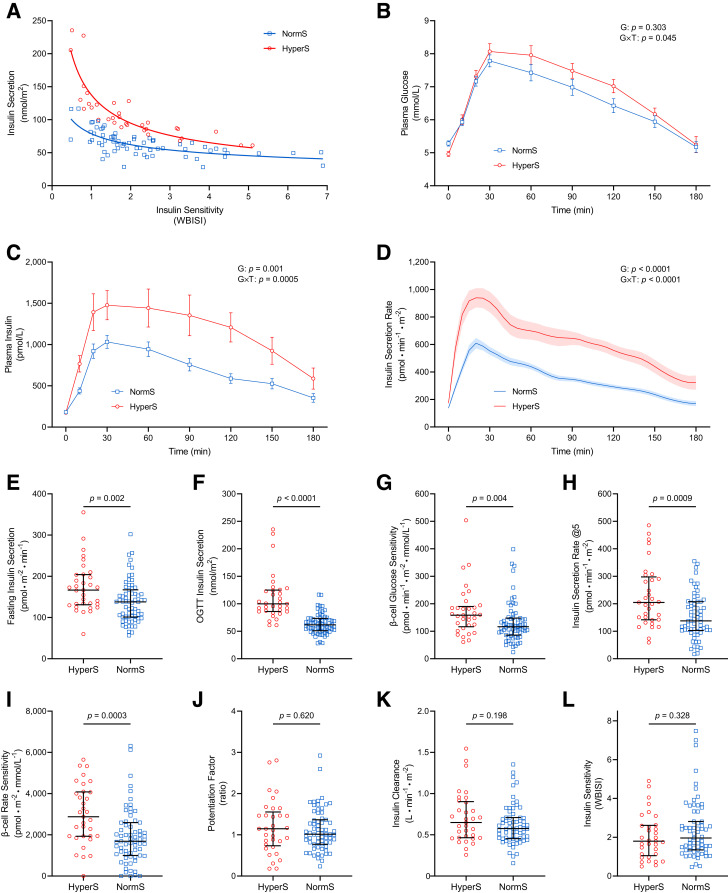
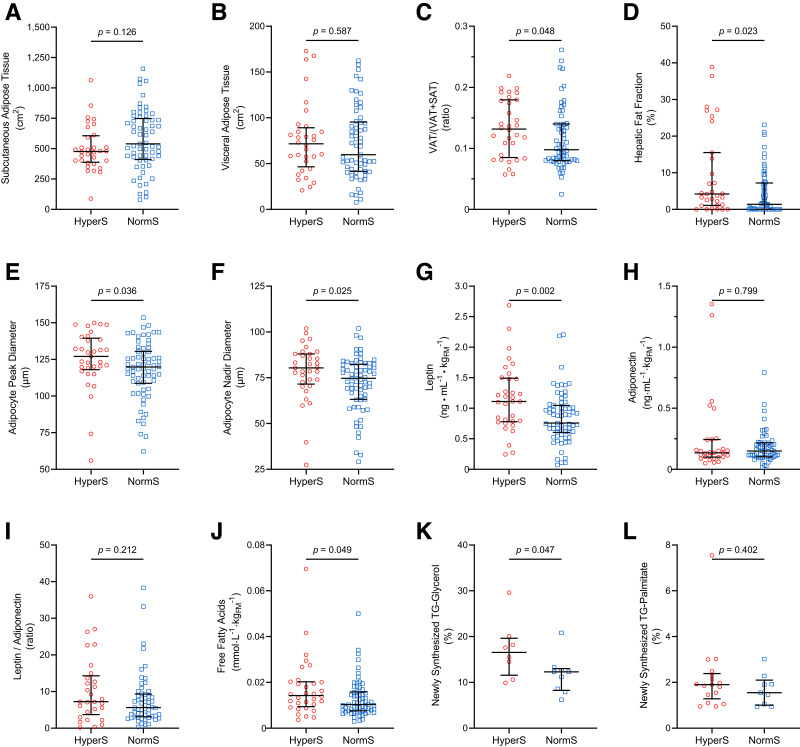
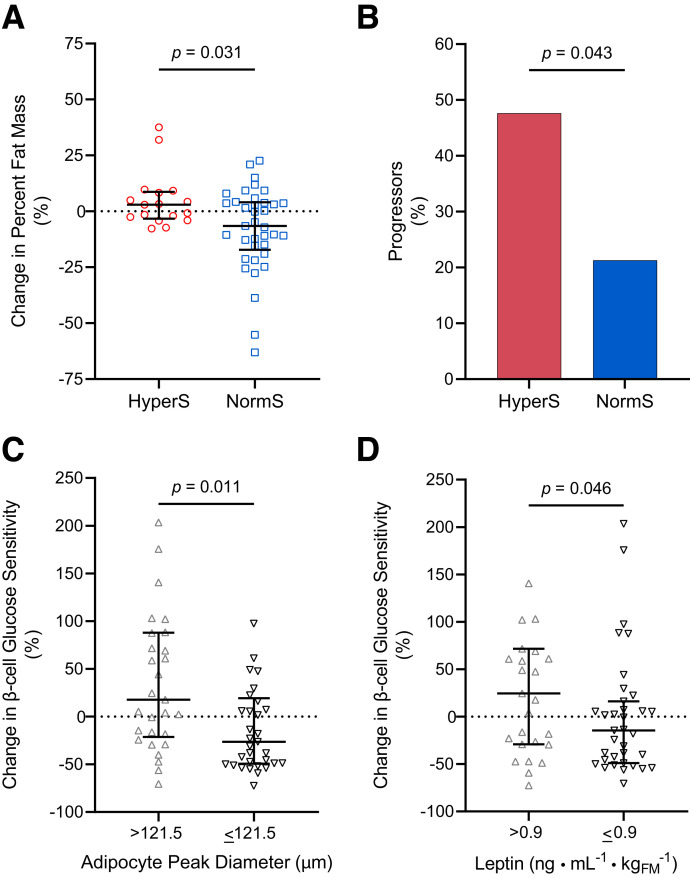
Excessive insulin secretion independent of insulin resistance, defined as primary hypersecretion, is associated with obesity and an unfavorable metabolic phenotype. We examined the characteristics of adipose tissue of youth with primary insulin hypersecretion and the longitudinal metabolic alterations influenced by the complex adipo-insular interplay. In a multiethnic cohort of adolescents with obesity but without diabetes, primary insulin hypersecretors had enhanced model-derived β-cell glucose sensitivity and rate sensitivity but worse glucose tolerance, despite similar demographics, adiposity, and insulin resistance measured by both oral glucose tolerance test and euglycemic-hyperinsulinemic clamp. Hypersecretors had greater intrahepatic and visceral fat depots at abdominal MRI, hypertrophic abdominal subcutaneous adipocytes, higher free fatty acid and leptin serum levels per fat mass, and faster in vivo lipid turnover assessed by a long-term 2H2O labeling protocol. At 2-year follow-up, hypersecretors had greater fat accrual and a threefold higher risk for abnormal glucose tolerance, while individuals with hypertrophic adipocytes or higher leptin levels showed enhanced β-cell glucose sensitivity. Primary insulin hypersecretion is associated with marked alterations in adipose tissue distribution, cellularity, and lipid dynamics, independent of whole-body adiposity and insulin resistance. Pathogenetic insight into the metabolic crosstalk between β-cell and adipocyte may help to identify individuals at risk for chronic hyperinsulinemia, body weight gain, and glucose intolerance.
© 2024 by the American Diabetes Association.
Conflict of interest statement
Figures
Comment in
-
Insulin Hypersecretion as Promoter of Body Fat Gain and Hyperglycemia.Diabetes. 2024 Jun 1;73(6):837-843. doi: 10.2337/dbi23-0035. Diabetes. 2024. PMID: 38768368 Free PMC article. No abstract available.
References
-
- Kekäläinen P, Sarlund H, Pyörälä K, Laakso M.. Hyperinsulinemia cluster predicts the development of type 2 diabetes independently of family history of diabetes. Diabetes Care 1999;22:86–92 - PubMed
-
- Dankner R, Chetrit A, Shanik MH, Raz I, Roth J.. Basal state hyperinsulinemia in healthy normoglycemic adults heralds dysglycemia after more than two decades of follow up. Diabetes Metab Res Rev 2012;28:618–624 - PubMed
-
- Page MM, Johnson JD.. Mild suppression of hyperinsulinemia to treat obesity and insulin resistance. Trends Endocrinol Metab 2018;29:389–399 - PubMed
MeSH terms
Grants and funding
LinkOut - more resources
Full Text Sources
Medical
