Hypertension Diagnosis, Treatment, and Control in India
- PMID: 37870834
- PMCID: PMC10594142
- DOI: 10.1001/jamanetworkopen.2023.39098
Hypertension Diagnosis, Treatment, and Control in India
Abstract
Importance: Hypertension is a major cause of morbidity and mortality worldwide. Previous efforts to characterize gaps in the hypertension care continuum-including diagnosis, treatment, and control-in India did not assess district-level variation. Local data are critical for planning, implementation, and monitoring efforts to curb the burden of hypertension.
Objective: To examine the hypertension care continuum in India among individuals aged 18 to 98 years.
Design, setting, and participants: The nationally representative Fifth National Family Health Survey study was conducted in 2 phases from June 17, 2019, to March 21, 2020, and from November 21, 2020, to April 30, 2021, among 1 895 297 individuals in 28 states, 8 union territories, and 707 districts of India.
Exposures: District and state of residence, urban classification, age (18-39, 40-64, and ≥65 years), sex, and household wealth quintile.
Main outcomes and measures: Hypertension was defined as a self-reported diagnosis or a newly measured blood pressure of 140/90 mm Hg or more. The proportion of individuals diagnosed (self-reported), the proportion of individuals treated among those diagnosed (self-reported medication use), and the proportion of individuals with blood pressure control among those treated (blood pressure <140/90 mm Hg [aged 18-79 years] or <150/90 mm Hg [aged ≥80 years]) were calculated based on national guidelines. Age-standardized estimates of treatment and control were also provided among the total with hypertension. To assess differences in the care continuum between or within states (ie, between districts), the variance was partitioned using generalized linear mixed models.
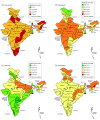
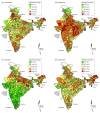
Results: Of the 1 691 036 adult respondents (52.6% women; mean [SD] age, 41.6 [16.5] years), 28.1% (95% CI, 27.9%-28.3%) had hypertension, of whom 36.9% (95% CI, 36.4%-37.3%) received a diagnosis. Among those who received a diagnosis, 44.7% (95% CI, 44.1%-45.3%) reported taking medication (corresponding to 17.7% [95% CI, 17.5%-17.9%] of the total with hypertension). Among those treated, 52.5% (95% CI, 51.7%-53.4%) had blood pressure control (corresponding to 8.5% [95% CI, 8.3%-8.6%] of the total with hypertension). There were substantial variations across districts in blood pressure diagnosis (range, 6.3%-77.5%), treatment (range, 8.7%-97.1%), and control (range, 2.7%-76.6%). Large proportions of the variation in hypertension diagnosis (94.7%), treatment (93.6%), and control (97.3%) were within states, not just between states.
Conclusions and relevance: In this cross-sectional survey study of Indian adults, more than 1 in 4 people had hypertension, and of these, only 1 in 3 received a diagnosis, less than 1 in 5 were treated, and only 1 in 12 had blood pressure control. National mean values hide considerable state-level and district-level variation in the care continuum, suggesting the need for targeted, decentralized solutions to improve the hypertension care continuum in India.
Conflict of interest statement
Figures


References
-
- World Health Organization . The global health observatory: blood pressure/hypertension. Accessed March 5, 2023. https://www.who.int/data/gho/indicator-metadata-registry/imr-details/3155
-
- United Nations, Department of Economic and Social Affairs . The 17 goals. Accessed February 2, 2023. https://sdgs.un.org/goals
-
- Geldsetzer P, Manne-Goehler J, Marcus ME, et al. . The state of hypertension care in 44 low-income and middle-income countries: a cross-sectional study of nationally representative individual-level data from 1·1 million adults. Lancet. 2019;394(10199):652-662. doi:10.1016/S0140-6736(19)30955-9 - DOI - PubMed
-
- World Health Organization . Hypertension. August 25, 2021. Accessed January 30, 2023. https://www.who.int/news-room/fact-sheets/detail/hypertension
Publication types
MeSH terms
Grants and funding
LinkOut - more resources
Full Text Sources
Medical
Miscellaneous

