. 2023 Oct 23;8(20):e165817.
doi: 10.1172/jci.insight.165817.

Activation of acetyl-CoA synthetase 2 mediates kidney injury in diabetic nephropathy

Affiliations

Activation of acetyl-CoA synthetase 2 mediates kidney injury in diabetic nephropathy

Jian Lu et al. JCI Insight. .

Abstract

Albuminuria and podocyte injury are the key cellular events in the progression of diabetic nephropathy (DN). Acetyl-CoA synthetase 2 (ACSS2) is a nucleocytosolic enzyme responsible for the regulation of metabolic homeostasis in mammalian cells. This study aimed to investigate the possible roles of ACSS2 in kidney injury in DN. We constructed an ACSS2-deleted mouse model to investigate the role of ACSS2 in podocyte dysfunction and kidney injury in diabetic mouse models. In vitro, podocytes were chosen and transfected with ACSS2 siRNA and ACSS2 inhibitor and treated with high glucose. We found that ACSS2 expression was significantly elevated in the podocytes of patients with DN and diabetic mice. ACSS2 upregulation promoted phenotype transformation and inflammatory cytokine expression while inhibiting podocytes' autophagy. Conversely, ACSS2 inhibition improved autophagy and alleviated podocyte injury. Furthermore, ACSS2 epigenetically activated raptor expression by histone H3K9 acetylation, promoting activation of the mammalian target of rapamycin complex 1 (mTORC1) pathway. Pharmacological inhibition or genetic depletion of ACSS2 in the streptozotocin-induced diabetic mouse model greatly ameliorated kidney injury and podocyte dysfunction. To conclude, ACSS2 activation promoted podocyte injury in DN by raptor/mTORC1-mediated autophagy inhibition.

Keywords: Diabetes; Metabolism; Molecular biology; Nephrology.


Conflict of interest statement

Conflict of interest: The authors have declared that no conflict of interest exists.

Figures

Figure 1
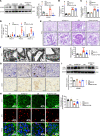
Figure 1. ACSS2 expression in kidneys of patients with DN and diabetic mice.
(A) The periodic acid–Schiff (PAS) staining in human renal cortical tissues from normal kidney poles and individuals with histopathological lesions of DN. The representative images of immunohistochemical staining show the expression of ACSS2 in these individuals (original magnification ×400; scale bars, 50 and 100 μm). (B) The immunofluorescence staining showed the colocalization of podocyte-specific marker WT-1 (red) and ACSS2 (green) in the kidney of healthy individuals and DN participants. Nuclei were stained with DAPI (blue) (original magnification ×400; scale bars, 50 μm). (C) Relative ACSS2 protein expression levels in the kidneys from wild-type mice or STZ-induced diabetic mice for 12 weeks (n = 3 biological replicates, t test) or from db/db mice (n = 3 biological replicates, t test, mean ± SD, **P < 0.01 vs. Ctrl or ##P < 0.01 vs. db/m control). (D) Relative ACSS2 protein expression levels in the renal glomerulus and renal tubules from wild-type mice or 12-week STZ-induced diabetic mice (n = 3 biological replicates, t test, mean ± SD, **P < 0.01, ***P < 0.001. STZ, streptozotocin.
Figure 2
Figure 2. Knockdown or inhibition of ACSS2 attenuates HG-induced inflammation, prevents phenotypic transformation, and restores autophagy in podocytes.
For AC, HG-stimulated podocytes were treated with ACSS2 siRNA or control siRNA for 24 hours. Mean ± SD, *P < 0.05, **P < 0.01, ***P < 0.001 vs. control siRNA; #P < 0.05, ##P < 0.01 ###P < 0.001 vs. HG + control siRNA (n = 3 biological replicates, 1-way ANOVA). (A) Real-time PCR and Western blotting analysis of ACSS2, nephrin, and α-SMA. (B) Real-time PCR analysis of mRNA expression of inflammatory factors (TNF-α, IL-6, and MCP-1). (C)Western blotting analysis of LC3 and p62. For D, E, and G, HG-stimulated podocytes with or without ACSS2 inhibitor (10 μmol/L) for 24 hours (mean ± SD, *P < 0.05, ***P < 0.001 vs. Ctrl; #P < 0.05, ##P < 0.01, ###P < 0.001 vs. HG, n = 3). For F and H, HG-stimulated podocytes with or without ACSS2 inhibitor (10 μmol/L) for 24 hours (mean ± SD, *P < 0.05, **P < 0.01 vs. Ctrl; #P < 0.05, ##P < 0.01, ###P < 0.001 vs. HG, n = 3). (D) Real-time PCR analysis of nephrin and α-SMA (n = 3 biological replicates, 1-way ANOVA). (E) Representative confocal microscopic images showing the expression of nephrin (green) and α-SMA (red). Nuclei were stained with DAPI (blue). Original magnification ×600; scale bars, 100 μm. (F) Western blotting analysis of nephrin and α-SMA (n = 3 biological replicates, 1-way ANOVA). (G) Real-time PCR analysis of the expression of inflammatory factors (TNF-α, IL-6, and MCP-1) (n = 3 biological replicates, 1-way ANOVA). (H) Western blotting analysis of LC3 and p62 (n = 3 biological replicates, 1-way ANOVA).
Figure 3
Figure 3. Protective effects of ACSS2 deletion on podocyte injury in STZ-induced diabetic mice.
Four groups of mice of control (Ctrl) (n = 6), ACSS2 knockout (ACSS2 KO) (n = 5), diabetes (DM) (n = 6), and ACSS2 knockout with diabetes (ACSS2 KO + DM) (n = 6) were sacrificed at week 12. Data are expressed as mean ± SD or median with interquartile range, *P < 0.05, ***P < 0.001 vs. Ctrl; ##P < 0.01, ###P < 0.001 vs. DM). (A) Representative Western blotting images and densitometric analysis of ACSS2 protein expression in renal cortexes (n = 3 biological replicates, 1-way ANOVA). (B) The level of fasting blood glucose (n = 5–6 biological replicates, 1-way ANOVA). (C) The kidney weight–to–body weight ratio (n = 5–6 biological replicates, 1-way ANOVA). (D) Urinary albumin-to-creatinine ratio (ACR) was detected at weeks 4, 8, and 12 (n = 5–6 biological replicates, 1-way ANOVA). (E) Representative images of PAS-stained kidney sections (original magnification, ×400; scale bars, 100 μm). Bar graph analysis shows the quantification of the mesangial expansion area percentage (n = 10 biological replicates, 1-way ANOVA). (F) Representative images of glomerular ultrastructural change such as podocyte effacement and glomerular basement membrane (GBM) thickness observed by electron microscopy (original magnification ×40,000; scale bars, 1 μm). (G) Representative immunohistochemical staining images of α-SMA and CD68 (original magnification ×200, ×100; scale bars, 50 μm). (H) Representative confocal microscopic images showing the expression of LC3 (green) and WT-1 (red). Nuclei were stained with DAPI (blue). The quantifications of WT-1 (green) per glomerulus in the kidney (n = 20 biological replicates, 1-way ANOVA) were analyzed (original magnification ×400; scale bars, 50 μm). (I) Representative Western blotting images and densitometric analysis of LC3 protein expression (n = 3 biological replicates, 1-way ANOVA).
Figure 4
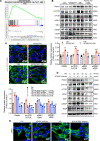
Figure 4. ACSS2 activation inhibits autophagy by upregulating the raptor-mediated mTORC1 pathway in podocytes.
(A) Gene set enrichment analysis (GSEA) highlights strong rapamycin-sensitive pathway enrichment. (B) Western blotting analysis for the phosphorylation activation of raptor, mTOR, S6K1, and 4EBP in renal cortex tissues prepared from vehicle- or STZ-treated mice with or without ACSS2 KO after the 12-week observation period (mean ± SD, **P < 0.01, ***P < 0.001 vs. Ctrl; ##P < 0.01, ###P < 0.001, vs. DM, n = 3 biological replicates, 1-way ANOVA). (C) Representative confocal images illustrate p-S6K1 (green) and WT-1 (red) expression changes in kidney sections. Nuclei were stained with DAPI (blue) (original magnification ×400; scale bars, 50 μm, n = 3). (D) Western blotting analysis for raptor and the phosphorylation activation of mTOR, S6K1, and 4EBP in HG-stimulated podocytes treated with ACSS2-specific inhibitor (0, 0.1, 1, 10, 20 μmol/L) for 24 hours (mean ± SD, *P < 0.05, **P < 0.01, ***P < 0.001 vs. Ctrl; ##P < 0.01, ###P < 0.001 vs. HG, n = 3 biological replicates, 1-way ANOVA). (E) Representative confocal images illustrating p-S6K1 expression changes in HG-stimulated podocytes treated with ACSS2-specific inhibitor (10 μmol/L) for 24 hours. Nuclei were stained with DAPI (blue) (original magnification ×600; scale bars, 50 μm; n = 3).
Figure 5
Figure 5. The ACSS2 inhibitor ameliorates kidney injury in diabetic mice.
Diabetes was induced by intraperitoneal injection of STZ. The corresponding control mice were treated with vehicle (Ctrl). Diabetic mice were treated with vehicle (DM) or ACSS2 inhibitor (50 mg/kg) (DM+ACSS2 inhibitor). The mice were euthanized at week 12. Data are expressed as mean ± SD. *P < 0.05, **P < 0.01, ***P < 0.001 vs. Ctrl; #P < 0.05, ##P < 0.01, ###P < 0.01 vs. DM, n = 6). (A) Kidney hypertrophy was determined by the ratio of kidney weight to body weight (n = 6 biological replicates, 1-way ANOVA). (B) Urinary ACR was measured by commercial ELISA for microalbuminuria and creatinine detection assay (n = 6 biological replicates, 1-way ANOVA). (C) Representative images of PAS-stained kidney sections (original magnification ×400; scale bars, 100 μm). Bar graph analysis shows the quantification of the mesangial expansion area percentage (n = 10 biological replicates, 1-way ANOVA). (D) Representative images of glomerular ultrastructural change such as podocyte effacement and GBM thickness were observed by electron microscopy (original magnification ×40,000; scale bars, 500 nm). (E) Representative immunohistochemical staining images of α-SMA in kidney sections (original magnification ×200; scale bars, 200 μm). (F) Representative confocal microscopic images showing the expression of LC3 (green) and WT-1 (red). Nuclei were stained with DAPI (blue). The quantifications of WT-1 (green) per glomerulus in the kidney (n = 20 biological replicates, 1-way ANOVA) were analyzed (original magnification ×400; scale bars, 50 μm). (G) Representative confocal microscopic images showing the expression of p-S6K1 (green) and WT-1 (red). Nuclei were stained with DAPI (blue) (original magnification ×400; scale bars, 50 μm). (H) Western blotting analysis for raptor and the phosphorylation activation of mTOR, S6K1, 4EBP, and LC3 in renal cortex tissues (n = 3 biological replicates, 1-way ANOVA).
Figure 6
Figure 6. TFEB acts as a downstream effector for the activation of the mTORC1 pathway in HG-stimulated podocytes.
(A) Western blotting analysis for p-TFEB and TFEB in HG-stimulated podocytes treated with ACSS2-specific inhibitor (0, 0.1, 1, 10, 20 μmol/L) for 24 hours (mean ± SD, ***P < 0.001 vs. Ctrl; ###P < 0.001 vs. HG, n = 3 biological replicates, 1-way ANOVA). (B) Western blotting analysis for p-TFEB and TFEB in HG-stimulated podocytes transfected with control siRNA or ACSS2 siRNA for 24 hours (mean ± SD, ***P < 0.001 vs. control siRNA; ###P < 0.001 vs. HG + control siRNA, n = 3 biological replicates, 1-way ANOVA). (C) Representative confocal microscopic images showing TFEB (green) expression and DAPI (blue) in HG-stimulated podocytes treated with ACSS2-specific inhibitor (10 μmol/L) for 24 hours (original magnification ×600; scale bars, 50 μm). (D) Real-time PCR analysis for the reverse effects of TFEB knockdown on the mRNA expression of TFEB, LC3B, CTSB, and LAMP1 in podocytes treated with ACSS2 inhibitor (mean ± SD, *P < 0.05, **P < 0.01, ***P < 0.001 vs. HG + control siRNA; ##P < 0.01, ###P < 0.01 vs. HG+ACSS2 inhibitor+control siRNA, n = 3 biological replicates, 1-way ANOVA). (E) Western blotting analysis for LC3 in HG-stimulated podocytes transfected with control siRNA or TFEB siRNA for 24 hours (mean ± SD, ***P < 0.001 vs. Ctrl; ##P < 0.01 vs. HG, n = 3 biological replicates, 1-way ANOVA).
Figure 7
Figure 7. ACSS2 activation contributes to raptor transcriptional activation via H3K9ac in HG-treated podocytes.
(A and B) Western blotting analysis showing the effects of inhibition (A) or gene knockdown (B) of ACSS2 on H3K9ac levels in podocytes treated with HG (mean ± SD, *P < 0.05 vs. Ctrl or ***P < 0.001 vs. control; ##P < 0.01, ###P < 0.001 vs. HG; $$$P < 0.001 vs. control siRNA, n = 3 biological replicates, 1-way ANOVA). (C) Gene deletion of ACSS2 decreases the diabetes-induced upregulation of H3K9ac at raptor promoters in mouse kidneys (mean ± SD, ***P < 0.001 vs. Ctrl; ###P < 0.001 vs. DM, n = 3 biological replicates, 1-way ANOVA). (D) Chromatin immunoprecipitation (ChIP) analysis showing H3K9 acetylation levels in the promoters of raptor using antibodies to H3K9ac (mean ± SD, *P < 0.05, **P < 0.01, ***P < 0.001 vs. Ctrl; #P < 0.05, ###P < 0.001 vs. HG, n = 3 biological replicates, 1-way ANOVA). (E) The reverse effects of OSS_128167 (a selective inhibitor that increases the acetylation of H3K9) to the transcriptional expression of raptor, which was inhibited by ACSS2 inhibitor on podocytes (mean ± SD, ***P < 0.001 vs. Ctrl; ###P < 0.001 vs. HG; $$P < 0.01 vs. HG, n = 3 biological replicates, 1-way ANOVA).

References

    1. Akhtar M, et al. Diabetic kidney disease: past and present. Adv Anat Pathol. 2020;27(2):87–97. doi: 10.1097/PAP.0000000000000257. - DOI - PubMed
    1. Tye SC, et al. Precision medicine approaches for diabetic kidney disease: opportunities and challenges. Nephrol Dial Transplant. 2021;36(suppl 2):3–9. doi: 10.1093/ndt/gfab045. - DOI - PMC - PubMed
    1. Yamazaki T, et al. Treatment of diabetic kidney disease: current and future. Diabetes Metab J. 2021;45(1):11–26. doi: 10.4093/dmj.2020.0217. - DOI - PMC - PubMed
    1. Jiang A, et al. Modes of podocyte death in diabetic kidney disease: an update. J Nephrol. 2022;35(6):1571–1584. doi: 10.1007/s40620-022-01269-1. - DOI - PubMed
    1. Liu S, et al. Podocyte injury in diabetic kidney disease: a focus on mitochondrial dysfunction. Front Cell Dev Biol. 2022;10:832887. doi: 10.3389/fcell.2022.832887. - DOI - PMC - PubMed

Publication types