. 2024 Jan 1;73(1):75-92.
doi: 10.2337/db23-0212.

Single-Cell Transcriptome Profiling of Pancreatic Islets From Early Diabetic Mice Identifies Anxa10 for Ca2+ Allostasis Toward β-Cell Failure

Affiliations

Single-Cell Transcriptome Profiling of Pancreatic Islets From Early Diabetic Mice Identifies Anxa10 for Ca2+ Allostasis Toward β-Cell Failure

Kaori Motomura et al. Diabetes. .

Abstract

Type 2 diabetes is a progressive disorder denoted by hyperglycemia and impaired insulin secretion. Although a decrease in β-cell function and mass is a well-known trigger for diabetes, the comprehensive mechanism is still unidentified. Here, we performed single-cell RNA sequencing of pancreatic islets from prediabetic and diabetic db/db mice, an animal model of type 2 diabetes. We discovered a diabetes-specific transcriptome landscape of endocrine and nonendocrine cell types with subpopulations of β- and α-cells. We recognized a new prediabetic gene, Anxa10, that was induced by and regulated Ca2+ influx from metabolic stresses. Anxa10-overexpressed β-cells displayed suppression of glucose-stimulated intracellular Ca2+ elevation and potassium-induced insulin secretion. Pseudotime analysis of β-cells predicted that this Ca2+-surge responder cluster would proceed to mitochondria dysfunction and endoplasmic reticulum stress. Other trajectories comprised dedifferentiation and transdifferentiation, emphasizing acinar-like cells in diabetic islets. Altogether, our data provide a new insight into Ca2+ allostasis and β-cell failure processes.

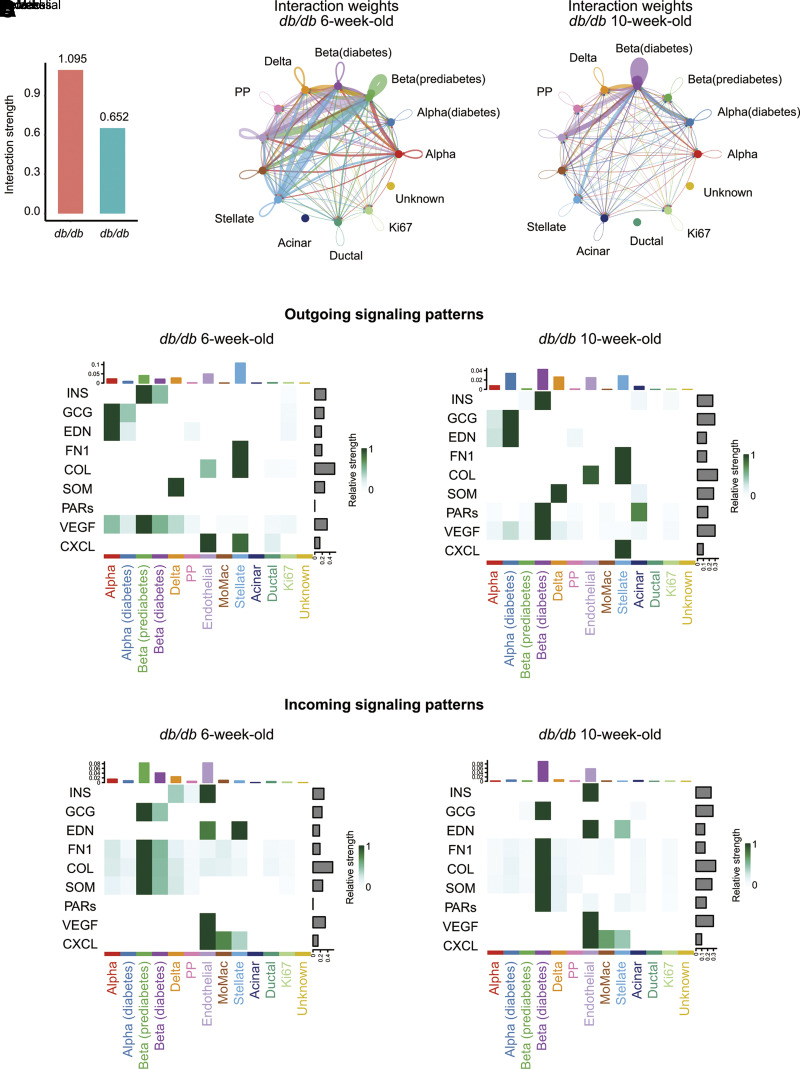
Article highlights: The transcriptome of single-islet cells from healthy, prediabetic, and diabetic mice was studied. Distinct β-cell heterogeneity and islet cell-cell network in prediabetes and diabetes were found. A new prediabetic β-cell marker, Anxa10, regulates intracellular Ca2+ and insulin secretion. Diabetes triggers β-cell to acinar cell transdifferentiation.


Conflict of interest statement

Duality of Interest. T.Og. is currently an employee of Daiichi Sankyo Co., Ltd. No other potential conflicts of interest relevant to this article were reported.

Figures

Figure 1
Figure 1
scRNA-seq analysis of pancreatic islet cells isolated from db+/+ and db/db mice. A: Schematic of the experimental workflow for scRNA-seq of pancreatic islets. Pancreatic islets were isolated from 6-week-old db+/+ (nondiabetic control) (n = 5), 6-week-old prediabetic db/db (n = 4), and 10-week-old diabetic db/db (n = 3). B: Two-dimensional fast Fourier transform–accelerated interpolation-based t-stochastic neighborhood embedding (FItSNE) visualization of 4,956 islet cells from 6-week-old db+/+, 6-week-old prediabetic db/db, and 10-week-old diabetic db/db mice. Each dot represents the transcriptome of a single cell, color coded according to its origin (age and genotype, left) and its cellular identity (right). C: FItSNE representation of known markers of endocrine (Gcg, Ins1, Sst, and Ppy), endothelial (Plvap), monocyte-macrophage (MoMac) (Cd74), stellate (Col1a1), acinar (Prss1), ductal (Krt19), and Ki67-positive (Mki67) cells. D: Violin plot of Ins1. E: Percentages of each cell type in pancreatic islets of indicated groups. F: Percentages of nondiabetic, prediabetic, and diabetic β-cells of indicated groups. TAS-seq, terminator-assisted solid-phase cDNA amplification and sequencing.
Figure 2
Figure 2
Specific IPA pathways and DEGs in β-cell clusters. IPA of DEGs (left), DEGs (middle), and feature plots of the most upregulated genes (right) in β-cell clusters. The number of genes that exhibited a significantly altered expression in each IPA pathway is shown within the parentheses. FItSNE, fast Fourier transform–accelerated interpolation-based t-stochastic neighborhood embedding.
Figure 3
Figure 3
Identification of Anxa10 as a marker for prediabetic β-cells. A: Violin plot of Anxa10 and Aldh1a3. B: Anxa10 and Aldh1a3 expression levels in isolated islets from 6-week-old db+/+ (n = 4), 10-week-old db+/+ (n = 3), 6-week-old prediabetic db/db (n = 4), and 10-week-old diabetic db/db (n = 4) mice were measured by quantitative real-time PCR. Data are mean ± SEM. C: Representative confocal images of pancreatic sections from db+/+ and db/db mice at indicated ages stained with antibodies against Anxa10, insulin, and DAPI. Scale bars, 50 μm. D: Representative confocal images of pancreatic sections from vehicle or STZ-administered C57BL/6J mice stained with antibodies to Anxa10 and insulin. Scale bars, 50 μm. E: Expression levels of Anxa10 in MIN6 cells incubated in DMEM containing low glucose (LG) (5.5 mmol/L) or high glucose (HG) (25 mmol/L) and treated with or without palmitate (500 μmol/L), treated with ER stressors (1 μmol/L thapsigargin [TG], 1 μg/mL tunicamycin [TM]), potassium channel blocker tolbutamide (Tol) (300 μmol/L), or KCl (30 mmol/L) with or without Ca2+ channel blocker verapamil (10 or 50 μmol/L) for 24 h. Data are mean ± SEM (n = 3). F: Anxa10 expression levels in isolated islets from 8-week-old male C57BL/6J mice treated with palmitate (500 μmol/L), TG (1 μmol/L), Tol (300 μmol/L), or KCl (30 mmol/L) with or without verapamil (50 μmol/L) for 24 h. Data are mean ± SEM (n = 3). G: Representative confocal images of pancreatic sections from db/db mice treated with vehicle, verapamil (1 mg/m in drinking water), or empagliflozin (0.03% in diet) for 2 weeks. Sections were stained with antibodies to Anxa10, insulin, and DAPI. Scale bars, 50 μm. H: The quantification of Anxa10-positive β-cells per total β-cells. Data are mean ± SEM (n = 3 mice/group). *P < 0.05, **P < 0.01, ***P < 0.001, ****P < 0.0001. Ctrl, control; Verapa, verapamil.
Figure 4
Figure 4
Expression of β-cell ANXA10 is increased in human prediabetic islets. A: Violin and box plots of Anxa10 expression levels in islets from donors without diabetes and donors with diabetes of three National Center for Biotechnology Information data sets (GSE50397, GSE50244, and GSE38642). B: Representative fluorescence images of pancreatic sections from patients with pancreatic cancer without diabetes, with prediabetes, and with diabetes that were stained with antibodies to ANXA10, insulin, and DAPI. Scale bars, 50 μm. C: Quantitative analysis of Anxa10-positive β-cells per total β-cells. To evaluate the average percentage of Anxa10-positive β-cells in total β-cells for each patient, islets from patients without diabetes (n = 5), with prediabetes (n = 6), and diabetes (n = 6) were evaluated in sections stained for ANXA10 and insulin (n = 2–7 islets/patient). **P < 0.01. DM, with diabetes; non-DM, without diabetes; pre-DM, with prediabetes.
Figure 5
Figure 5
Anxa10 overexpression alters insulin secretion and [Ca2+]i levels in β-cells. A: mRNA levels of Anxa10 in pancreatic islets from 8-week-old male C57BL/6J mice infected with full-length Anxa10-expressing adenovirus (Ad-Anxa10) or control adenovirus (Ad-mock) for 48 h. B: GSIS or KSIS in pancreatic islets infected with Ad-mock or Ad-Anxa10 for 48 h (n = 4–12). C: Insulin content in pancreatic islets infected with Ad-mock or Ad-Anxa10 for 48 h (n = 4–6). D: Knockdown of Anxa10 in pancreatic islets from prediabetic db/db mice. Islets isolated from 6-week-old db/db mice were infected with adenovirus-expressing shRNA targeting LacZ (Ad-shLacZ) or Anxa10 (Ad-shAnxa10) for 72 h (n = 3). E: GSIS or KSIS in pancreatic islets infected with Ad-shLacZ or Ad-shAnxa10 for 72 h (n = 4–22). F: Insulin content in pancreatic islets infected with Ad-shLacZ or Ad-shAnxa10 for 72 h (n = 4–7). G: Time course of [Ca2+]i in response to 20 mmol/L glucose and the area under the curve (AUC) of the glucose-induced changes in [Ca2+]i in MIN6 cells stably expressing GFP (n = 7) or GFP-Anxa10 (n = 8). H: Time course of [Ca2+]i in response to 30 mmol/L KCl and the K+-induced changes in [Ca2+]i in MIN6 cells stably expressing GFP (n = 5) or GFP-Anxa10 (n = 5). I and J: Time course of [Ca2+]i in response to 1 μmol/L thapsigargin (TG) and the AUC of TG-induced changes in [Ca2+]i in MIN6 cells stably expressing GFP (n = 10–13) or GFP-Anxa10 (n = 5–6) with (I) or without (J) Ca2+ in the extracellular medium. Data are mean ± SEM. *P < 0.05, **P < 0.01, ***P < 0.001, ****P < 0.0001. HG, high glucose; LG, low glucose.
Figure 6
Figure 6
Pseudotime analysis of β-cells in prediabetic and diabetic db/db mice. A: Two-dimensional fast Fourier transform–accelerated interpolation-based t-stochastic neighborhood embedding (FItSNE) visualization of 2,079 β-cells from 6-week-old and 10-week-old db/db islets. Cells are colored by age (left) or cluster (right). B: Heatmap displaying the top 30 upregulated genes in β-cell subclusters Beta-0, -1, -2, -4, -5, -6, -7, and -8 except for subcluster 3 (top 11 upregulated genes) and subcluster 0 (only 1 gene). C: Feature and violin plots of Ins1, Pdx1, Slc2a2, Neurog3, Ddit3, Anxa10, and Aldh1a3. D: Top 3 ingenuity pathways of β-cell clusters. The number of genes that exhibited a significantly altered expression in each IPA pathway is shown within the parentheses. E: Pseudotime analysis shows four predicted trajectories of db/db β-cells during type 2 diabetes progression. The percentages of cells in the different β-cell clusters are indicated in the respective boxes (6-week-old db/db and 10-week-old db/db).
Figure 7
Figure 7
Identification of acinar-like β-cells in diabetic db/db islets. A: P value comparison of Beta-7–enriched top 5 pathways in β-cell subclusters, islet acinar cell cluster (cluster 17), and islet δ-cell cluster (cluster 4). BD: Representative images of pancreatic sections from 6- and 10-week-old db+/+ and db/db mice stained with hematoxylin and eosin (H&E) (B) or antibodies to amylase, Ctrb, and insulin (C and D). Scale bars, 75 μm (C) and 50 μm (D).
Figure 8
Figure 8
Cell-cell communication analysis of db/db islets. A: The total number of interactions and interaction strength of the inferred cell-cell communication networks from 6- and 10-week-old db/db islets. B: Circle plot visualizations of the cell-cell interaction network among individual cell types in 6- and 10-week-old db/db islets. The circle size of each cell type is normalized to the cell number of each subset. Arrows and edge colors represent direction. The thickness of the lines connecting cells represents the interaction strength. The diabetic β-cell population includes clusters 1, 2, 7, and 8, and the diabetic α-cell population includes clusters 5 and 14 in Fig. 1B. C and D: Outgoing and incoming signaling patterns and strength of each islet cell population in 6- and 10-week-old db/db islets. The heatmaps represent the relative importance of each cell type based on the computed nine networks (associated with β-cells). CXCL, chemokine ligand; GCG, glucagon; fn1, fibronectin 1; MoMac, monocyte-macrophage.

References

    1. Cabrera O, Berman DM, Kenyon NS, Ricordi C, Berggren PO, Caicedo A. The unique cytoarchitecture of human pancreatic islets has implications for islet cell function. Proc Natl Acad Sci U S A 2006;103:2334–2339 - PMC - PubMed
    1. DeFronzo RA, Ferrannini E, Groop L, et al. Type 2 diabetes mellitus. Nat Rev Dis Primers 2015;1:15019. - PubMed
    1. Prentki M, Peyot ML, Masiello P, Madiraju SRM. Nutrient-induced metabolic stress, adaptation, detoxification, and toxicity in the pancreatic β-cell. Diabetes 2020;69:279–290 - PubMed
    1. Singh A, Kukreti R, Saso L, Kukreti S. Mechanistic insight into oxidative stress-triggered signaling pathways and type 2 diabetes. Molecules 2022;27:950. - PMC - PubMed
    1. Ghosh R, Colon-Negron K, Papa FR. Endoplasmic reticulum stress, degeneration of pancreatic islet β-cells, and therapeutic modulation of the unfolded protein response in diabetes. Mol Metab 2019;27(Suppl.):S60–S68 - PMC - PubMed

MeSH terms