. 2023 Oct 23;19(10):e1010776.
doi: 10.1371/journal.pgen.1010776. eCollection 2023 Oct.

A protease and a lipoprotein jointly modulate the conserved ExoR-ExoS-ChvI signaling pathway critical in Sinorhizobium meliloti for symbiosis with legume hosts

Affiliations

A protease and a lipoprotein jointly modulate the conserved ExoR-ExoS-ChvI signaling pathway critical in Sinorhizobium meliloti for symbiosis with legume hosts

Julian A Bustamante et al. PLoS Genet. .

Abstract

Sinorhizobium meliloti is a model alpha-proteobacterium for investigating microbe-host interactions, in particular nitrogen-fixing rhizobium-legume symbioses. Successful infection requires complex coordination between compatible host and endosymbiont, including bacterial production of succinoglycan, also known as exopolysaccharide-I (EPS-I). In S. meliloti EPS-I production is controlled by the conserved ExoS-ChvI two-component system. Periplasmic ExoR associates with the ExoS histidine kinase and negatively regulates ChvI-dependent expression of exo genes, necessary for EPS-I synthesis. We show that two extracytoplasmic proteins, LppA (a lipoprotein) and JspA (a lipoprotein and a metalloprotease), jointly influence EPS-I synthesis by modulating the ExoR-ExoS-ChvI pathway and expression of genes in the ChvI regulon. Deletions of jspA and lppA led to lower EPS-I production and competitive disadvantage during host colonization, for both S. meliloti with Medicago sativa and S. medicae with M. truncatula. Overexpression of jspA reduced steady-state levels of ExoR, suggesting that the JspA protease participates in ExoR degradation. This reduction in ExoR levels is dependent on LppA and can be replicated with ExoR, JspA, and LppA expressed exogenously in Caulobacter crescentus and Escherichia coli. Akin to signaling pathways that sense extracytoplasmic stress in other bacteria, JspA and LppA may monitor periplasmic conditions during interaction with the plant host to adjust accordingly expression of genes that contribute to efficient symbiosis. The molecular mechanisms underlying host colonization in our model system may have parallels in related alpha-proteobacteria.


Conflict of interest statement

The authors have declared that no competing interests exist.

Figures
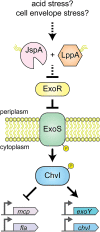
Fig 1
Fig 1. Model of how JspA and LppA influence the ExoR-ExoS-ChvI signaling pathway.
Schematic diagram shows relationship of pathway components, their subcellular locations, and impact on expression of representative genes. Pointed and blunt arrowheads represent positive and negative regulation, respectively. Solid arrows indicate previously demonstrated, direct interactions. Results from this study suggest that, in response to cell envelope stress such as exposure to acidic pH, JspA and LppA negatively regulate ExoR via proteolysis. As a typical pair of histidine kinase and response regulator, ExoS and ChvI are presumed to function as homodimers [13,30]; for simplicity, the diagram does not show that.
Fig 2
Fig 2. Schematics of the genomic regions around lppA and jspA and of their protein products.
(A) S. meilioti lppA (SMc00067) and jspA (SMc03872) share synteny with their respective orthologs in closely related alpha-proteobacteria, such as B. abortus and A. tumefaciens. Gene and ORF names are shown as annotated, with pentagonal arrows indicating directionality. Arrows with the same colors in different species represent probable homologs, with red arrows indicating lppA or jspA orthologs; genes without annotated functions or obvious orthologs in corresponding regions are depicted with shades of grey. RR and HK signify response regulators and histidine kinases. The drawing is to scale; bar indicates 1 kb. (B) lppA encodes a 148-aa lipoprotein, while jspA encodes a 497-aa metalloprotease. Both LppA and JspA contain lipoprotein signal peptides at their N-termini; the sequences of these leader peptides are shown, with red arrows indicating cleavage sites before the invariant cysteine of the lipobox motifs, underlined. The N-terminus of LppA was originally annotated as the 13th amino acid (V13) shown here, but extension of 12 amino acids provides a better signal sequence. JspA also contains M48 peptidase and LysM domains; key amino acids of the peptidase domain are displayed. Grey numbers indicate residues that border the predicted protein domains.
Fig 3
Fig 3. Calcofluor fluorescence, indicating EPS-I production, of strains expressing lppA or jspA.
Ten-fold serial dilutions (10−2 to 10−5) of logarithmic-phase cultures were spotted onto LB plates containing calcofluor and allowed to grow for three days prior to fluorescence imaging. Darker spots on representative images indicate brighter fluorescence. Fluorescence levels were measured relative to the S. meliloti Rm1021 wild-type (WT) strain carrying an empty vector on each plate. (A) WT strains or ΔlppA or ΔjspA mutants carrying the vector (pCM130 or pJC478) or a plasmid with lppA under the control of a taurine-inducible promoter (pJC532) were grown on plates containing 100 mM taurine. (B, C) WT strains or ΔjspA or ΔlppA mutants carrying the vector or a plasmid with jspA under the control of a taurine-inducible promoter (pJC535) were grown on plates containing (B) 2.5, (C) 5, or 10 mM taurine. Error bars represent standard deviations. Relative fluorescence intensities were not calculated for 5 and 10 mM taurine due to growth inhibition of select strains. *, p < 0.05; ns, not significant.
Fig 4
Fig 4. Proportions of root nodules colonized by each bacterial strain after competitive infection.
The predominant strain colonizing each nodule was determined after seedlings were inoculated with equal mixtures of two strains. (A) S. meliloti Rm1021 and its derivatives were used to infect M. sativa, while (B) S. medicae WSM419 and its derivatives were used to infect M. truncatula. Rm1021 (Ω) is a derivative of Rm1021 marked with resistance to spectinomycin, while WSM419R are derivatives of WSM419 marked with resistance to spectinomycin or neomycin. Mutations in jspA or lppA in Rm1021 were deletions or transposon insertions, while those in WSM419 were all deletions. Percentages (± standard deviations) below each competition indicate the mean proportions of nodules containing the jspA or lppA mutant, wild type (WT), or a mixture of the two, while the graphs depict relative abundance when mixed nodules are excluded. Dark grey circles indicate the percentage of nodules occupied by WT for individual competition trials. Error bars represent standard deviations. *, p < 0.05; **, p < 0.01. Bottom row of each table [Trials (nodules)] indicates the number of trials (and total number of nodules assessed) per competition. Detailed results from the competitive symbiosis assays are available in S4 Table.
Fig 5
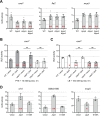
Fig 5. Expression levels of select promoters in different genetic backgrounds.
Expression was measured using transcriptional fusions to uidA (encoding the GUS reporter). (A) Expression levels from exoY, flaC, and mcpU promoters in ΔjspA, ΔlppA, and ΔjspA ΔlppA mutants were compared against those in wild type (WT) grown in LB. (B, C) Expression from the exoY promoter was measured in different strains overexpressing (B) jspA or (C) lppA when grown under conditions listed below the graphs. (D) Expression levels from chvI, SMc01580, and mcpU promoters were assessed when JspA or JspAE148A was induced in PYE with 10 mM taurine for 4.5 hours. Error bars represent standard deviations. Red asterisks within bars indicate statistically significant differences when compared against the wild type or vector-bearing strain (leftmost strain in each plot), while black asterisks above bars represent significant differences between two strains under comparison: *, p < 0.05; **, p < 0.01; ns, not significant. Data for GUS reporter expression are available in S5 Table.
Fig 6
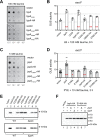
Fig 6. Expression of mutant lppA and jspA alleles in S. meliloti.
(A) Calcofluor fluorescence was used to assess EPS-I production in ΔlppA mutants expressing different alleles of lppA from a taurine-inducible promoter. (B) Overexpressing different alleles of lppA in the ΔlppA mutant affected expression from the exoY promoter to varying degrees, as measured with transcriptional fusion to GUS. (C, D) Wild-type Rm1021 expressing different jspA alleles from a taurine-inducible promoter exhibit varying levels of (C) fluorescence on calcofluor plates and (D) expression from the exoY promoter. (E) Immunoblots show steady-state levels of different versions of HA epitope-tagged LppA in wild-type (WT), ΔlppA, and ΔjspA backgrounds. Samples were harvested from cultures grown in LB with 100 mM taurine for 6 hours. (F) Immunoblot shows steady-state levels of of JspA-HA and JspAE148A-HA in different genetic backgrounds. Samples were harvested from wild type or ΔlppA or ΔjspA mutants, carrying different plasmids, grown in PYE with 10 mM taurine for 4.5 hours. Presence or absence of chromosomal jspA and lppA (+ or Δ) are indicated above each lane. Numbers to the right of immunoblots (E, F) indicate approximate molecular mass standards, in kDa. Plasmids pJC532, pJC605, pJC606, pJC607, pJC608, and pJC609 were used for expressing lppA, lppAC23S, lppA-HA, lppAC23S-HA, lppAG96W-HA, and lppAA78S-HA, while pJC535, pJC555, pJC556, pJC558, pJC559, pJC560, and pJC561 were used for jspA, jspAE148A, jspAE148D, jspA-HA, jspAE148A-HA, jspAE148D-HA, and jspAH147A-HA, respectively. Vectors used were pCM130 (A, B, D, F) or pJC478 (C). LppA and JspA variants are named according to their altered residues: for example, C23S-HA indicates LppAC23S-HA. Error bars represent standard deviations. Red asterisks within bars indicate statistical significance when compared against the vector-carrying strain (leftmost strain in each plot): *, p < 0.05; **, p < 0.01. Data for GUS reporter expression are available in S5 Table.
Fig 7
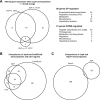
Fig 7. Venn diagrams depicting overlaps of gene sets.
(A) Circles of the Venn diagram represent the numbers of genes whose expression changed >1.5-fold in three pairwise comparisons: between strains that overexpress wild-type JspA or mutant JspAE148A (JspA vs. JspAE148A), between strains that overexpress JspA or carry the vector pCM130 (JspA vs. vector), or between strains that overexpress mutant JpsA or carry the vector (JspAE148A vs. vector). The 141 genes that appeared in both the JspA vs. vector and JspA vs. JspAE148A comparisons were grouped according to their functions, as listed on the right. ChvI belongs to the group of regulators whose gene expression increased when JspA was overexpressed. (B, C) The bottom Venn diagrams represent the overlaps of (B) genes that belong to the JspA or ExoR/ExoS transcriptome or ChvI regulon and (C) those that belong to the RpoH1 or JspA transcriptome. Gene sets and analyses of their overlaps are provided in S6 and S7 Tables. See Materials and methods for details about assignment of genes to the ChvI regulon and ExoR/ExoS transcriptome.
Fig 8
Fig 8. Epistatic interaction between jspA and lppA and the exoR-exoS-chvI pathway.
(A) Calcofluor fluorescence of wild-type and mutant strains were assessed by spotting ten-fold serial dilutions of cultures onto LB plates. Strain genotypes are shown to the left of the fluorescence images. Representative images are shown, and at least two replicates were included for each comparison. Measurements of relative fluorescence are available in S2C Table. (B) Expression of the exoY-uidA reporter was monitored in strains replete with or depleted of ChvI, while jspA or jspAE184A was ectopically expressed. Relevant alleles on the chromosome and on plasmids are indicated below the plot: first row indicates the presence or absence of chromosomal chvI (+ or Δ), second row indicates presence of empty vector or a plasmid that expresses chvI (vector or +), and the third row indicates presence of vector or a plasmid that expresses wild-type or mutant jspA (vector, +, or E148A, respectively). Strains with the ΔchvI allele (rightmost three strains) carried a complementing plasmid (pAD101) with chvI under the control of the Plac promoter (Plac-chvI): growth in the presence or absence of IPTG resulted in expression or depletion of ChvI. For comparison, chvI+ strains carried the Plac-chvI plasmid or the corresponding parent vector (pSRKKm). All the strains also bore a compatible vector (pCM130) or its derivatives that enable taurine-regulated expression of jspA or jspAE184A (pJC535 or pJC555). Strains were grown in LB with 10 mM taurine for 6 hours, while expressing or depleting ChvI, prior to measurement of GUS activities. Averages and standard deviations (error bars) were calculated with measurements from at least four different days (S5E Table). **, p < 0.01 between specified measurements.
Fig 9
Fig 9. Effects of jspA and lppA on transcriptional responses to pH shift.
Changes in gene expression were determined using GUS fusions to (A) SMb21188, (B) SMc01580, (C) SMb20946 (exoY), and (D) SMc02560 (chvI) at their native loci, generated in such a way as to preserve the function of the gene being examined. GUS activities in wild-type (Rm1021), ΔjspA, and ΔlppA backgrounds were measured 4.5 hours after cultures were shifted from pH 7 to pH 6 (pink bars), 7 (yellow bars), or 8.5 (blue bars) in LB medium. Activity at pH 6 relative to pH 7 for each genotype is shown as the red percentage above each pink bar. Maroon * or ** within a bar for one of the mutants represents significant difference (p < 0.05 or p < 0.01, respectively) when compared to the same condition in wild type. Analogously, black * or ** above the bars indicates significant difference when activity at pH 6 or 8.5 is compared to that at pH 7 for the same genotype, while ns indicates no significant difference. Averages and standard deviations (error bars) were calculated from three to six independent measurements (S5F Table).
Fig 10
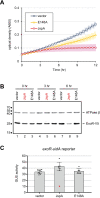
Fig 10. Effects of JspA on ExoR levels.
(A) Plot depicts growth of exoR-V5 strains carrying the pSRKGm vector or derivatives (pJC652 or pJC653) with jspA or jspAE184A (noted as E148A) under control of the Plac promoter. Strains JOE5242, JOE5244, and JOE5246 were grown in 48-well plates, with 0.4 mL PYE plus 1 mM IPTG per well. Absorbance at 600 nm (A600) was measured every 30 minutes. Average readings for three different days are depicted, with surrounding shadings indicating standard deviations. In the absence of IPTG, all strains exhibited growth patterns similar to that of the vector-carrying strain in the presence of IPTG (see S5A Fig). (B) Immunoblot shows steady-state levels of ExoR-V5 and the beta subunit of ATP synthase at 0, 3, and 6 hours after inducing expression of jspA or jspAE184A, compared against levels in the vector-carrying strain. Approximate molecular mass, in kDa, are shown to the left of the blot, while lane numbers are shown below. Growth conditions were similar to that in (A), except that strains were cultured in flasks. (C) Expression of the uidA reporter fusion to exoR from its native locus was assessed in strains carrying the vector (pCM130) or overproducing JspA or JspAE148A (with pJC535 or pJC555). Cultures were grown with 10 mM taurine for 4.5 hours prior to measurement of GUS activities. Averages and standard deviations were calculated from at least four measurements (S5G Table). *, p < 0.05 when compared against the vector-carrying strain.
Fig 11
Fig 11. Steady-state levels of ExoR-FLAG when jspA or lppA differentially expressed.
(A) Levels of ExoR-FLAG in the presence of different versions of JspA were assessed by immunoblotting with anti-FLAG antibodies (bottom blot), while expression of JspA-HA was verified with anti-HA antibodies (top blot). ExoR-FLAG expression is indicated above the blots: + signifies that expression of ExoR-FLAG from pMB859 was induced with 0.5 mM IPTG in TY medium for 4.5 hours, while—signifies that the strain carried the empty vector pSRKKm under the same conditions. Presence (+) or deletion (Δ) of the native jspA in the chromosome is also indicated. Different versions of JspA were induced with 10 mM taurine as follows: wild-type JspA from pJC614 (black +), mutant JspAE148A from pJC615 (black *), wild-type JspA-HA from pJC616 (red #), mutant JspAE148A-HA from pJC617 (red ^), and no expression from the vector pJC473 (-). (B) Immunoblots show steady-state levels of ExoR-FLAG and JspA-HA in the presence or absence of chromosomal lppA. The presence (+) or deletion (Δ) of native jspA or lppA on the chromosome is shown above the blots. Expression of JspA-HA, wild-type (#) or the JspAE148A mutant (^), is indicated above the blots as in (A) (JspA-HA row). All strains in (B) expressed ExoR-FLAG from pMB859, induced with 0.5 mM IPTG. (C) Levels of ExoR-FLAG were assessed in C. crescentus NA1000 when JspA variants and LppA were co-expressed. Expression of ExoR-FLAG, LppA, and JspA is indicated above the blot for each lane, with—denoting no expression, and + denoting expression; *, #, and ^ denote expression of JspAE148A, JspA-HA, and JspAE148A-HA, respectively. ExoR-FLAG was induced from pMB859 with 0.1 mM IPTG in PYE medium for 4 hours, while a strain carrying the empty vector pSRKKm was used for no ExoR-FLAG expression. Expression of LppA and different versions of JspA were induced with 10 mM taurine using the following plasmids: lanes 1 and 2, pJC473 vector; lane 3, pJC614 (JspA); lane 4, pJC615 (JspAE148A); lane 5, pJC702 (LppA and JspA); lane 6, pJC706 (LppA and JspAE148A); lane 7, pJC707 (LppA and JspA-HA); and lane 8, pJC708 (LppA and JspAE148A-HA). Approximate molecular mass, in kDa, are shown to the left of the blots, while lane numbers are shown below. Positions of bands representing JspA-HA and ExoR-FLAG are indicated to the right of the blots: “pre” indicates the precursor form of ExoR-FLAG, “ExoR-FLAG” the mature form, and “deg” a major degradation product. All blots were first probed with anti-FLAG antibodies and then anti-HA antibodies (see Materials and methods). For blots in (A) and (B), the anti-FLAG images were captured first, while the anti-HA images were acquired from the same respective blots after the second probing. For the blot in (C), the image was captured after the second probing.

References

    1. Herridge DF, Peoples MB, Boddey RM. Global inputs of biological nitrogen fixation in agricultural systems. Plant Soil. 2008;311(1–2):1–18. doi: 10.1007/s11104-008-9668-3 - DOI
    1. Ferguson BJ, Indrasumunar A, Hayashi S, Lin MH, Lin YH, Reid DE, et al.. Molecular analysis of legume nodule development and autoregulation. J Integr Plant Biol. 2010;52(1):61–76. doi: 10.1111/j.1744-7909.2010.00899.x . - DOI - PubMed
    1. Masson-Boivin C, Sachs JL. Symbiotic nitrogen fixation by rhizobia-the roots of a success story. Curr Opin Plant Biol. 2018;44:7–15. doi: 10.1016/j.pbi.2017.12.001 . - DOI - PubMed
    1. Long SR. SnapShot: Signaling in Symbiosis. Cell. 2016;167(2):582–e1. doi: 10.1016/j.cell.2016.09.046 . - DOI - PubMed
    1. Ledermann R, Schulte CCM, Poole PS. How Rhizobia Adapt to the Nodule Environment. J Bacteriol. 2021;203(12):e0053920. doi: 10.1128/JB.00539-20 ; PubMed Central PMCID: PMC8315917. - DOI - PMC - PubMed

MeSH terms