. 2023 Oct 23;19(10):e1010997.
doi: 10.1371/journal.pgen.1010997. eCollection 2023 Oct.

Precision pharmacological reversal of strain-specific diet-induced metabolic syndrome in mice informed by epigenetic and transcriptional regulation

Affiliations

Precision pharmacological reversal of strain-specific diet-induced metabolic syndrome in mice informed by epigenetic and transcriptional regulation

Phillip Wulfridge et al. PLoS Genet. .

Abstract

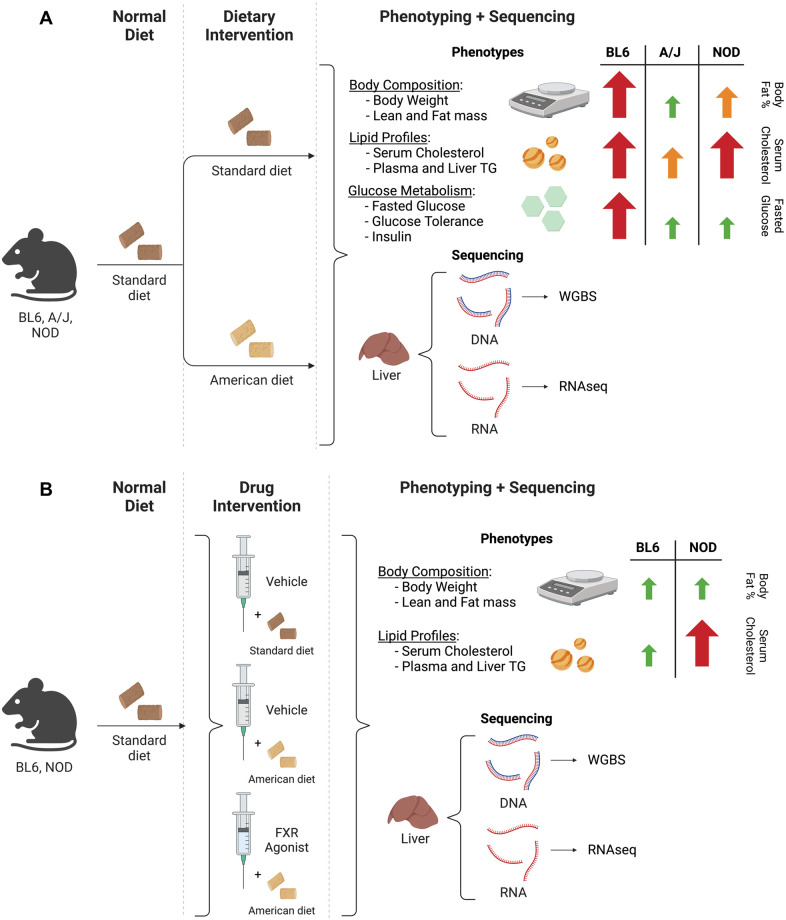
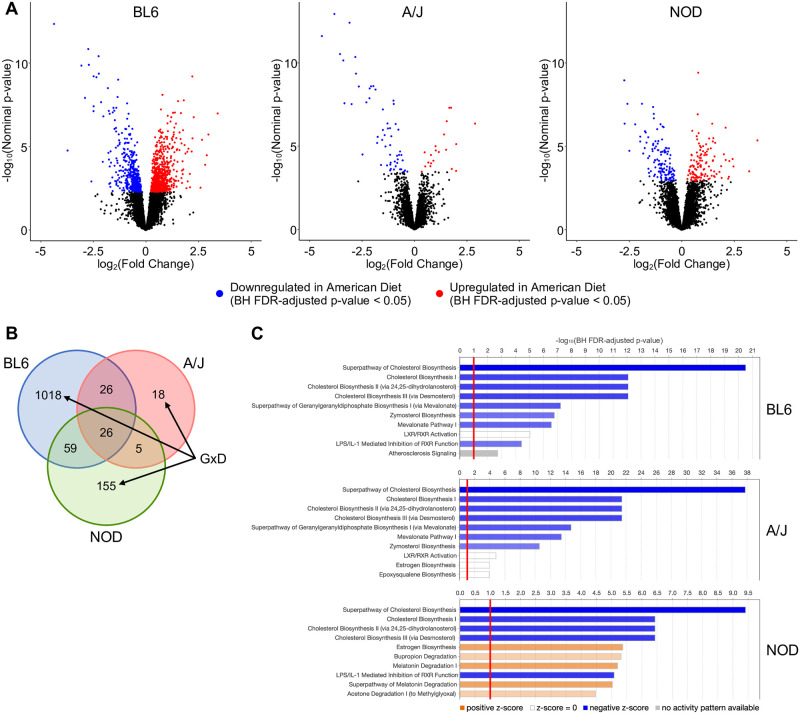
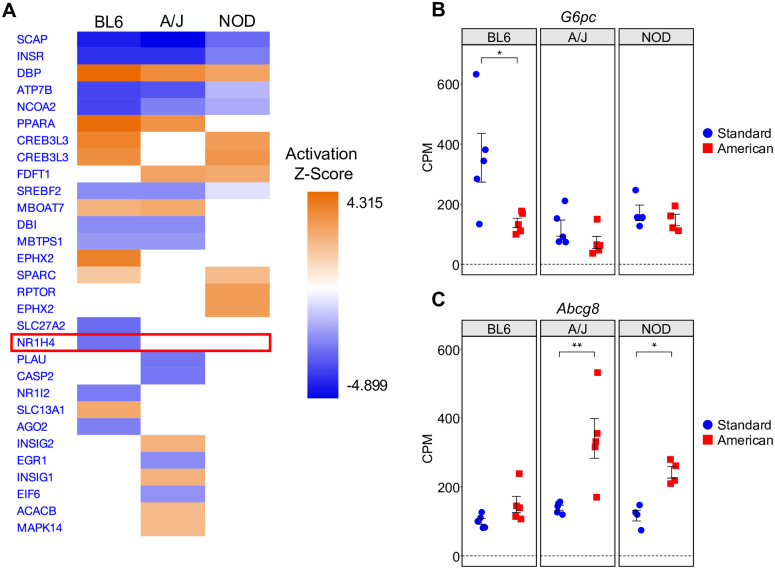
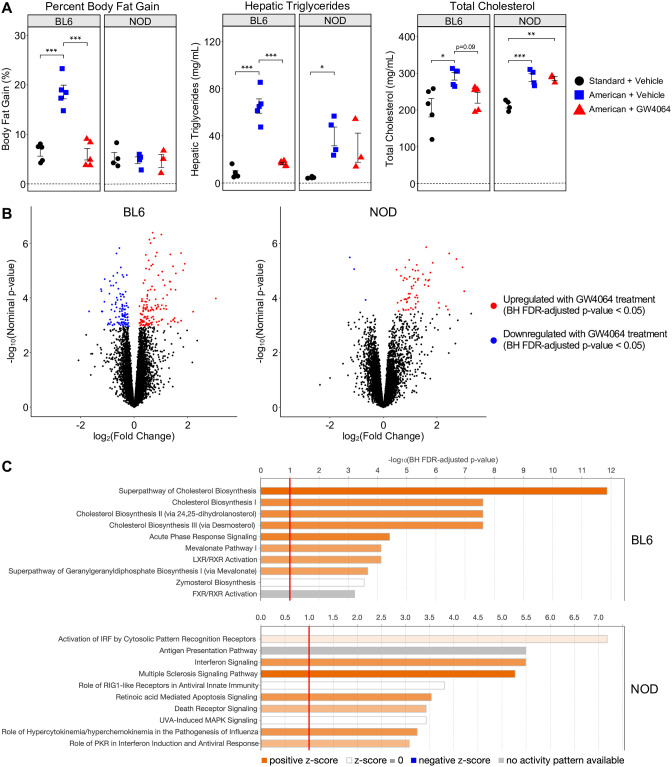
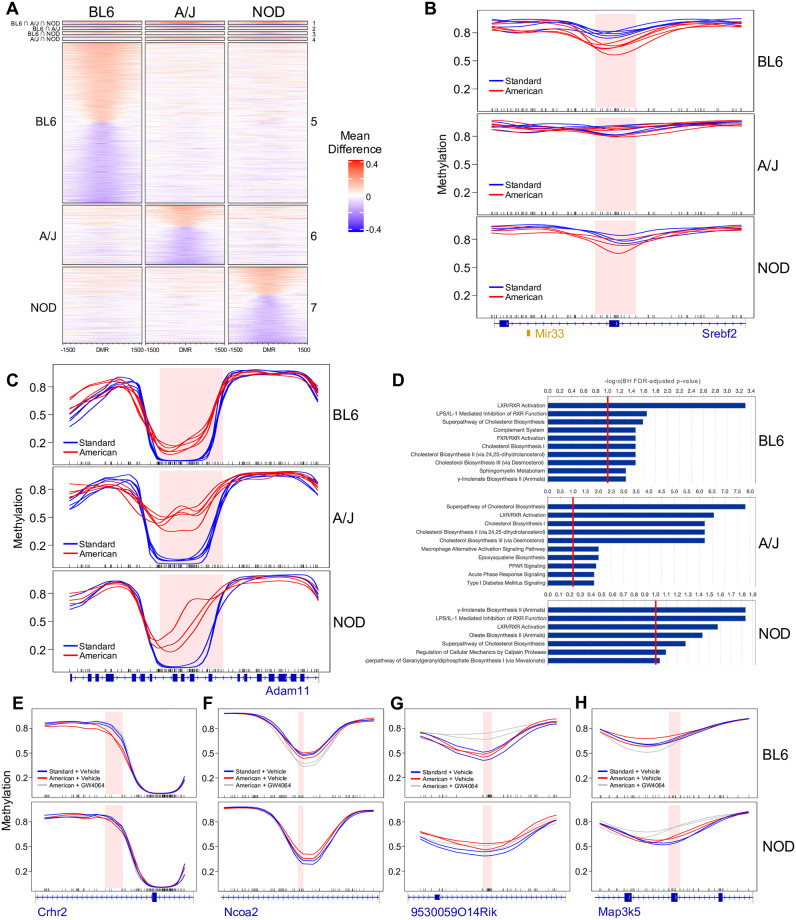
Diet-related metabolic syndrome is the largest contributor to adverse health in the United States. However, the study of gene-environment interactions and their epigenomic and transcriptomic integration is complicated by the lack of environmental and genetic control in humans that is possible in mouse models. Here we exposed three mouse strains, C57BL/6J (BL6), A/J, and NOD/ShiLtJ (NOD), to a high-fat, high-carbohydrate diet, leading to varying degrees of metabolic syndrome. We then performed transcriptomic and genome-wide DNA methylation analyses for each strain and found overlapping but also highly divergent changes in gene expression and methylation upstream of the discordant metabolic phenotypes. Strain-specific pathway analysis of dietary effects revealed a dysregulation of cholesterol biosynthesis common to all three strains but distinct regulatory networks driving this dysregulation. This suggests a strategy for strain-specific targeted pharmacologic intervention of these upstream regulators informed by epigenetic and transcriptional regulation. As a pilot study, we administered the drug GW4064 to target one of these genotype-dependent networks, the farnesoid X receptor pathway, and found that GW4064 exerts strain-specific protection against dietary effects in BL6, as predicted by our transcriptomic analysis. Furthermore, GW4064 treatment induced inflammatory-related gene expression changes in NOD, indicating a strain-specific effect in its associated toxicities as well as its therapeutic efficacy. This pilot study demonstrates the potential efficacy of precision therapeutics for genotype-informed dietary metabolic intervention and a mouse platform for guiding this approach.


Conflict of interest statement

The authors have declared that no competing interests exist.

Figures

Fig 1
Fig 1. Schematic of experimental design.
(A) Genetically divergent mouse strains BL6, A/J, and NOD were exposed to either the American diet or a standard mouse chow. Phenotypic measurements were collected and WGBS and RNA-seq were performed on DNA and RNA extracted from liver. Arrows represent differences from the American diet vs. standard diet comparison, as reported in [7]. (B) BL6 and NOD mouse strains were exposed to an American diet and were treated with the FXR agonist GW4064 or control vehicle. Phenotypic measurements were collected and WGBS and RNA-seq were performed on DNA and RNA extracted from liver. Arrows represent differences from the American diet + GW4064 vs. standard diet + vehicle comparison. Graphics were created with BioRender.com.
Fig 2
Fig 2. Gene-by-diet interactions of hepatic gene expression in BL6, A/J, and NOD mice.
(A) Volcano plots of liver gene expression indicating significantly upregulated (red) and downregulated (blue) genes from the American vs. standard diet comparison of BL6, A/J, and NOD, as determined by the BH FDR-adjusted p-value. (B) Venn diagram of overlap between strains of differentially expressed genes (DEGs) upon American diet exposure. Marked categories are strain-specific, highlighting potential gene-by-diet interactions. (C) IPA results showing enriched pathways among diet DEGs (American vs. standard diet) for each strain; the top 10 most significantly enriched pathways with BH FDR-adjusted p-values < 0.1 are shown.
Fig 3
Fig 3. Regulatory network analysis identifies ubiquitous and strain-specific transcriptional regulators of diet response.
(A) Output of IPA regulatory network analysis identifying both common and strain-specific master upstream transcriptional regulators predicted based on diet DEGs (American vs. standard diet) in BL6, A/J, and NOD. The top 30 master upstream regulators ranked by z-score are shown. FXR (Nr1h4) is highlighted. (B) Plot of G6pc gene expression in BL6, A/J, and NOD mice on the standard and American diets. (C) Plot of Abcg8 gene expression in BL6, A/J, and NOD mice on the standard and American diets. The y-axes represent counts per million (CPM) of each gene. Error bars represent SE. * p < 0.05, ** p < 0.01, *** p < 0.001 from RNA-seq BH FDR-adjusted p-values.
Fig 4
Fig 4. FXR agonist GW4064 elicits strain-specific responses in BL6 and NOD mice on the American diet.
(A) Phenotypic measurements of BL6 and NOD mice under three conditions tested (standard diet + vehicle, American diet + vehicle, American diet + GW4064). Phenotypes shown are percent body fat gain (left), hepatic triglyceride levels (middle), and total cholesterol (right). Error bars represent SE. * p < 0.05, ** p < 0.01, *** p < 0.001 from ANOVA between means within strains, with post-hoc Tukey HSD test. (B) Volcano plots of liver gene expression indicating significantly upregulated (red) and downregulated (blue) genes from the American diet + GW4064 vs. American diet + vehicle comparison of BL6 and NOD, as determined by the BH FDR-adjusted p-value. (C) IPA results showing enriched pathways among drug DEGs (American diet + GW4064 vs. American diet + vehicle) for each strain; the top 10 most significantly enriched pathways with BH FDR-adjusted p-values < 0.1 are shown.
Fig 5
Fig 5. Gene-by-diet interactions in hepatic DNA methylation of BL6, A/J, and NOD mice.
(A) Heatmap of mean methylation differences between diets across a 3-kb window centered around the 1,316 diet DMRs, with each row corresponding to a single DMR. The x-axis represents the genomic distance of each locus relative to the center of the DMR and the color gradient represents the mean methylation difference between the American vs. standard diet at each locus. DMRs are further grouped by strain specificity, with group numbers shown to the right of the heatmap. DMRs in group 1 are nominally significant and have a dietary mean difference > 10% in all three strains; groups 2 through 7 denote DMRs which are nominally significant and have a mean difference > 10% in only one or two strains. (B) Example of a strain-specific diet DMR, showing the BL6-specific hypomethylation of Srebf2 and Mir33 upon exposure to the American diet. (C) Example of a strain-agnostic diet DMR, showing the ubiquitous hypermethylation of Adam11 upon exposure to the American diet. (D) IPA results showing enriched pathways among diet DMR-associated genes (American vs. standard diet) for each strain; the top 10 most enriched pathways with BH FDR-adjusted p-values < 0.1 are shown. (E-H) Examples of four distinct categories of diet- and drug-associated DMRs overlapping phenotypically relevant genes functionally implicated in various metabolic (E-G) or inflammatory (H) pathways.

Update of

Similar articles

References

    1. Ladd-Acosta C, Fallin MD. The role of epigenetics in genetic and environmental epidemiology. Epigenomics. 2016;8(2):271–83. doi: 10.2217/epi.15.102 - DOI - PubMed
    1. Latham KE, Sapienza C, Engel N. The epigenetic lorax: gene-environment interactions in human health. Epigenomics. 2012;4(4):383–402. doi: 10.2217/epi.12.31 - DOI - PMC - PubMed
    1. Liu L, Li Y, Tollefsbol TO. Gene-environment interactions and epigenetic basis of human diseases. Curr Issues Mol Biol. 2008;10(1–2):25–36. - PMC - PubMed
    1. Ottman R. Gene-environment interaction: definitions and study designs. Prev Med. 1996;25(6):764–70. doi: 10.1006/pmed.1996.0117 - DOI - PMC - PubMed
    1. Wang T, Xu M, Bi Y, Ning G. Interplay between diet and genetic susceptibility in obesity and related traits. Front Med. 2018;12(6):601–7. doi: 10.1007/s11684-018-0648-6 - DOI - PubMed