. 2023 Oct 31;120(44):e2308511120.
doi: 10.1073/pnas.2308511120. Epub 2023 Oct 23.

The total mass, number, and distribution of immune cells in the human body

Affiliations

The total mass, number, and distribution of immune cells in the human body

Ron Sender et al. Proc Natl Acad Sci U S A. .

Abstract

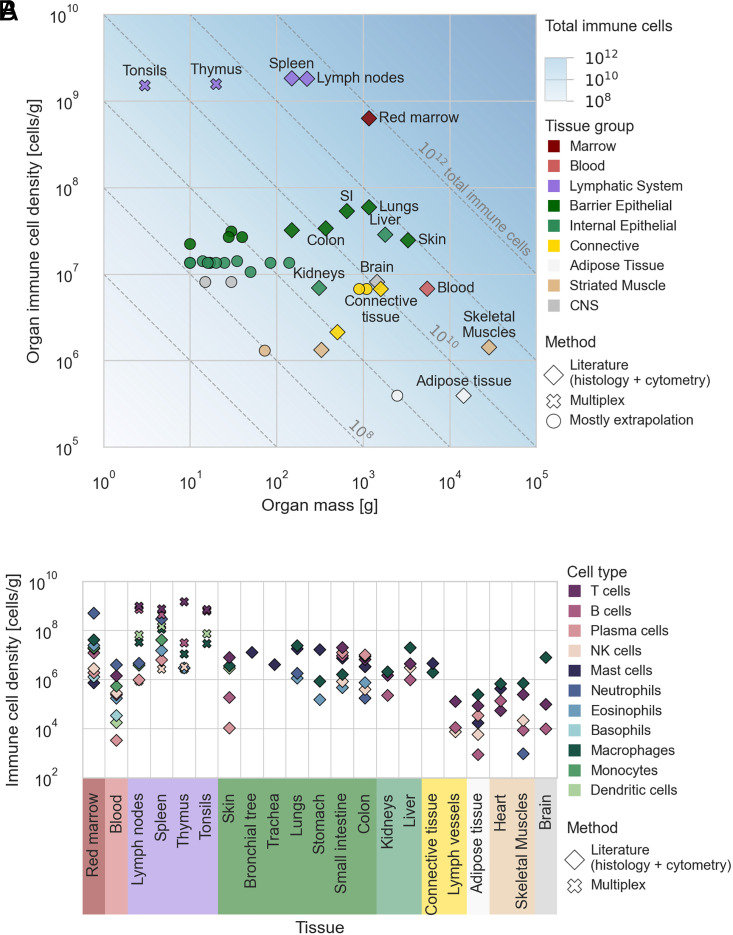
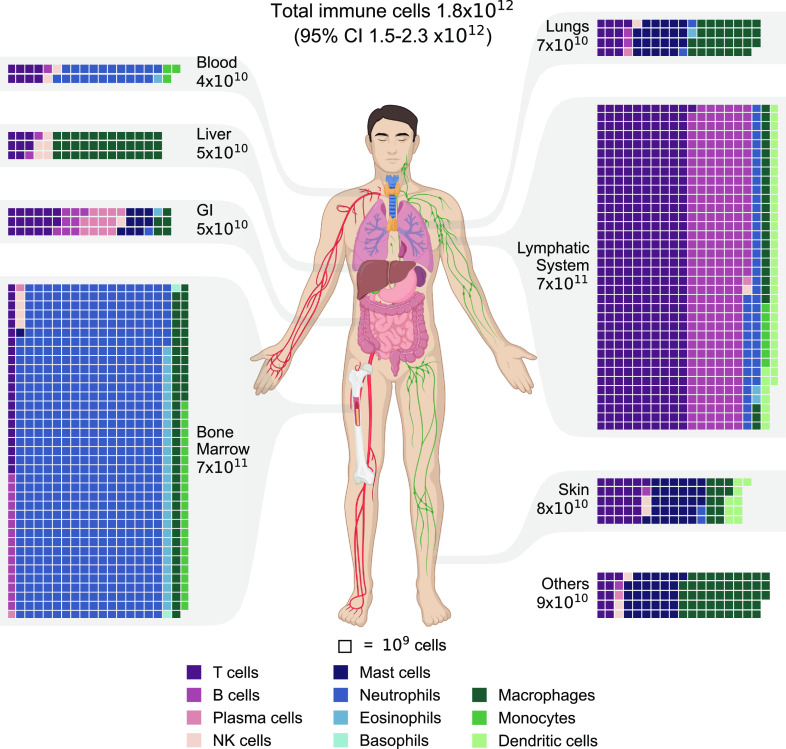
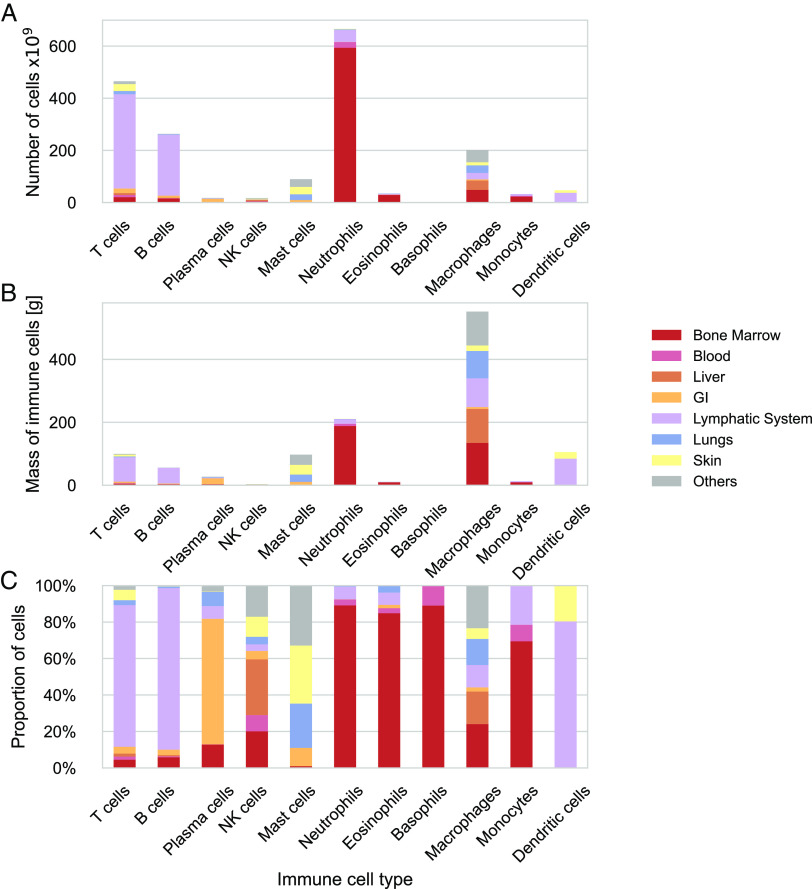
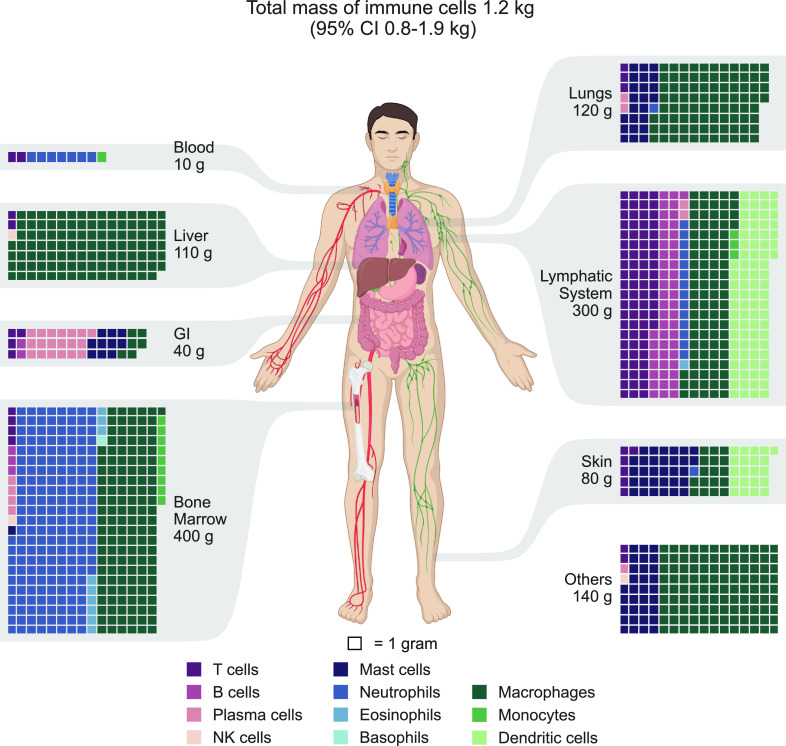
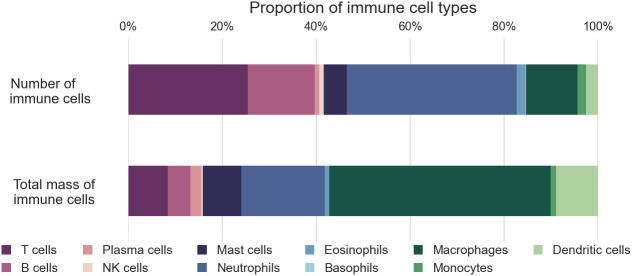
The immune system is a complex network of cells with critical functions in health and disease. However, a comprehensive census of the cells comprising the immune system is lacking. Here, we estimated the abundance of the primary immune cell types throughout all tissues in the human body. We conducted a literature survey and integrated data from multiplexed imaging and methylome-based deconvolution. We also considered cellular mass to determine the distribution of immune cells in terms of both number and total mass. Our results indicate that the immune system of a reference 73 kg man consists of 1.8 × 10¹² cells (95% CI 1.5-2.3 × 10¹²), weighing 1.2 kg (95% CI 0.8-1.9). Lymphocytes constitute 40% of the total number of immune cells and 15% of the mass and are mainly located in the lymph nodes and spleen. Neutrophils account for similar proportions of both the number and total mass of immune cells, with most neutrophils residing in the bone marrow. Macrophages, present in most tissues, account for 10% of immune cells but contribute nearly 50% of the total cellular mass due to their large size. The quantification of immune cells within the human body presented here can serve to understand the immune function better and facilitate quantitative modeling of this vital system.

Keywords: distribution; immune cells; lymphocyte; macrophage; total mass.


Conflict of interest statement

The authors declare no competing interest.

Figures

Fig. 1.
Fig. 1.
The number of immune cells throughout the body. Cellular densities of immune cell types were estimated based on the literature and multiplexed imaging data. (A) The total immune cell density of tissues versus their total mass. Both axes are plotted on a log scale. The diagonals represent the total number of immune cells in the organs. The shape of the markers represents the primary method of the density estimate. Large organs and organs with a high immune cell population are annotated. Tissues without annotation include yellow marrow, cartilage, pancreas, bronchial tree, adrenal, gallbladder, and more (see Dataset S2 for a complete list of the organs and their densities). SI = small intestine. (B) Specific immune cell type densities of the various organs and tissues. Only literature and multiplex-based estimates (not extrapolations) are shown. The y axis is given in a log scale. The tissues and organs are grouped in both panels by similar structure and function.
Fig. 2.
Fig. 2.
The distribution of immune cells in the human body. Estimates of immune cell populations by cell type and tissue grouped by primary tissues and systems. The tissues are displayed via a chart of the human body. A waffle chart depicts the distribution of immune cells in each tissue, with each square representing a population of 109 cells. To facilitate the presentation, the populations were rounded to multiples of 109. The total population of each tissue is shown with one significant digit. Throughout all the figures, cell types are color-coded for ease of reference. GI = gastrointestinal tract. Other tissues and organs include the brain, heart, adipose tissue, skeletal muscles, kidneys, etc.
Fig. 3.
Fig. 3.
Cell type–specific tissue distribution of immune cells in the human body. Estimates of immune cell populations by cell type and tissue grouped by primary tissues and systems. For each cell type, the distribution across the systems is depicted in the absolute number of cells (A), absolute mass of cells (B), and relative number of cells (C).
Fig. 4.
Fig. 4.
The distribution of immune cell mass in the human body. Estimates of immune cell mass were integrated based on the cellular mass and population. The estimates were grouped by cell type by primary tissues and systems. The tissues are displayed via a chart of the human body, while a waffle chart is used to depict the distribution of immune cell mass in each tissue, with each square representing 1 g of immune cells. To facilitate the presentation, the populations were rounded to multiples of 1 g. The total immune cell mass of each tissue is shown with one significant digit. Throughout all the figures, cell types are color-coded for ease of reference. GI = gastrointestinal tract. Other tissues and organs include the brain, heart, adipose tissue, skeletal muscles, kidneys, etc.
Fig. 5.
Fig. 5.
The proportion of immune cell types in the body by number and mass.

References

    1. Trepel F., Number and distribution of lymphocytes in man. A critical analysis. Klin. Wochenschr. 52, 511–515 (1974). - PubMed
    1. Tabula Sapiens Consortium* et al., The Tabula Sapiens: A multiple-organ, single-cell transcriptomic atlas of humans. Science 376, eabl4896 (2022). - PMC - PubMed
    1. Bianconi E., et al. , An estimation of the number of cells in the human body. Ann. Hum. Biol. 40, 463–471 (2013). - PubMed
    1. Sender R., Milo R., The distribution of cellular turnover in the human body. Nat. Med. 27, 45–48 (2021). - PubMed
    1. Wittkopf N., Neurath M. F., Becker C., Immune-epithelial crosstalk at the intestinal surface. J. Gastroenterol. 49, 375–387 (2014). - PubMed

Publication types

LinkOut - more resources