. 2023 Oct 31;120(44):e2310708120.
doi: 10.1073/pnas.2310708120. Epub 2023 Oct 23.

Efficient Bayesian inference under the multispecies coalescent with migration

Affiliations

Efficient Bayesian inference under the multispecies coalescent with migration

Tomáš Flouri et al. Proc Natl Acad Sci U S A. .

Abstract

Analyses of genome sequence data have revealed pervasive interspecific gene flow and enriched our understanding of the role of gene flow in speciation and adaptation. Inference of gene flow using genomic data requires powerful statistical methods. Yet current likelihood-based methods involve heavy computation and are feasible for small datasets only. Here, we implement the multispecies-coalescent-with-migration model in the Bayesian program bpp, which can be used to test for gene flow and estimate migration rates, as well as species divergence times and population sizes. We develop Markov chain Monte Carlo algorithms for efficient sampling from the posterior, enabling the analysis of genome-scale datasets with thousands of loci. Implementation of both introgression and migration models in the same program allows us to test whether gene flow occurred continuously over time or in pulses. Analyses of genomic data from Anopheles mosquitoes demonstrate rich information in typical genomic datasets about the mode and rate of gene flow.

Keywords: BPP; gene flow; genomics; migration; multispecies coalescent.


Conflict of interest statement

The authors declare no competing interest.

Figures

Fig. 1.
Fig. 1.
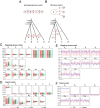
(A) A species tree for three species (A,B,C) with migration between species B and C showing model parameters, Θ = (τR, τS, θA, θB, θC, θR, θS, MBC, MCB). There are three sets of parameters in the model: species divergence times (τRτABC, τSτAB), population sizes (θA, θB, θC, θR, θS), and migration rates (MBC,MCB). Both τ and θ are measured in the expected number of mutations per site. The (population) migration rate is defined as Mij=Njmij, the expected number of migrants from species i to j per generation, where Nj is the (effective) population size of species j and mij is the proportion of immigrants in population j from population i. (B) A possible gene tree with the complete history of coalescent and migration events at a locus with two sequences from each of the three species (a1,a2 from A; b1,b2 from B; and c1,c2 from C). In the backward-in-time process of coalescent and migration, the five coalescent events occur at times t1t5, while sequence b2 experienced two migration events from B to C at time s1 and back from C to B at time s2, with t1<t2<s1<s2<t3<t4<t5.
Fig. 2.
Fig. 2.
A balanced tree for four species with migration from SC at the rate MSC. The migration rate parameter MSC exists when (A) τS<τT but disappears when (B) τSτT.
Fig. 3.
Fig. 3.
(A) The saturated migration model for three species with eight migration rates, used to simulate data for analysis by bpp. The parameters used are τR=0.02, τS=0.01, θA=θS=0.015, and θB=θC=θR=0.025. The eight migration rates are MAB=0.12, MBA=0.21, MAC=0.13, MCA=0.31, MBC=0.23, MCB=0.32, MCS=0.2, and MSC=0.1. (B) Posterior means and 95% HPD CIs of parameters in 10 replicate datasets of different sizes, with L=250, 1,000, 4,000 loci. Horizontal lines represent the true parameter values. A large dataset of L= 16,000 loci is analyzed in SI Appendix, Table S1.
Fig. 4.
Fig. 4.
(AC) Three MSC-M models for three species with (A) AB migration (between sister species), (B) BC migration (between nonsister species), and (C) CS migration (between sister species and involving one ancestor) used for simulating data, for analysis using bpp and IMA3. The parameters used are τR=0.02, τS=0.01, θA=θS=0.015, θB=θC=θR=0.025, with migration rates M = 0.1 in one direction and 0.2 in the opposite direction. (DF) Posterior means and 95% CIs for the nine parameters in the model obtained using bpp (blue) and IMA3 (red) in 10 replicate datasets. Black horizontal lines represent true values. IMA3 uses mutation rate per locus, not per site; estimates from IMA3 are thus divided by the sequence length. IMA3 outputs the population migration rate 2M; the estimates are divided by 2.
Fig. 5.
Fig. 5.
(A) Stepping-stone and (B) island models used for simulating data, for analysis by using bpp and migrate. The population genetic models (Top) are approximated by the MSC-M models with very large divergence times (Bottom). All population sizes are θ0=0.002 except that θA=10θ0 in the island model. The migration rate was M=0.15 migrants per generation. (C and D) Posterior means and 95% HPD CIs of parameters in bpp analyses of 10 replicate datasets (each of L=250, 1,000, or 4,000 loci) simulated under the models. The horizontal lines represent the true values. (E and F) The datasets of 250 loci are also analyzed using migrate (red), in comparison with bpp (blue). migrate uses the mutation-scaled migration rate, ϖij=4Mij/θj in the notation here; this is transformed to M^ij=ϖ^ijθ^j/4 by using the posterior mean θ^j.
Fig. 6.
Fig. 6.
(A) MSC-M and (B) MSC-I models for six species of African mosquitoes in the A. gambiae species complex: A. gambiae (G), A. coluzzii (C), A. arabiensis (A), A. melas (L), A. merus (R), and A. quadriannulatus (Q).
Fig. 7.
Fig. 7.
The logarithm of the Bayes factor for testing gene flow obtained from bpp analysis of the 100-loci blocks of the (A) coding and (B) noncoding data from the Anopheles mosquitoes (Fig. 6A), calculated using thermodynamic integration with Gaussian quadrature (42). Gene flow is accounted for using either the introgression model (i for MSC-I) or the migration model (m for MSC-M). Model H0 is the MSC model with no gene flow. Model H1 assumes the AGC gene flow, with rate MAGC under MSC-M or φAGC under MSC-I. Model H2 accommodates both gene-flow events, with rates MAGC and MRQ under MSC-M or φAGC and φRQ under MSC-I. Bayes factor B20 measures the support for H2 over H0, while B21 measures the support for H2 over H1. The test is significant when |logB|>4.6 (i.e., if B>100 or B<0.01). For example, logB21(m) <4.6 means that the data strongly support the one-rate model with the AGC migration (with rate MAGC) over the two-rates model with both the AGC and the RQ migrations. Different scales are used for the y-axis over the intervals (50,10),(10,10),(10,50),(50,700).

Similar articles

Cited by

References

    1. Arnold B. J., et al. , Borrowed alleles and convergence in serpentine adaptation. Proc. Natl. Acad. Sci. U.S.A. 113, 8320–8325 (2016). - PMC - PubMed
    1. Fontaine M. C., et al. , Extensive introgression in a malaria vector species complex revealed by phylogenomics. Science 347, 1258524 (2015). - PMC - PubMed
    1. Figueiro H. V., et al. , Genome-wide signatures of complex introgression and adaptive evolution in the big cats. Sci. Adv. 3, e1700299 (2017). - PMC - PubMed
    1. Malinsky M., et al. , Whole-genome sequences of Malawi cichlids reveal multiple radiations interconnected by gene flow. Nat. Ecol. Evol. 2, 1940–1955 (2018). - PMC - PubMed
    1. Nielsen R., et al. , Tracing the peopling of the world through genomics. Nature 541, 302 (2017). - PMC - PubMed