. 2023 Oct 31;120(44):e2305375120.
doi: 10.1073/pnas.2305375120. Epub 2023 Oct 23.

A mechanism-based theory of cellular and tissue plasticity

Affiliations

A mechanism-based theory of cellular and tissue plasticity

Fuqiang Sun et al. Proc Natl Acad Sci U S A. .

Abstract

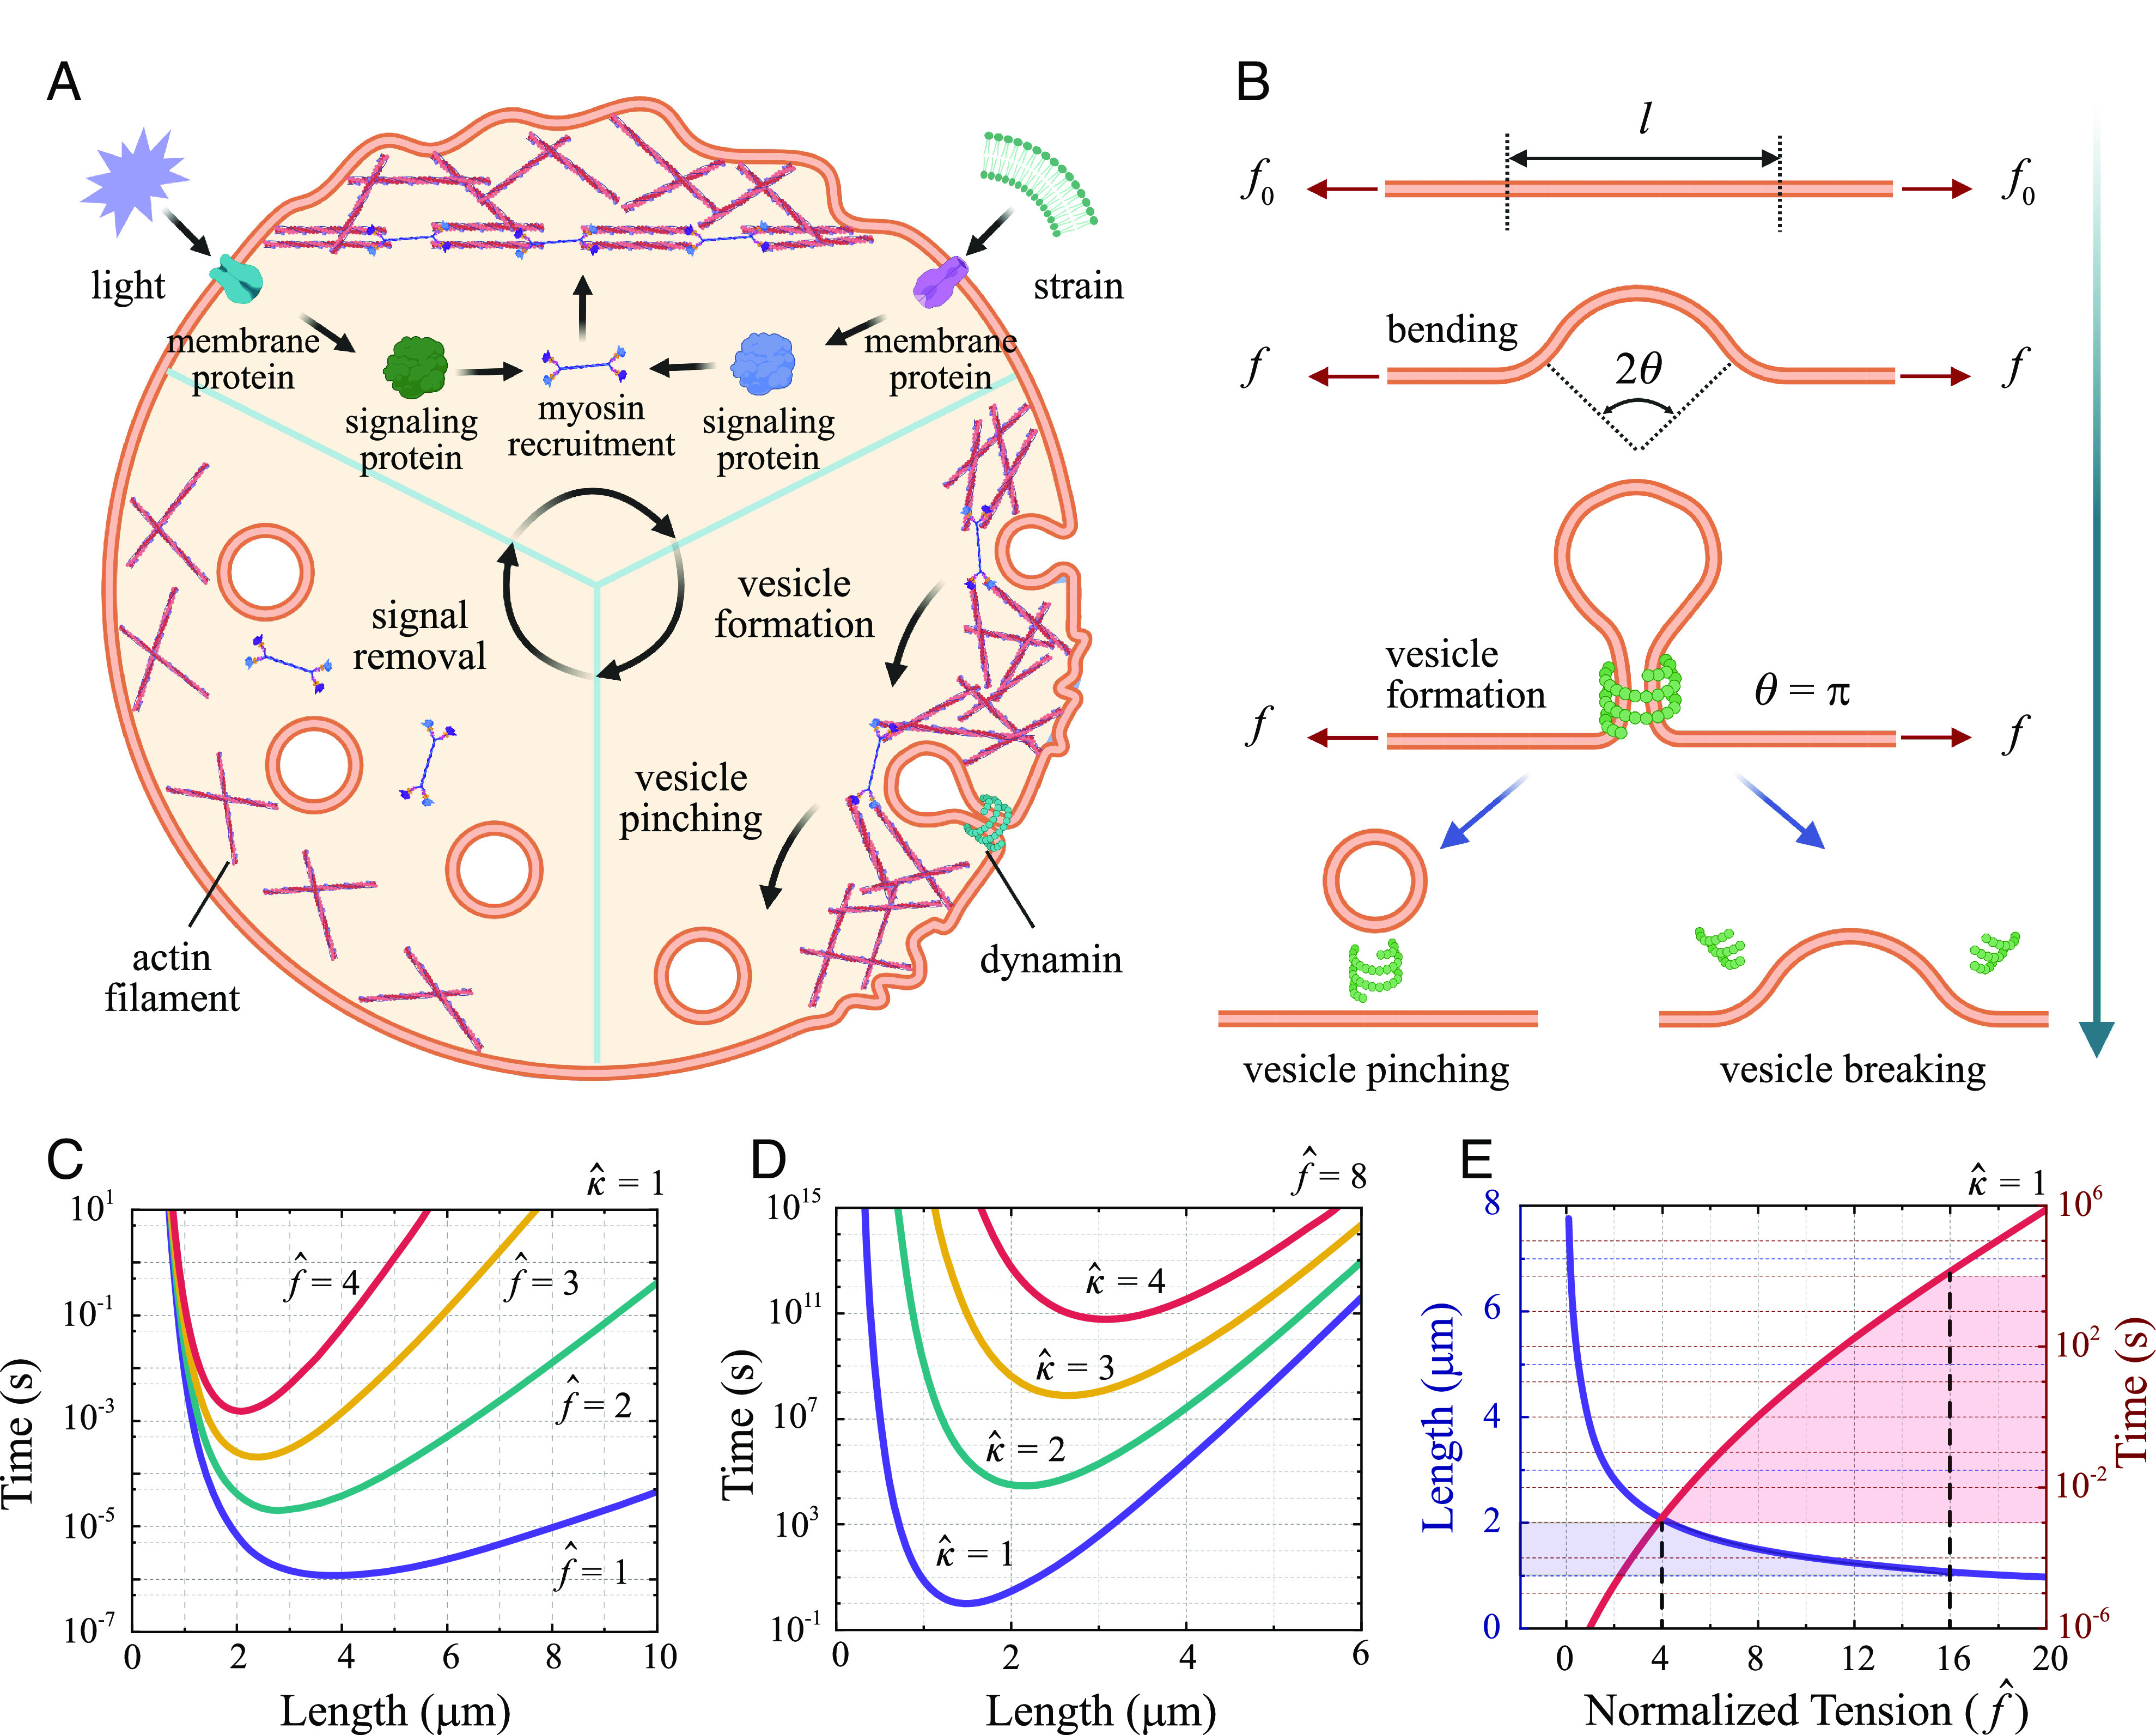
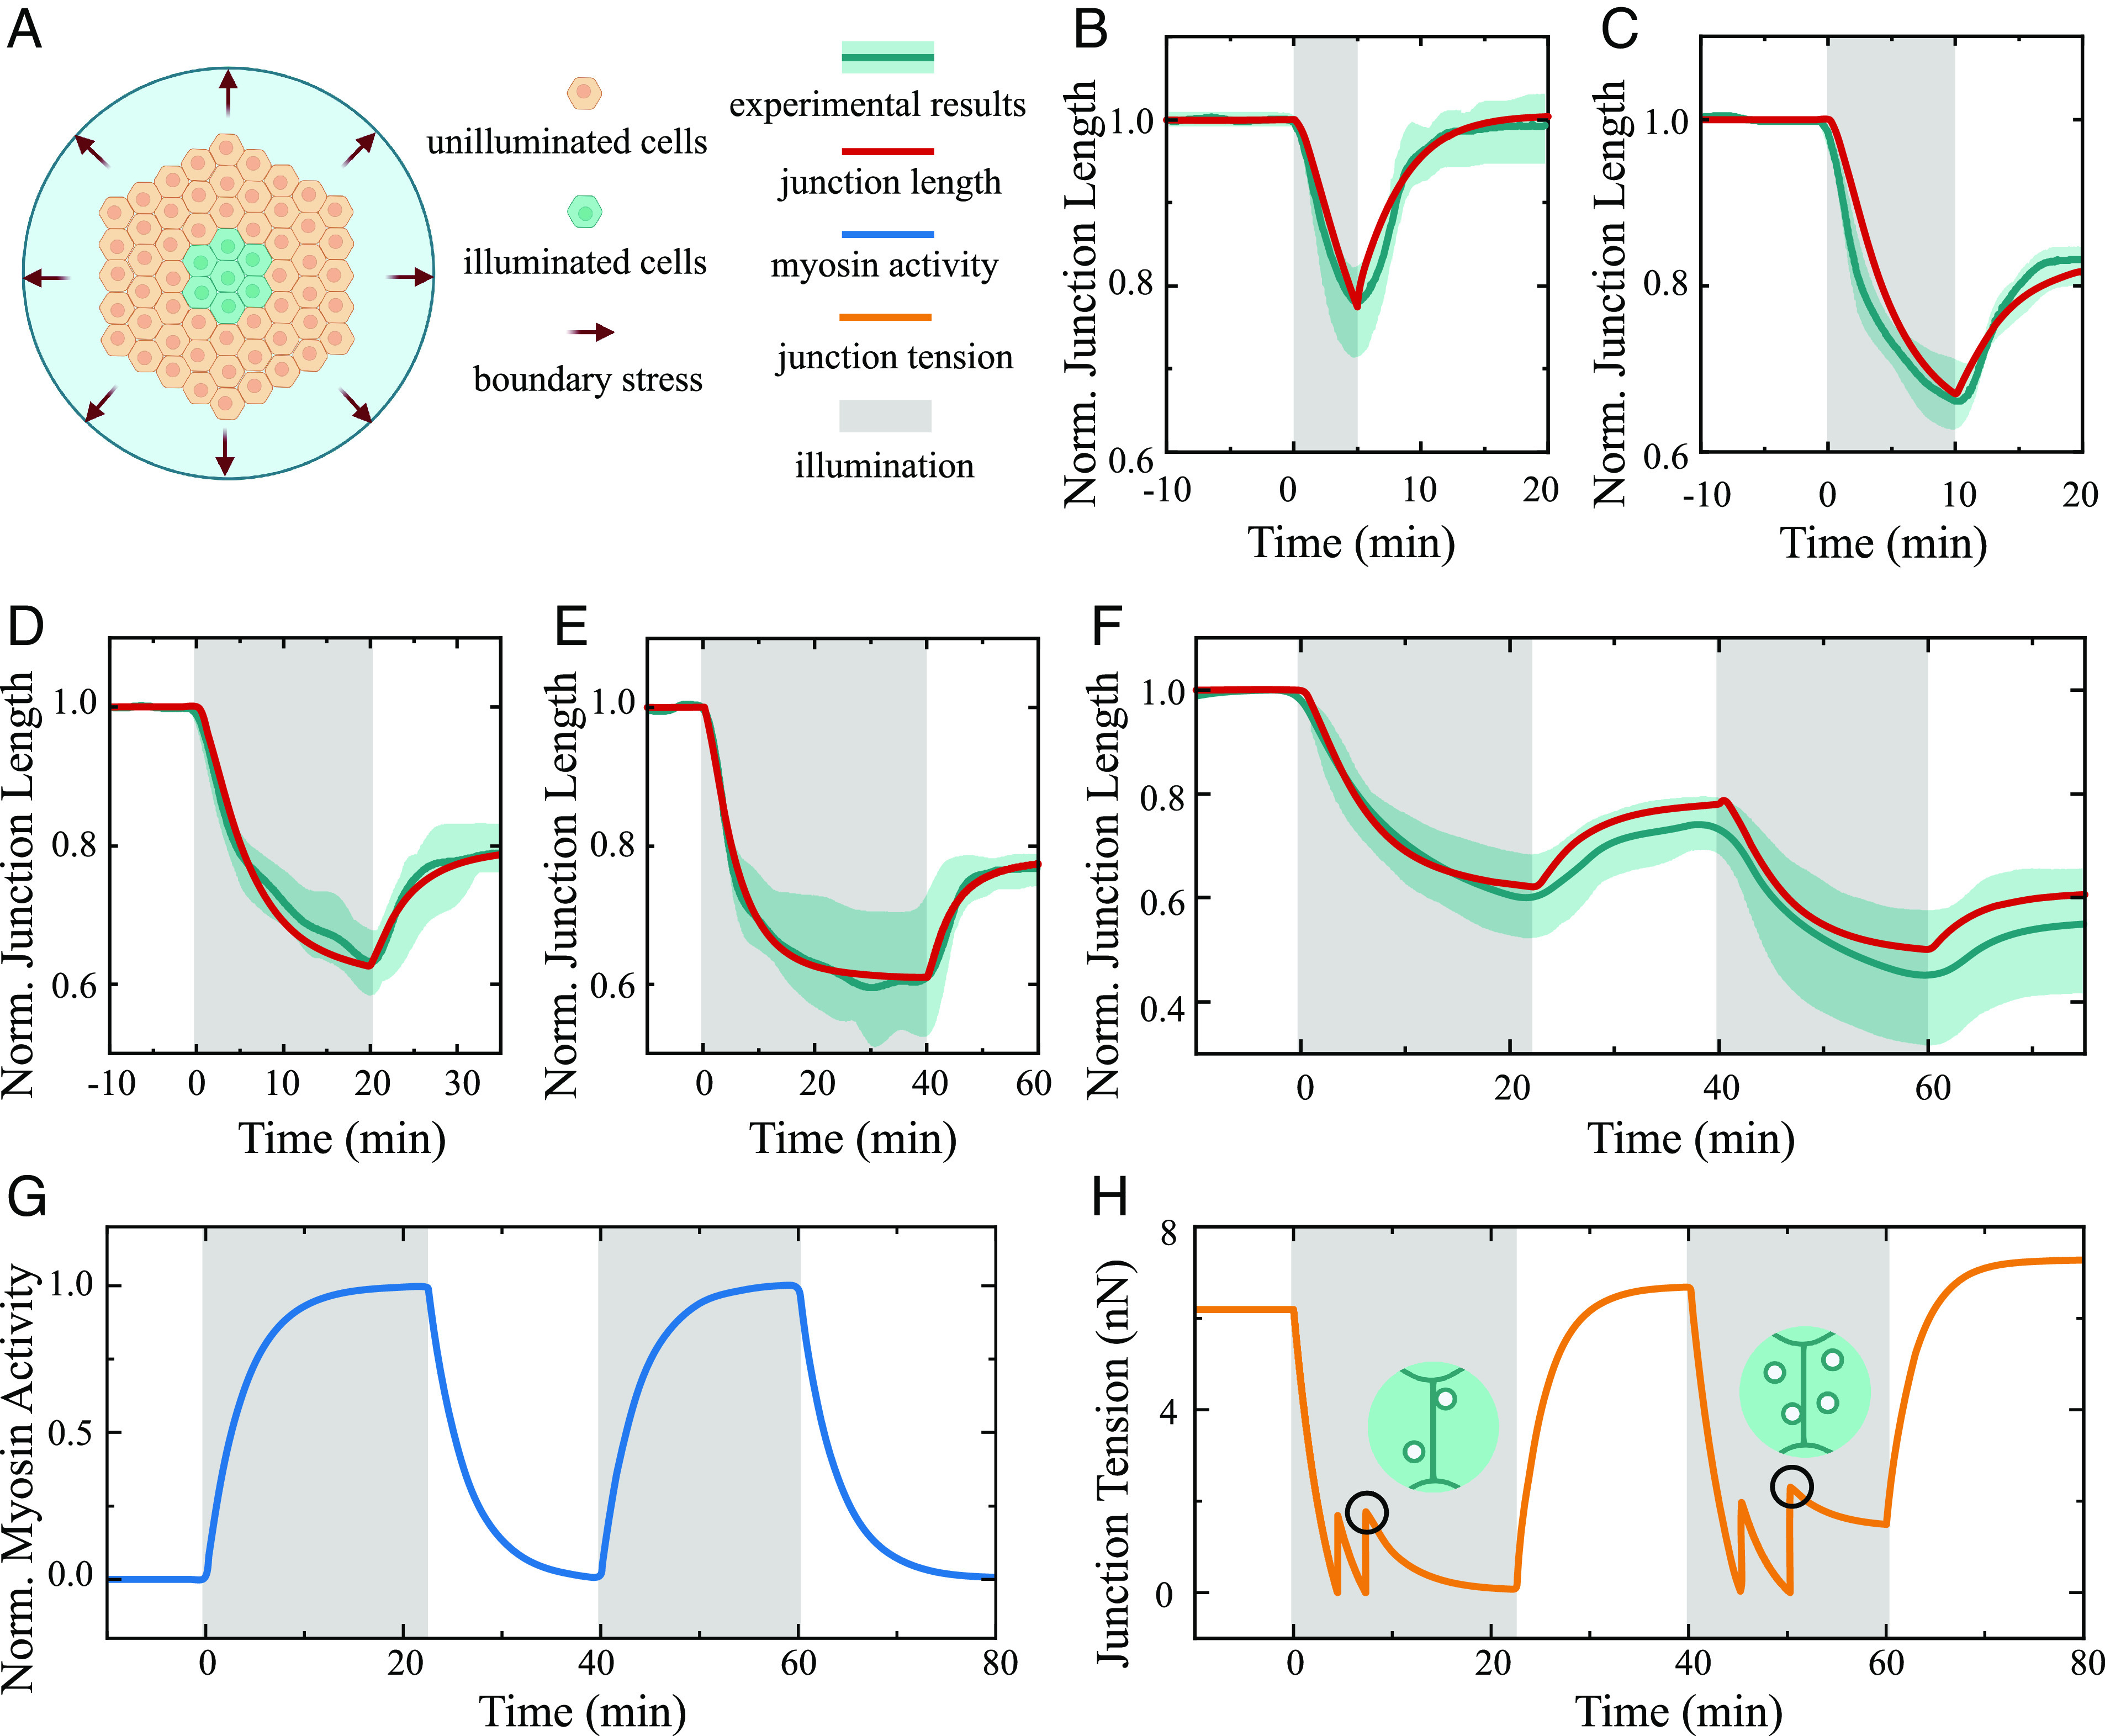
Plastic deformation in cells and tissues has been found to play crucial roles in collective cell migration, cancer metastasis, and morphogenesis. However, the fundamental question of how plasticity is initiated in individual cells and then propagates within the tissue remains elusive. Here, we develop a mechanism-based theory of cellular and tissue plasticity that accounts for all key processes involved, including the activation and development of active contraction at different scales as well as the formation of endocytic vesicles on cell junctions and show that this theory achieves quantitative agreement with all existing experiments. Specifically, it reveals that, in response to optical or mechanical stimuli, the myosin contraction and thermal fluctuation-assisted formation and pinching of endocytic vesicles could lead to permanent shortening of cell junctions and that such plastic constriction can stretch neighboring cells and trigger their active contraction through mechanochemical feedbacks and eventually their plastic deformations as well. Our theory predicts that endocytic vesicles with a size around 1 to 2 µm will most likely be formed and a higher irreversible shortening of cell junctions could be achieved if a long stimulation is split into multiple short ones, all in quantitative agreement with experiments. Our analysis also shows that constriction of cells in tissue can undergo elastic/unratcheted to plastic/ratcheted transition as the magnitude and duration of active contraction increases, ultimately resulting in the propagation of plastic deformation waves within the monolayer with a constant speed which again is consistent with experimental observations.

Keywords: active contraction; cell plasticity; endocytosis; morphogenesis; tissue wave.


Conflict of interest statement

The authors declare no competing interest.

Figures

Fig. 1.
Fig. 1.
Cellular plasticity across different scales. (A) Schematics showing that 1) the collective plastic response of cells leads to tissue plasticity at macroscopic scales; 2) formation and scission of membrane vesicles result in irreversible deformation of individual cells; 3) various proteins participate in the initiation and pinching of endocytic vesicles at the subcellular scale. (B) Illustration of the multiscale model where cells are treated as tightly packed hexagons at the tissue level; cell–cell junctions are modeled as springs connecting corresponding vertices at the cellular level; and the activation of signaling molecules (triggered by optical/mechanical stimuli), as well as recruitment of myosin motors to the cell junction, are considered at the subcellular scale. (C) Summary of key processes involved in the development of cellular and tissue plasticity.
Fig. 2.
Fig. 2.
Modeling the contraction and thermal fluctuation–assisted formation of endocytic vesicles. (A) Generation of endocytic vesicles in cells involves 3 stages (clockwise from top): 1) junction contraction, 2) vesicle formation and scission, and 3) signal removal. Essentially, signaling proteins are activated by mechanical or optical signals to promote the recruitment of actomyosin to the cell junction. The lowered junction tension (caused by actomyosin contraction) then promotes the formation and scission of vesicles. After the removal of signals, the cell junction gradually relaxed to the shortened state, resulting in plastic deformation. (B) The formation of a vesicle can be treated as the bulging of a membrane segment into a circular arch. After circularization, the vesicle will be either pinched away from the junction or broken apart. (C and D) Predicted formation time of vesicle as a function of its size under different tension (C) and bending rigidity (D) levels. (E) Minimal formation time (pink) and corresponding vesicle size (purple) as functions of junction tension under a fixed normalized bending rigidity of κ^=1. Shaded regions indicate the predicted tension and formation time ranges for vesicles with sizes between 1 and 2 μm.
Fig. 3.
Fig. 3.
Comparison between predicted plastic shortening of junctions under optical stimulation and experimental data obtained from Cavanaugh et al. (15). (A) Schematic illustrating the activated region and boundary conditions adopted in the simulations. Contraction in seven center cells of the monolayer is assumed to be triggered by light at t=0. On the other hand, an initial tension f0 is imposed on the junction through stretching of the monolayer at its boundary. (BF) Simulated length evolution of junctions under a single 5-min (B), 10-min (C), 20-min (D), 40-min (E), or two consecutive (F) optical stimuli. For comparison purposes, the measured junctional length changes obtained under the same stimuli conditions by Cavanaugh et al. (15) are also shown (experimental results). (G) Simulated activity of signaling proteins during two consecutive stimuli. Note that the activity here is normalized by its maximum value. (H) Simulated junctional tension change during the two consecutive stimuli. Pinching off a vesicle will cause a step increase in the junction tension, making subsequent vesicle formation more difficult. Insets illustrate the number of vesicles formed on a junction at different time points (indicated by the black circles) in our simulation. The values of all parameters used are listed in Table 1.
Fig. 4.
Fig. 4.
Phase transition during the initiation and propagation of cell plasticity. (AC) Heatmaps of central cell plasticity (A), adjacent cell contraction (B), and adjacent cell plasticity (C) as functions of contraction amplitude and developmental time (normalized by signal reaction time), respectively. (D) Schematics illustrating the phase transition of the central cell and its neighbors. The transition from competitive mode to cooperative mode can eventually lead to the propagation of plasticity from central to adjacent cells. The same colors as those in (E) and (F) are used here to represent different states of neighboring cells (uncontracted, unratcheted, ratcheted). (E) Depending on the amplitude and duration of the central cell contraction, the deformation of neighboring cells can undergo uncontracted–unratcheted–ratcheted transition. The dashed green line indicates the state of the cell (as a function of time) under a contraction amplitude of γ=0.63, from which the probabilities shown in (F), also marked by the dashed green line, can be estimated. (F) Probabilities of the neighboring cell to be in the uncontracted, unratcheted and ratcheted states, as functions of the normalized contraction amplitude (γ-0.55)/(0.95-0.55) with 0.55 and 0.95 being the minimal γ for triggering adjacent cell plasticity and the maximum contraction considered in (E), respectively. Here, the time for a contraction to develop in the center cells is assumed to distribute uniformly in the range between 0t/τA3.4. For example, the probabilities under normalized contraction amplitude of 0.2 come from the dashed green line in (E) (corresponding to γ=0.63). The colored bars depict experimental data from the invagination of Drosophila ventral furrow published by Xie and Martin (31). The solid black lines depict the predicted boundaries between different states as obtained from our model.
Fig. 5.
Fig. 5.
Propagation of a plastic contraction wave within the tissue. (A) Evolution of the average junction tension in each cell. During simulations, the central two-round of cells (i.e., 7 cells at the center) are illuminated and thus activated at t=0. (B and C) Quantitative heatmaps of junction tension (B) and myosin activity (C) during the propagation of the plastic contraction wave shown in (A). The solid black line indicates that such a wave propagates at a speed of ~1 round of cells per 2 min. (D) Simulated (red points) and experimentally observed (32) (green belts) locations of the plastic wavefront, where the normalized myosin activity starts to be higher than 0.2. (EH) Propagation of the plastic contraction wave is affected by different physical parameters, including the critical activation strain (E), contraction amplitude (F), viscoelasticity [(G), unit: N s m−1], and reaction time [(H), unit: s].

Similar articles

Cited by

References

    1. Gilmour D., Rembold M., Leptin M., From morphogen to morphogenesis and back. Nature 541, 311–320 (2017). - PubMed
    1. Bonakdar N., et al. , Mechanical plasticity of cells. Nat. Mater. 15, 1090–1094 (2016). - PubMed
    1. Zhu M., Zernicka-Goetz M., Principles of self-organization of the mammalian embryo. Cell 183, 1467–1478 (2020). - PMC - PubMed
    1. Yanagida A., et al. , Cell surface fluctuations regulate early embryonic lineage sorting. Cell 185, 777–793.e20 (2022). - PMC - PubMed
    1. Jain S., Ladoux B., Mege R. M., Mechanical plasticity in collective cell migration. Curr. Opin. Cell Biol. 72, 54–62 (2021). - PubMed

MeSH terms

LinkOut - more resources