. 2023 Dec 1;11(12):1589-1597.
doi: 10.1158/2326-6066.CIR-23-0577.

Infusion Product TNFα, Th2, and STAT3 Activities Are Associated with Clinical Responses to Transgenic T-cell Receptor Cell Therapy

Affiliations

Infusion Product TNFα, Th2, and STAT3 Activities Are Associated with Clinical Responses to Transgenic T-cell Receptor Cell Therapy

Theodore S Nowicki et al. Cancer Immunol Res. .

Abstract

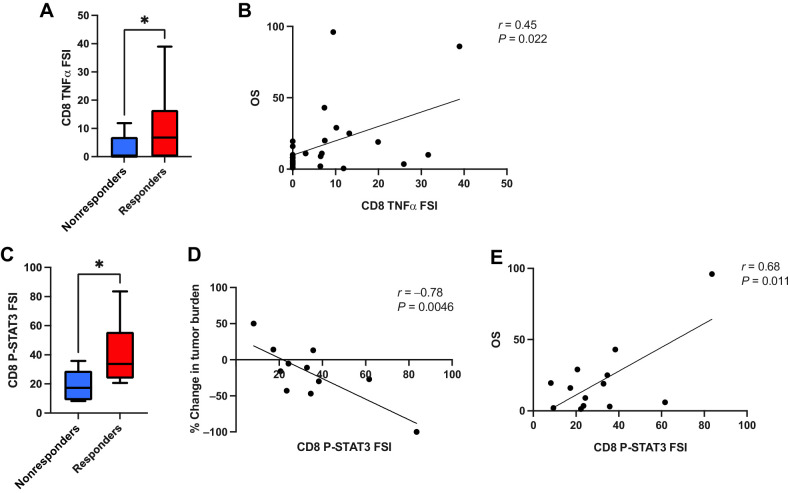
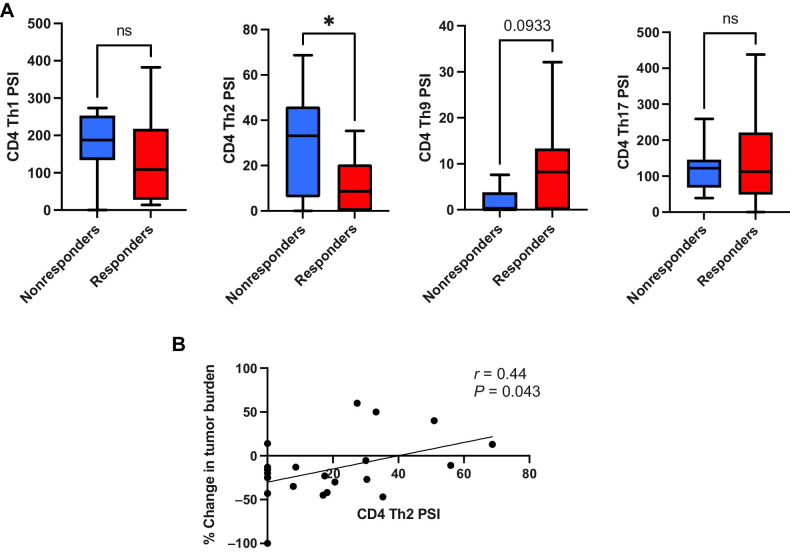
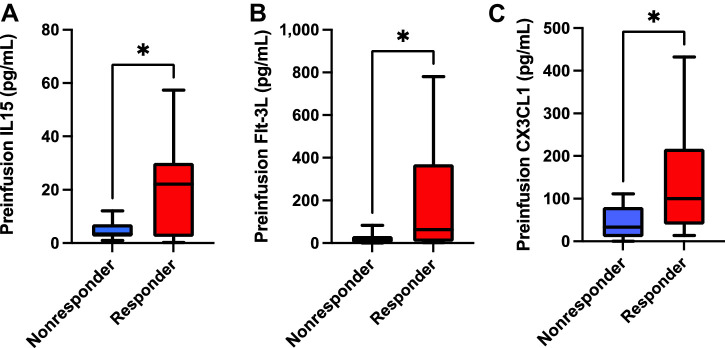
Transgenic T-cell receptor (TCR) T cell-based adoptive cell therapies for solid tumors are associated with dramatic initial response rates, but there remain many instances of treatment failure and disease relapse. The association of infusion product cytokine profiles with clinical response has not been explored in the context of TCR T-cell therapy products. Single-cell antigen-dependent secretomic and proteomic analysis of preinfusion clinical TCR T-cell therapy products revealed that TNFα cytokine functionality of CD8+ T cells and phospho-STAT3 signaling in these cells were both associated with superior clinical responsiveness to therapy. By contrast, CD4+ T-helper 2 cell cytokine profiles were associated with inferior clinical responses. In parallel, preinfusion levels of IL15, Flt3-L, and CX3CL1 were all found to be associated with clinical response to therapy. These results have implications for the development of therapeutic biomarkers and identify potential targets for enrichment in the design of transgenic TCR T-cell therapies for solid tumors.


Figures

Figure 1. CD8+ T-cell TNFα cytokine functionality and CD8+ T-cell p-STAT3 activity are associated with superior clinical response to transgenic TCR T-cell therapy. A, CD8+ T-cell TNFα FSI, i.e., the percentage of single cells secreting TNFα multiplied by the degree of cytokine secretion intensity, is significantly greater in clinical responders to therapy (n = 17) versus nonresponders (n = 10). B, CD8+ T-cell TNFα FSI is significantly associated with patient OS. C, CD8+ T-cell tonic p-STAT3 FSI is significantly greater in clinical responders to therapy versus nonresponders, and is significantly correlated with superior degree of antitumor response, as measured by peak percent change in tumor burden per RECIST1.1 criteria (D), as well as with greater patient OS (E). All box and whisker plots represent median at dividing line, with interquartile range represented by boxes, and lines representing minimum and maximum values for each dataset, and are compared by unpaired t test (*, P < 0.05), while all correlation plots represent Pearson r values. Each sample was run as an independent experiment, and data were aggregated by clinical response for analysis.
Figure 1.
CD8+ T-cell TNFα cytokine functionality and CD8+ T-cell p-STAT3 activity are associated with superior clinical response to transgenic TCR T-cell therapy. A, CD8+ T-cell TNFα FSI, i.e., the percentage of single cells secreting TNFα multiplied by the degree of cytokine secretion intensity, is significantly greater in clinical responders to therapy (n = 17) versus nonresponders (n = 10). B, CD8+ T-cell TNFα FSI is significantly associated with patient OS. C, CD8+ T-cell tonic p-STAT3 FSI is significantly greater in clinical responders to therapy versus nonresponders, and is significantly correlated with superior degree of antitumor response, as measured by peak percent change in tumor burden per RECIST1.1 criteria (D), as well as with greater patient OS (E). All box and whisker plots represent median at dividing line, with interquartile range represented by boxes, and lines representing minimum and maximum values for each dataset, and are compared by unpaired t test (*, P < 0.05), while all correlation plots represent Pearson r values. Each sample was run as an independent experiment, and data were aggregated by clinical response for analysis.
Figure 2. CD4+ Th2 cell cytokine polyfunctionality is associated with inferior clinical response to transgenic TCR T-cell therapy. A, Comparison of different CD4+ Th cell cytokine polyfunctionality profiles between clinical responders and nonresponders to TCR T-cell therapy (Th1 = IL2, IFNγ, Th2 = IL4, IL5, IL10, and IL13, Th9 = IL9, Th17 = IL17A, IL17F, IL22). CD4+ Th2 cell PSI (i.e., proportion of single cells secreting Th2 cytokines IL4, IL5, IL10, and IL13 multiplied by the signal intensity of those cytokines) is significantly greater in clinical nonresponders to therapy (n = 10) versus responders (n = 17). B, CD4+ Th2 cell PSI is associated with inferior peak change in tumor burden per RECIST1.1 criteria. All box and whisker plots represent median at dividing line, with interquartile range represented by boxes, and lines representing minimum and maximum values for each dataset, and are compared by unpaired t test (*, P < 0.05; ns, not significant), while all correlation plots represent Pearson r values. Each sample was run as an independent experiment, and data were aggregated by clinical response for analysis.
Figure 2.
CD4+ Th2 cell cytokine polyfunctionality is associated with inferior clinical response to transgenic TCR T-cell therapy. A, Comparison of different CD4+ Th cell cytokine polyfunctionality profiles between clinical responders and nonresponders to TCR T-cell therapy (Th1 = IL2, IFNγ, Th2 = IL4, IL5, IL10, and IL13, Th9 = IL9, Th17 = IL17A, IL17F, IL22). CD4+ Th2 cell PSI (i.e., proportion of single cells secreting Th2 cytokines IL4, IL5, IL10, and IL13 multiplied by the signal intensity of those cytokines) is significantly greater in clinical nonresponders to therapy (n = 10) versus responders (n = 17). B, CD4+ Th2 cell PSI is associated with inferior peak change in tumor burden per RECIST1.1 criteria. All box and whisker plots represent median at dividing line, with interquartile range represented by boxes, and lines representing minimum and maximum values for each dataset, and are compared by unpaired t test (*, P < 0.05; ns, not significant), while all correlation plots represent Pearson r values. Each sample was run as an independent experiment, and data were aggregated by clinical response for analysis.
Figure 3. Preinfusion IL15, Flt-3L, and CX3CL1 serum levels are all associated with superior clinical response to transgenic TCR T-cell therapy. Serum levels of IL15 (A), Flt-3L (B), and CX3CL1/fractalkine (C) obtained prior to transgenic TCR T-cell infusions were all significantly greater in clinical responders to therapy (n = 17) compared with nonresponders (n = 10). All box and whisker plots represent median at dividing line, with interquartile range represented by boxes, and lines representing minimum and maximum values for each dataset, and are compared by unpaired t test (*, P < 0.05), while all correlation plots represent Pearson r values. Each sample was run as an independent experiment, and data were aggregated by clinical response for analysis.
Figure 3.
Preinfusion IL15, Flt-3L, and CX3CL1 serum levels are all associated with superior clinical response to transgenic TCR T-cell therapy. Serum levels of IL15 (A), Flt-3L (B), and CX3CL1/fractalkine (C) obtained prior to transgenic TCR T-cell infusions were all significantly greater in clinical responders to therapy (n = 17) compared with nonresponders (n = 10). All box and whisker plots represent median at dividing line, with interquartile range represented by boxes, and lines representing minimum and maximum values for each dataset, and are compared by unpaired t test (*, P < 0.05), while all correlation plots represent Pearson r values. Each sample was run as an independent experiment, and data were aggregated by clinical response for analysis.

References

    1. Chodon T, Comin-Anduix B, Chmielowski B, Koya RC, Wu Z, Auerbach M, et al. . Adoptive transfer of MART-1 T-cell receptor transgenic lymphocytes and dendritic cell vaccination in patients with metastatic melanoma. Clin Cancer Res 2014;20:2457–65. - PMC - PubMed
    1. Nowicki TS, Berent-Maoz B, Cheung-Lau G, Huang RR, Wang X, Tsoi J, et al. . A pilot trial of the combination of transgenic NY-ESO-1-reactive adoptive cellular therapy with dendritic cell vaccination with or without ipilimumab. Clin Cancer Res 2019;25:2096–108. - PMC - PubMed
    1. Rossi J, Paczkowski P, Shen YW, Morse K, Flynn B, Kaiser A, et al. . Preinfusion polyfunctional anti-CD19 chimeric antigen receptor T cells associate with clinical outcomes in NHL. Blood 2018;132:804–14. - PMC - PubMed
    1. Dudley ME, Yang JC, Sherry R, Hughes MS, Royal R, Kammula U, et al. . Adoptive cell therapy for patients with metastatic melanoma: evaluation of intensive myeloablative chemoradiation preparative regimens. J Clin Oncol 2008;26:5233–9. - PMC - PubMed
    1. Ma C, Cheung AF, Chodon T, Koya RC, Wu Z, Ng C, et al. . Multifunctional T-cell analyses to study response and progression in adoptive cell transfer immunotherapy. Cancer Discov 2013;3:418–29. - PMC - PubMed

Publication types