. 2023 Dec 6;43(49):8403-8424.
doi: 10.1523/JNEUROSCI.0581-23.2023.

Angular Head Velocity Cells within Brainstem Nuclei Projecting to the Head Direction Circuit

Affiliations

Angular Head Velocity Cells within Brainstem Nuclei Projecting to the Head Direction Circuit

Jalina A Graham et al. J Neurosci. .

Abstract

The sense of orientation of an animal is derived from the head direction (HD) system found in several limbic structures and depends on an intact vestibular labyrinth. However, how the vestibular system influences the generation and updating of the HD signal remains poorly understood. Anatomical and lesion studies point toward three key brainstem nuclei as key components for generating the HD signal-nucleus prepositus hypoglossi, supragenual nucleus, and dorsal paragigantocellularis reticular nuclei. Collectively, these nuclei are situated between the vestibular nuclei and the dorsal tegmental and lateral mammillary nuclei, which are thought to serve as the origin of the HD signal. To determine the types of information these brain areas convey to the HD network, we recorded neurons from these regions while female rats actively foraged in a cylindrical enclosure or were restrained and rotated passively. During foraging, a large subset of cells in all three nuclei exhibited activity that correlated with the angular head velocity (AHV) of the rat. Two fundamental types of AHV cells were observed; (1) symmetrical AHV cells increased or decreased their firing with increases in AHV regardless of the direction of rotation, and (2) asymmetrical AHV cells responded differentially to clockwise and counterclockwise head rotations. When rats were passively rotated, some AHV cells remained sensitive to AHV, whereas firing was attenuated in other cells. In addition, a large number of AHV cells were modulated by linear head velocity. These results indicate the types of information conveyed from the vestibular nuclei that are responsible for generating the HD signal.SIGNIFICANCE STATEMENT Extracellular recording of brainstem nuclei (nucleus prepositus hypoglossi, supragenual nucleus, and dorsal paragigantocellularis reticular nucleus) that project to the head direction circuit identified different types of AHV cells while rats freely foraged in a cylindrical environment. The firing of many cells was also modulated by linear velocity. When rats were restrained and passively rotated, some cells remained sensitive to AHV, whereas others had attenuated firing. These brainstem nuclei provide critical information about the rotational movement of the head of the rat in the azimuthal plane.

Keywords: angular head velocity; head direction; navigation; nucleus prepositus; spatial orientation; supragenual nucleus.


Figures

Figure 1.
Figure 1.
Circuitry showing the major connections of the vestibular inputs into the HD network (highlighted by orange borders). Green squares represent areas where AHV cells have been identified, and blue squares indicate areas where HD cells have been identified. Brain areas discussed in this study are all afferent to the DTN, and their interconnections in the brainstem are highlighted in orange. IPN, Interpeduncular nucleus.
Figure 2.
Figure 2.
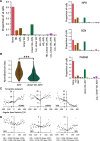
A, Photographs and schematic illustrations of coronal sections showing the location of NPH and PGRNd within the brainstem at −10.80 mm (left) and −11.50 mm (right) posterior to bregma. Each color track represents a different animal. Symbols represent the locations of different AHV cell types. B, Corresponding photomicrographs of example coronal sections stained with thionin at the level of anterior (top) and posterior (bottom) NPH/PGRNd. In both cases electrode tracks through the NPH (red arrows) and PGRNd (blue arrows) are visible. C, D, Examples of representative AHV cells localized to the NPH (C) and PGRNd (D). Cells 2, 8, 12 are asymmetric cells. Cells 1 and 7 are asymmetric-unresponsive cells. Cells 3, 4, 5, 10, 11 are symmetric cells. Cells 6 and 9 are inverted cells. Cells 3 and 12 are considered offset cells where the minimum firing rate occurred at ∼100°/s for cell 3 (blue arrowhead); for cell 12 the maximum firing rate occurred at ∼50°/s for the inverted cell (blue arrowhead). The location of different AHV cell types is shown for each track. There was no apparent organized localization for any of the AHV cell types. Cells 1, 2, 3, 5, 9, 10, 11 were recorded from the right hemisphere; cells 4, 6, 7, 8, 12 were recorded from the left hemisphere. Labels for all plots, as well as CW and CCW values, are as depicted for cell 10. asc7, Genu of the facial nerve; CI, caudal interstitial nucleus of the medial longitudinal fasciculus; g7, genu of the facial nerve; mlf, medial longitudinal fasciculus; V4, fourth ventricle.
Figure 3.
Figure 3.
SGN AHV cells. A, Photograph of coronal Nissl-stained section at about −10.30 posterior to bregma. Magnified view is a schematic illustration showing the location of AHV cells along with the electrode tracks from all rats passing through the SGN. Each color track represents a different animal. Symbols represent the locations of different AHV cell types. B, A representative thionin-stained section showing an electrode track (red arrow) passing through the SGN. C, Examples of representative AHV cells. Cells 1–3 are asymmetric cells, cells 4 and 5 are symmetric cells, cell 6 is an inverted cell, cells 7 and 8 show examples of offset cells where the minimum firing rate is not at 0°/s (blue arrowheads). Cell 9 is a symmetric AHV cell that marginally passed the correlation, slope, and shuffle criteria for AHV but was not identified by the GLM analyses as an AHV cell. The location of different AHV cell types is shown for each track. There was no apparent organized localization for any of the AHV cell types. Cells 2, 5, 8, 9 were recorded from the right hemisphere; cells 1, 3, 4, 6, 7 were recorded from the left hemisphere. CW and CCW values and labels for all plots are as shown for cell 7. asc7, Genu of the facial nerve; CI, caudal interstitial nucleus of the medial longitudinal fasciculus; g7, genu of the facial nerve; mlf, medial longitudinal fasciculus; V4, fourth ventricle; NI, nucleus incertus; PCG: pontine central gray.
Figure 4.
Figure 4.
A, A scatterplot of the magnitude of the slopes for all AHV cells recorded, color coded based on cell type. Dashed gray lines indicate the cutoffs dividing AHV cell types. The red box indicates the boundaries of the threshold slope criterion (absolute value of slope ≥ 0.025). Each point represents the CW and CCW slope of an AHV cell. Cells are color coded to represent different AHV cell types. The expected AHV tuning curve shape for each AHV cell type is shown around the perimeter within the region of the plot containing that cell type. Red AHV icons indicate portions of the tuning curves that show a positive relationship between increasing AHV and firing rate, blue lines indicate a negative relationship, and black lines indicate no relationship. B, AHV tuning curve measures compared across different AHV cell types and non-AHV cells. C, Proportions of each AHV cell type in each brain region. There were no significant differences between the three brain areas. Note, the inverted cells are too few in number to register a visible bar on the plot. Extended Data Figure 4-1 shows analyses concerning spike widths.
Figure 5.
Figure 5.
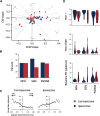
A, A scatterplot of the magnitude of the slopes (as in Fig. 4B) showing all AHV cells with a contraversive or ipsiversive turn bias. The red box indicates the boundaries of the threshold slope criterion (absolute value of slope ≥ 0.025). The expected AHV tuning curve shape for each AHV cell type is shown around the perimeter within the region of the plot containing that cell type. Red AHV icons indicate portions of the tuning curves that show a positive relationship between increasing AHV and firing rate, blue lines indicate a negative relationship, and black lines indicate no relationship. B, Proportions of contraversive and ipsiversive AHV cells in each brain area. C, Two asymmetric AHV cells recorded simultaneously on different electrodes that were in close proximity to one another in the left NPH. Note that the firing rate increases in the CW direction for one cell (left, contraversive) and in the CCW direction in the other cell (right, ipsiversive). D, AHV tuning curve measures (maximum r, maximum slope, baseline firing rate) compared between ipsiversive and contraversive cells for each brain area.
Figure 6.
Figure 6.
Example AHV (left) and linear velocity (right) tuning curves for five cells with significant tuning for both variables.
Figure 7.
Figure 7.
A, Stacked histogram showing the number of different types of AHV cells and non-AHV cells for each brain area. Solid color bars (blue, magenta, green) indicate the number of cells that were tuned to linear velocity for each category, with the darker color bar indicating the number of cells that had positive correlations and the lighter color bar indicating the number of cells with negative correlations. Shaded gray bars depict pure AHV cells that were not sensitive to linear velocity. Pure linear velocity cells that were not tuned to AHV are shown by the solid color bar in the non-AHV cell category. Numbers at the top of the non-AHV categories indicate the total number of non-AHV cells for that brain area (including the linear velocity-only cells). B, A scatterplot of CW and CCW slopes (as in Figs. 4, 5) of cells that passed threshold criteria and shuffles for both AHV and linear velocity. The red box indicates the boundaries of the threshold criterion (r ≥ 0.5; absolute value of slope ≥ 0.025). Red lines indicate a positive linear velocity correlation, blue lines a negative linear velocity correlation, and black lines no relationship. C, A scatterplot of Pearson's correlation values for AHV and linear velocity for cells that passed threshold criteria and shuffles for both AHV and linear velocity. The red dotted line is unity. Colors represent AHV cell types.
Figure 8.
Figure 8.
A, Left, Proportions of GLM classifications using HD, AHV, linear velocity, and location (Loc) as variables. Right, Same as left but for each brain area. B, Bar graph comparing symmetry (normalized turn bias) in cells that the GLM classified as only AHV or conjunctively coding AHV and linear velocity. C, Examples of three AHV cells that passed the threshold criteria for correlation, slope, and shuffle procedure but did not pass the GLM criteria for AHV. D, Examples of three non-AHV cells that passed the GLM criteria for AHV but did not pass the threshold criteria. Note that in each case either the CW/CCW correlation r or slope values of the cell did not reach the threshold criteria for categorizing the cell as an AHV cell. *** P < 0.0001
Figure 9.
Figure 9.
Linear velocity and GLM. A, Linear velocity tuning curves for two representative cells that passed the linear velocity threshold criteria (correlation, slope, and shuffle) but were not selected by the GLM analysis as linear velocity sensitive. B, Linear velocity tuning curves for two representative cells that did not pass the linear velocity threshold criteria (correlation, slope, and shuffle) but were selected by the GLM analysis as linear velocity sensitive. The corresponding AHV tuning curves are shown below each cell. The cell on the right in A did not meet threshold criteria to be classified as an AHV cell.
Figure 10.
Figure 10.
A, Examples of three AHV cells and one non-AHV cell (far right) that passed the HD GLM criteria but did not have significant directional tuning by classic classification criteria (Rayleigh r > 0.4, directional firing ranges > 120°, peak firing rates > 5 spikes/s). HD versus firing rate plots (top row) and their corresponding AHV tuning plots (bottom row) are shown. B, Head direction tuning curves for the one SGN cell identified as HD modulated during two standard conditions (Std 1 and Std 2, black and blue lines, respectively) and an intervening session, where the prominent visual cue in the recording arena was rotated by 90°. C, The HD cell in B was also significantly tuned to AHV with an asymmetric tuning curve. D, The tuning curve for linear velocity of the same cell showing no firing rate modulation with changes in linear velocity. E, Summary plot of all cells identified as HD by the GLM. Almost all the cells have a half session stability <0.5 and a tuning strength (Rayleigh r) <0.3. The HD-modulated cell in B is highlighted by a red square symbol.
Figure 11.
Figure 11.
Active–passive responses. A–H, Tuning curves for active-passive-active sessions. Cells from NPH (A–C), cells from SGN (D, E), cells from PGRNd (FH). Cells in A, D, G, and H were recorded from rats that were head fixed for the passive session; cells in B, C, E, and F were recorded from rats that were hand held and rotated back and forth in the passive session. Cells in A and C–F were classified as asymmetric AHV cells; the cells in B and G were classified as symmetric AHV cells, and the cell in H was classified as an inverted AHV cell. CW and CCW turns for all plots are labeled as shown in H (right) See text in Results, Brainstem AHV cells show mixed AHV tuning responses during passive rotation, for further details in terms of different response patterns. The cells in B, C, E, F, G, and H were also classified as linear-velocity-tuned cells based on threshold criteria.

Update of

References

    1. Angelaki DE, Cullen KE (2008) Vestibular system: the many facets of a multimodal sense. Annu Rev Neurosci 31:125–150. 10.1146/annurev.neuro.31.060407.125555 - DOI - PubMed
    1. Asumbisa K, Peyrache A, Trenholm S (2022) Flexible cue anchoring strategies enable stable head direction coding in both sighted and blind animals. Nat Commun 13:5483. 10.1038/s41467-022-33204-0 - DOI - PMC - PubMed
    1. Barthó P, Hirase H, Monconduit L, Zugaro M, Harris KD, Buzsáki G (2004) Characterization of neocortical principal cells and interneurons by network interactions and extracellular features. J Neurophysiol 92:600–608. 10.1152/jn.01170.2003 - DOI - PubMed
    1. Bassett JP, Taube JS (2001) Neural correlates for angular head velocity in the rat dorsal tegmental nucleus. J Neurosci 21:5740–5751. 10.1523/JNEUROSCI.21-15-05740.2001 - DOI - PMC - PubMed
    1. Bassett JP, Tullman ML, Taube JS (2007) Lesions of the tegmentomammillary circuit in the head direction system disrupt the head direction signal in the anterior thalamus. J Neurosci 27:7564–7577. 10.1523/JNEUROSCI.0268-07.2007 - DOI - PMC - PubMed

Publication types

LinkOut - more resources