. 2023 Oct 23;14(1):6712.
doi: 10.1038/s41467-023-42288-1.

A non-canonical striatopallidal Go pathway that supports motor control

Affiliations

A non-canonical striatopallidal Go pathway that supports motor control

Marie A Labouesse et al. Nat Commun. .

Abstract

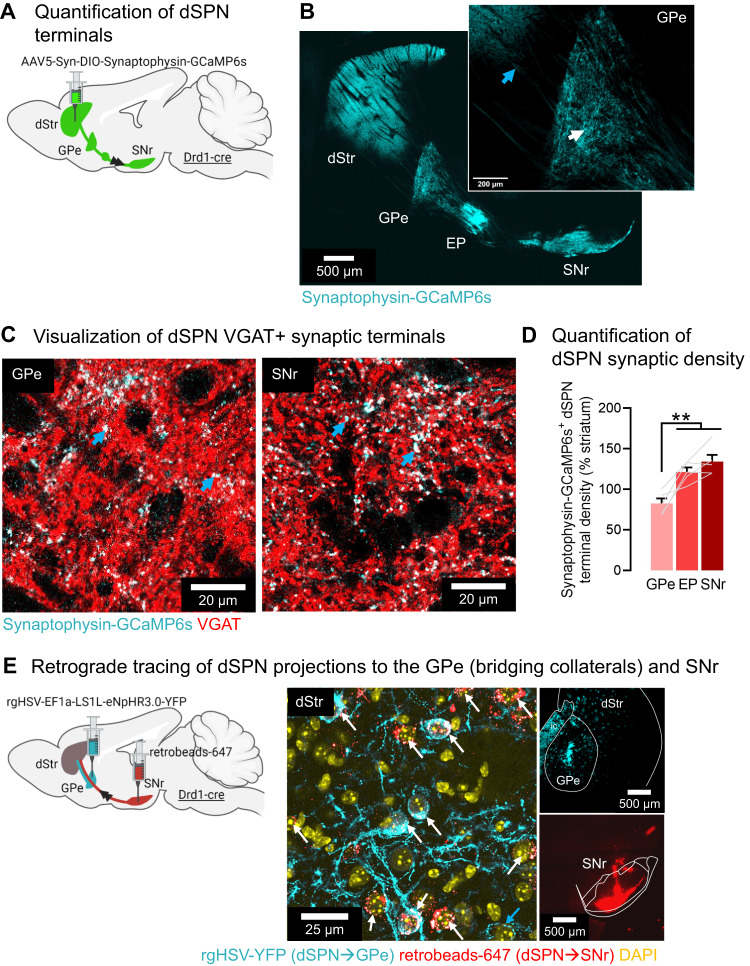
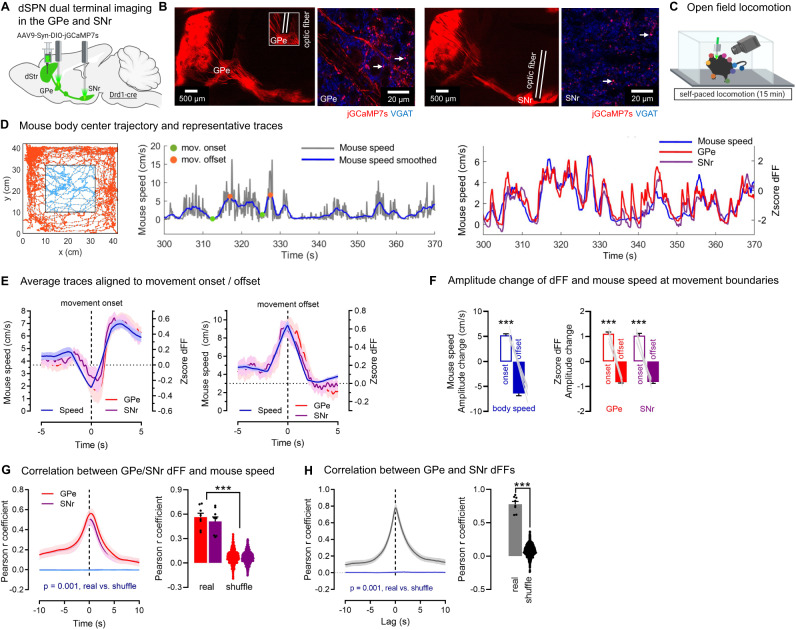
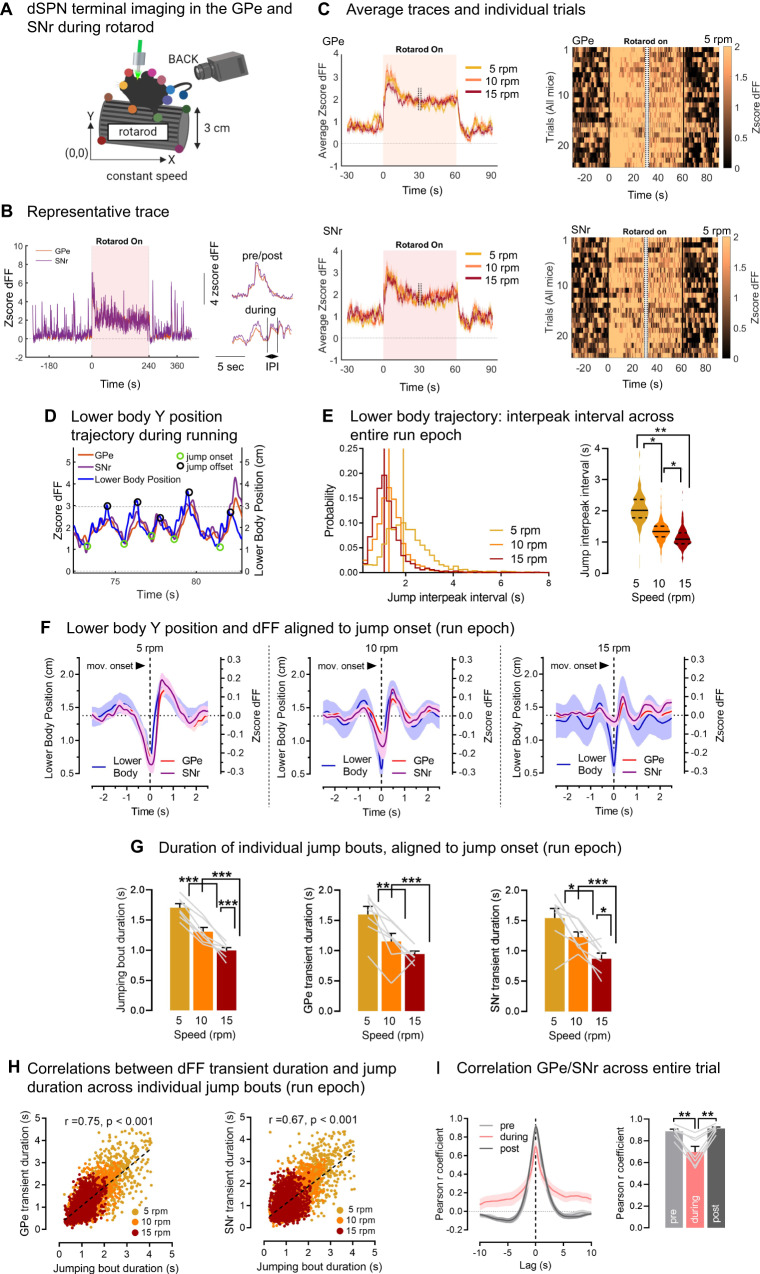
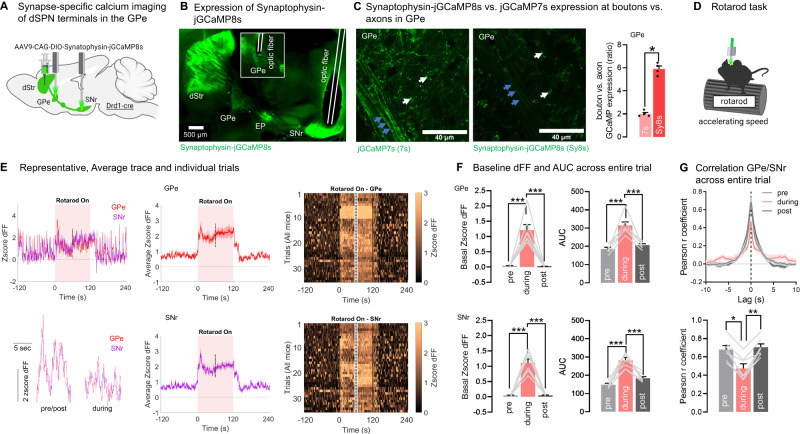
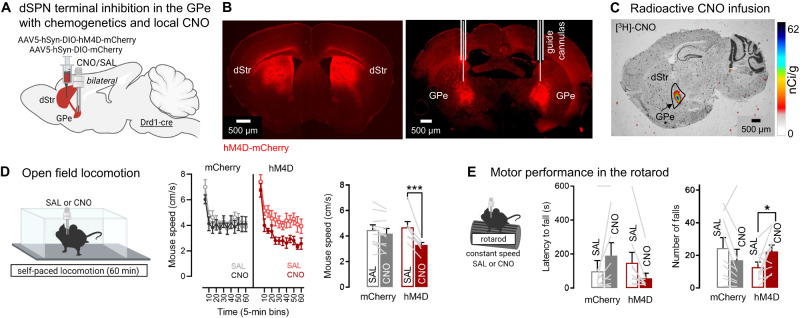
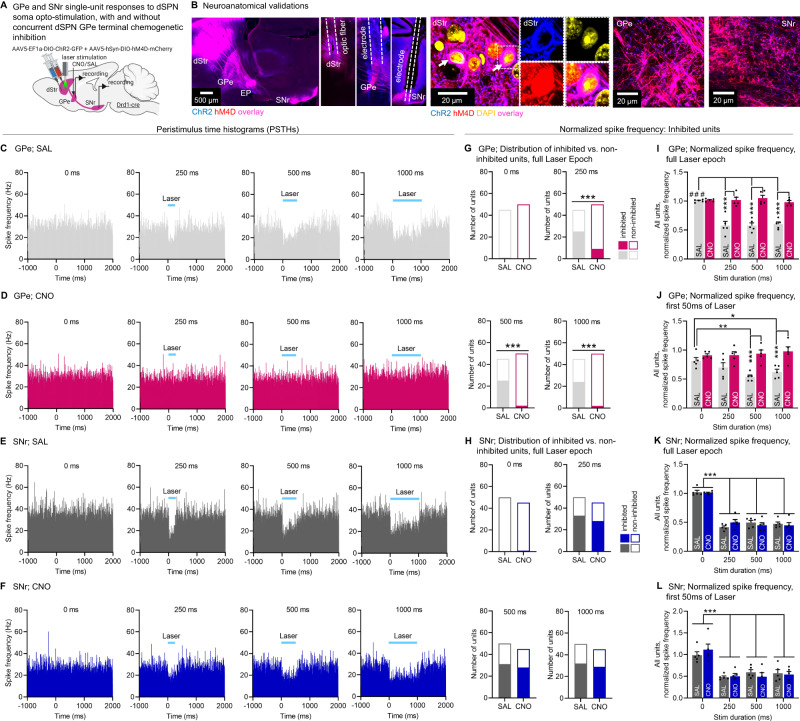
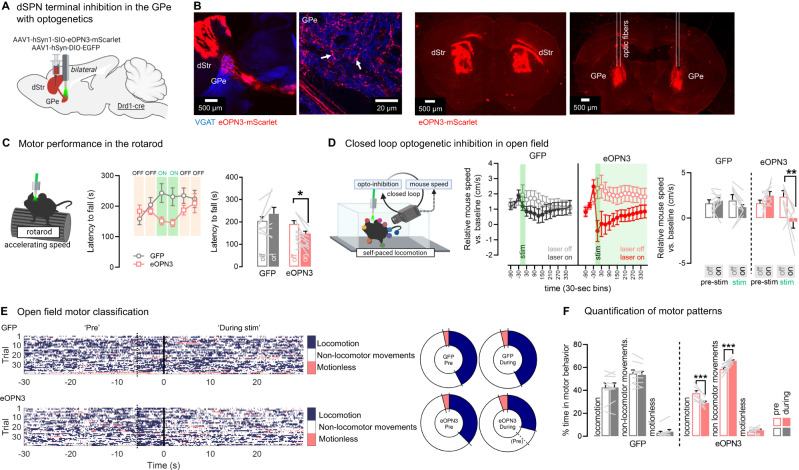
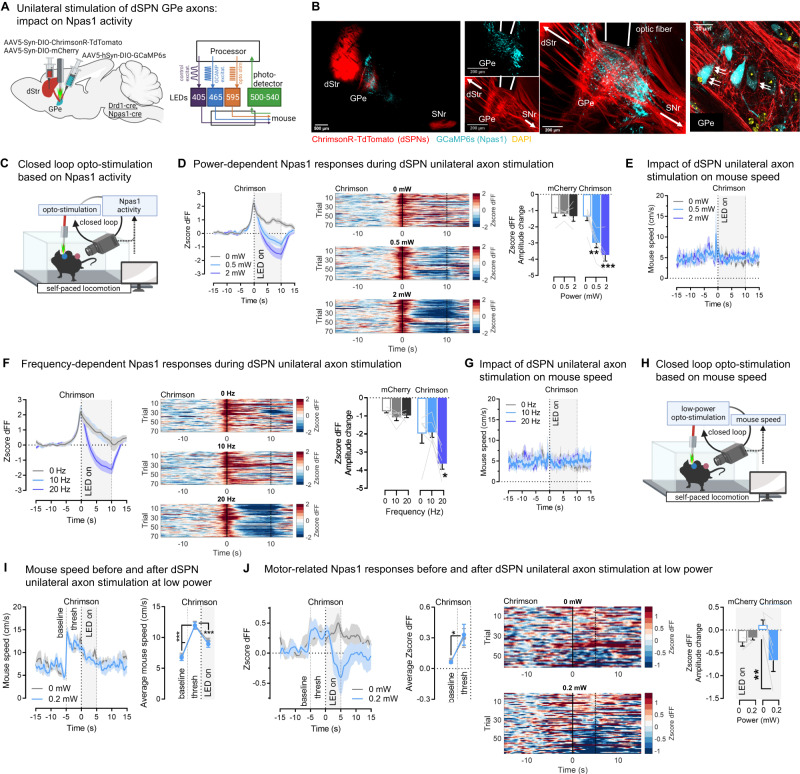
In the classical model of the basal ganglia, direct pathway striatal projection neurons (dSPNs) send projections to the substantia nigra (SNr) and entopeduncular nucleus to regulate motor function. Recent studies have re-established that dSPNs also possess axon collaterals within the globus pallidus (GPe) (bridging collaterals), yet the significance of these collaterals for behavior is unknown. Here we use in vivo optical and chemogenetic tools combined with deep learning approaches in mice to dissect the roles of dSPN GPe collaterals in motor function. We find that dSPNs projecting to the SNr send synchronous motor-related information to the GPe via axon collaterals. Inhibition of native activity in dSPN GPe terminals impairs motor activity and function via regulation of Npas1 neurons. We propose a model by which dSPN GPe axon collaterals (striatopallidal Go pathway) act in concert with the canonical terminals in the SNr to support motor control by inhibiting Npas1 neurons.


Conflict of interest statement

J.B. and M.M. (individuals) are listed as inventors on an application (62/627,527) filed with the U.S. Patent Office regarding DREADD compounds, but none of these compounds are used in the manuscript. M.M. has received research funding from AstraZeneca, Redpin Therapeutics, and Attune Neurosciences. J.V.-V. has served on advisory boards for Roche, Novartis, and SynapDx; has received research funding from Roche, Novartis, SynapDx, Forest, Janssen, Yamo, MapLight, and Seaside Therapeutics; and has received editorial stipends from Wiley and Springer. O.Y. (indiviual) is listed as an inventor on a patent application (US20210403518A1) filed with the US Patent Office regarding the optogenetic tool eOPN3 used in Fig. 7 and Fig. S8, and serves as a consultant for Modulight.bio. Remaining authors declare no competing interests.

Figures

Fig. 1
Fig. 1. The density of dSPN terminals in the GPe account for more than half the density of SNr terminals.
A Strategy for anterograde tracing of direct pathway striatal projection neuron (dSPN) axons/terminals using the presynapse-targeted tracer Synaptophysin-GCaMP6s. B Synaptophysin-GCaMP6s is largely absent from axons (blue arrow) and enriched in terminals (white arrow) (representative images from N = 5 mice). C Synaptophysin-targeted dSPN terminals (cyan) colocalize with the presynaptic GABA marker VGAT (red), appearing white (blue arrows). D The density of dSPN Synaptophyin-GCaMP6s+ (antibody amplified for GFP) terminals in the globus pallidus externus (GPe) (83%) reaches more than half the density in the entopeduncular nucleus (EP) (123%) and substantia nigra reticulata (SNr) (134%) (ANOVA: region p < 0.001; Tukey post-hocs: **p < 0.01) (N = 5 mice). Data are mean ± SEM. E Confirmation that dSPN terminals in the GPe arise from axons projecting to the SNr (representative images from N = 3 mice). Left: Injection of retrograde herpes-simplex virus (HSV) expressing a flexed YFP into the GPe and red retrobeads (retrobeads-647) into the SNr of Drd1-cre mice. Right: YFP+ cell bodies colocalized with retrobeads+ cells in the DMS, identifying dSPNs projecting to both GPe and SNr (white arrows). Note that retrobeads had a puncta-like labeling pattern, while YFP staining either had a puncta-like pattern or covered the whole soma. White or red puncta in YFP-positive soma indicate colocalization. There were also retrobeads-, YFP+ cell bodies, identifying neurons projecting only to the GPe (blue arrow). Out of 159 YFP+ cells counted, 147 were also retrobeads+ (92.5%), 12 were retrobeads- (7.5%). Out of 148 retrobeads+ cells counted, all but 1 was YFP+ (99.3%). Exact p-values are given in Supplementary Dataset S2. See also Supplementary Figs. S2, S3.
Fig. 2
Fig. 2. dSPNs send copies of motor signals to GPe and SNr axons, continuously encoding body speed.
A Strategy for dual calcium recordings with fiber photometry of direct pathway striatal projection neuron (dSPN) terminals in the globus pallidus externus (GPe) and substantia nigra reticulata (SNr) arising from neurons in the dorsomedial section of the dorsal striatum (dStr) using the calcium indicator jGCaMP7s. B jGCaMP7s (red) colocalizes with the GABA presynaptic marker VGAT (blue) in the GPe and SNr, appearing pink (white arrows). Optic fibers target GPe and SNr jGCaMP7s+ regions. C Mice are video-recorded in the open field and body positions obtained with DeepLabCut. D Left: Representative body trajectory. Middle: Representative trace of mouse speed over time (raw data: gray; smoothed in 2 s bins: blue), showing the onset (green) and offset (orange circle) of motor bouts. Right: dSPN GPe and SNr calcium signals (Zscore of the normalized fluorescence, i.e., deltaF/F; dFF) closely track mouse speed. E Average data aligned to the onset and offset of individual motor bouts. GPe and SNr dFF show increases at movement onset and decreases at movement offset. F Body speed (two-sided paired t-test ***p < 0.001) and GPe/SNr dFF (ANOVA: main effect: ***p < 0.001) significantly increase at movement onset vs. offset. G GPe (r = 0.56) and SNr (r = 0.51) dFF significantly correlate with mouse speed when compared to phase-shuffled data (N = 1000 iterations) (two-sided Mann–Whitney GPe ***p = 0.001, SNr ***p = 0.001). Real data: black dots show individual mice; shuffle data: colored dots show individual shuffled data. H GPe and SNr dFF are highly correlated with each other (Pearson r = 0.78) vs. phase-shuffled data (N = 1000 iterations) (two-sided Mann–Whitney ***p = 0.001). Real data: black dots show individual mice; shuffle data: black dots show individual shuffled data. N = 8 mice for all panels. Exact p-values are given in Supplementary Dataset S2. Data are mean ± SEM. Source data are provided as a Source Data file.
Fig. 3
Fig. 3. dSPN GPe and SNr axons track the temporal boundaries of individual motor bouts.
A Globus pallidus externus (GPe) and substantia nigra reticulata (SNr) direct pathway striatal projection neuron (dSPN) axonal recordings using the calcium indicator jGCaMP7s. Mice are video-recorded in the rotarod set at constant speeds. Body part positions are obtained with DeepLabCut. B Representative trace of GPe/SNr zscored normalized fluorescence, i.e., deltaF/F (dFF), with zoom-in view (left inlet). IPI: interpeak interval. C Average GPe/SNr dFF traces at increasing speeds (left) and heatmaps of all individual trials at 5 rounds per minute (rpm) (3/animal) (right) showing sustained activity across the running epoch. Only the first/last 30 s of the rotarod epoch is shown (cut-off = dashed lines). D Representative trace of mouse lower body position on the Y axis during running, showing the onset (green) and offset (black circle) of jumping bouts. dSPN GPe and SNr dFF closely track lower body Y trajectory. Dashed lines show lower (0 cm) and upper (3 cm) bounds of the rotarod. E Left: Probability distributions of jump IPIs. Maximal probability (vertical bar) is reached at smaller IPIs as the rotarod speed increases. Right: Jump IPI averaged per animal significantly decreases as the rotarod speed increases (ANOVA: speed: p < 0.01; Tukey post-hocs: *p < 0.05 or **<0.01). F Average data aligned to the onset of individual jump bouts during running. GPe and SNr dFF increases at jump onset, showing shorter and smaller transients with increasing rotarod speed. G Duration of jumping bouts (peak-to-peak) and duration of GPe/SNr dFF transients (peak-to-peak) significantly decrease with rotarod speed (all: ANOVA: speed: p < 0.01, Tukey post-hocs: *p < 0.05, **<0.01, ***<0.001). H Duration of individual jumping bouts significantly correlate with duration of individual GPe/SNr dFF transients (Pearson r, all p < 0.001: duration: GPe: r = 0.75; SNr: r = 0.67). I Pearson correlation between GPe and SNr activity decreases in a task-dependent manner between rest (pre/post: r = 0.90) and running (r = 0.70) (ANOVA: epoch: p < 0.01, post-hoc: **p < 0.01). N = 7 mice for all experiments. Data are mean ± SEM. Exact p-values are given in Supplementary Dataset S2. See also Supplementary Figs. S4, S5. Source data are provided as a Source Data file.
Fig. 4
Fig. 4. dSPN presynaptic terminal photometry in the GPe and SNr confirms task-dependent correlation in a rotarod motor task.
A Strategy for terminal-specific calcium recordings with fiber photometry using the presynapse-targeted calcium sensor Synaptophysin-jGCaMP8s for direct pathway striatal projection neuron (dSPN) terminals in the globus pallidus externus (GPe) and substantia nigra reticulata (SNr) B Synaptophysin-jGCaMP8s expression in the dorsomedial section of the dorsal striatum (dStr) with optic fibers targeting the GPe (inlet from other section) and SNr, representative from N = 7. EP entopeduncular nucleus. C Left: Synaptophysin-jGCaMP8s (Sy8s) is expressed in terminals (white arrows) but poorly in axons in the GPe at 10–14 days post injection. As a comparison, untargeted jGCaMP7s is detected in terminals (white arrows) and axons (blue arrows) in the GPe. Right: Quantification of optical density in boutons vs. axons in the GPe shows sixfold bouton enrichment in Synaptophysin-jGCaMP8s and twofold in jGCaMP7s brains (ANOVA: epoch: p < 0.001, Tukey post-hocs: *p < 0.05). Quantification made in unstained fixed brains (native fluorescence) to avoid potential antibody amplification artefacts (N = 4 mice). D Mice are tested in the rotarod at accelerating speeds 10–14 days post injection. E Representative trace of GPe/SNr zscored normalized fluorescence, i.e., deltaF/F (dFF) and zoom-in inlet (left) for an individual animal, average trace of all mice (middle) and heatmaps of all individual trials (right) showing terminal-specific dSPN GPe and SNr activity in the rotarod task. Only the first and last 30 s of the rotarod epoch is shown (cut-off = dashed lines). F GPe and SNr terminal activity shows a significant increase in baseline and area under the curve (AUC) in the run epoch (during) vs rest (pre/post) (all: ANOVA: epoch: p < 0.001; Tukey post-hoc: all: ***p < 0.001). G Pearson correlation between GPe and SNr activity decreases in a task-dependent manner between rest (pre/post: r = 0.69) and running (r = 0.47) (ANOVA: epoch: p < 0.01, Tukey post-hocs: *p < 0.05, **p < 0.01). N = 7 mice for all photometry experiments. Exact p-values are given in Supplementary Dataset S2. Data are mean ± SEM. Source data are provided as a Source Data file.
Fig. 5
Fig. 5. dSPN bridging collaterals in the GPe support motor function as revealed with chemogenetic inhibition.
A Strategy for chemogenetic inhibition of direct pathway striatal projection neuron (dSPN) terminals in the globus pallidus externus (GPe) using GPe infusion of clozapine-N-oxide (CNO) and the inhibitory designer receptor hM4D. dStr: dorsal striatum. B Fluid cannulas target dSPN terminals in the GPe expressing hM4D-mCherry, representative from N = 10 mCherry, 9 hM4D. C Representative image from N = 3 of local radioactive [3H]-labeled clozapine-N-oxide (CNO) infusion confirming the drug can stay restricted in the GPe at this volume (300nL). D Left: Mice are tested in the open field after infusion of Saline (SAL) or CNO. Right: Chemogenetic inhibition of dSPN GPe terminals significantly reduces locomotion speed (ANOVA: virus x drug p < 0.001; Sidak post-hoc: SAL vs CNO: hM4D p < 0.001, mCherry p = 0.32), N = 10 mCherry, 7 hM4D. E Left: Mice are tested in the rotarod at constant speed after SAL/CNO infusion. Mice are allowed to return to the rotarod if they fall. Right: Chemogenetic inhibition of dSPN GPe terminals significantly increases the number of falls (ANOVA: virus x drug p < 0.05; Sidak post-hoc: SAL vs CNO: hM4D p < 0.05, mCherry p = 0.12). N = 9 mCherry, 9 hM4D. Exact p-values are given in Supplementary Dataset S2. Data are mean ± SEM. Source data are provided as a Source Data file.
Fig. 6
Fig. 6. Confirmation that chemogenetic manipulation of dSPN GPe terminals does not affect activity in the SNr.
A Strategy for in vivo recordings of globus pallidus externus (GPe) and substantia nigra reticulata (SNr) units following opto-stimulation of direct pathway striatal projection neuron (dSPN) somas with ChR2 and chemogenetic inhibition (with hM4D) of dSPN GPe terminals using local Saline (SAL) or clozapine-N-oxide (CNO, 1 mM/300 nL) infusion B Expression of hM4D-mCherry (red) and ChR2-YFP (blue) and their colocalization (white arrow) in dSPN somas in the dStr (see optic fiber tracks) and terminals in the GPe/SNr (see electrode tracks). C, D Peristimulus time-histograms (PSTHs) showing mean spike frequency of all recorded GPe neurons before, during, and after laser-stimulation (1 ms bins) in all animals with GPe SAL (C) or CNO (D) treatment. E, F Same as C, D for the SNr. G Proportion of GPe units for which basal firing activity is significantly decreased (inhibited units) or not (non-inhibited units) after laser-stimulation at different durations calculated in the full laser epoch (Fisher’s test SAL vs. CNO at 250, 500, 1000 ms: ***p < 0.001; at 0 ms p = 0.48). H Same as G for the SNr (Fisher’s test at all stim durations: SAL vs CNO: p = 0.48-0.99). I Normalized spike frequency in the GPe calculated in the full laser epoch normalized to the 1000 ms pre-stimulation period for all units (ANOVA: stim duration x drug p < 0.001; Sidak post-hocs SAL vs. CNO at 250, 500, 1000 ms: all ***p < 0.001; Sidak post-hocs 0 ms vs. other durations: all SAL: #p < 0.001, all CNO: p = 0.8–1.0). J Same as I calculated in the first 50 ms of the laser epoch (ANOVA: stim duration x drug p = 0.0313; Sidak post-hocs SAL vs. CNO at 250 ms p = 0.0586, 500 and 1000 ms ***p < 0.001; Sidak post-hocs: SAL 0 vs. 250 ms p = 0.34, 0 vs. 500 ms: **p = 0.0032, 0 vs 1000 ms *p = 0.0464, CNO: all p = 0.8–1.0). K. Normalized spike frequency rate in the SNr in the full laser epoch (ANOVA: stim duration x drug p = 0.16; drug p = 0.99, main effect of stim duration: ***p < 0.001; Sidak post-hoc all mice pooled: 0 ms vs. other durations: all ***p < 0.001). L Same as K calculated in the first 50 ms (ANOVA: stim duration x drug p = 0.47, drug p = 0.96, main effect of stim duration: ***p < 0.001; Sidak post-hoc all mice pooled: 0 ms vs. other durations: all ***p < 0.001). N = 5 GPe;SAL, 5 GPe;CNO, 5 SNr;SAL, 5 SNr;CNO throughout. Exact p-values given in Supplementary Dataset S2. Data are mean ± SEM. See also Supplementary Figs. S6, S7. Source data are provided as a Source Data file.
Fig. 7
Fig. 7. dSPN bridging collaterals in the GPe support motor function as revealed with optogenetic inhibition.
A Strategy for optogenetic inhibition of direct pathway striatal projection neuron (dSPN) terminals in the globus pallidus externus (GPe) using the inhibitory opsin eOPN3. dStr: dorsal striatum. B Left: eOPN3-mScarlet (red) colocalizes with the presynapse marker VGAT (blue) in the GPe, appearing pink (white arrows). Right: Optic fibers target dSPN eOPN3-mScarlet+ terminals in the GPe. C Left: Optogenetic inhibition during rotarod trials at accelerating speed. Middle: Optogenetic inhibition of dSPN GPe terminals reduces latency to fall. Right: Summary data showing significance (ANOVA: Virus x Laser p < 0.01; post-hoc: on vs off: eOPN3 *p < 0.05, GFP p = 0.10). Mice were only allowed to fall once. N = 10 eOPN3, 9 GFP. D Left: Optogenetic inhibition triggered in a closed-loop during ongoing locomotion (see Methods). ITI intertrial interval. Body part positions obtained with DeepLabCut. Middle: Optogenetic inhibition (30 s) of dSPN GPe terminals reduces mouse speed, which recovers after 6 min (consistent with). Right: Summary data showing significant reductions in mouse speed in the stimulation (stim) epoch (green) vs. the 30 s preceding (pre-stim, black), but only when the laser was turned on (vs. off) (ANOVA: Virus x Laser x Epoch p < 0.05; Sidak post-hoc: on vs off in the post-epoch: eOPN3 **p < 0.01, GFP p = 0.96), N = 8 eOPN3, 9 GFP. E Left: Heatmaps showing behavioral classification of videoframes (all mice) into locomotion (body center speed >4.5 cm/s), motionless (speed of all body parts ≤0.8 cm/s) or other non-locomotor movements (does not fulfil locomotion or motionless criteria). Non-locomotor movements include but are not restricted to head movements, rearing, grooming and other fine movements. Note the mild locomotion increase 5 s before laser onset (dashed line) due to the closed-loop. Right: %frames in each motor classification, showing decreased locomotion and increased non-locomotor movements during dSPN GPe inhibition, N = 8 eOPN3, 9 GFP. F dSPN GPe inhibition significantly (Mixed ANOVA: virus x epoch x motor-classification: p < 0.001) reduces %time spent locomoting (Sidak post-hocs: eOPN3 ***p < 0.001, GFP p = 0.99) and increases %time spent in non-locomotor movements (Sidak post-hocs: eOPN3 ***p < 0.001, GFP p = 0.61), N = 8 eOPN3, 9 GFP. Data are mean ± SEM. Exact p-values given in Supplementary Dataset S2. See also Supplementary Fig. S8. Source data are provided as a Source Data file.
Fig. 8
Fig. 8. dSPN axons inhibit ongoing motor-related calcium dynamics in their GPe Npas1 target neurons.
A Left: Optogenetic stimulation of direct pathway striatal projection neuron (dSPN) axons in the globus pallidus externus (GPe) using the opsin ChrimsonR; simultaneous recording of Npas1 activity using the calcium indicator GCaMP6s. dStr dorsal striatum. Right: All-optical setup. B ChrimsonR-TdTomato+ dSPN terminals in the GPe (red) apposed to (white arrows) GCaMP6s+Npas1 somas (cyan). Optic fibers in the same region. Representative from N = 6 mice. C Opto-stimulation is triggered in a closed-loop when Npas1 dFF surpasses a defined threshold (see Methods). D 10 s, 20 Hz stimulation of dSPN GPe axons leads to a power-dependent reduction in Npas1 activity. Left: Average traces, Middle: Heatmaps of all trials, Right: Amplitude change in Npas1 dFF in the opto-window (ANOVA: virus x power p < 0.001; Sidak post-hoc: Chrimson **p < 0.01, ***<0.001, mCherry p > 0.8). E As expected: no effect of unilateral stimulation on mouse speed (ANOVA: power p = 0.50). F 10 s, 2 mW stimulation of dSPN GPe axons leads to a frequency-dependent reduction in Npas1 activity. Left: Average traces, Middle: Heatmaps of all trials, Right: Amplitude change in Npas1 dFF in the opto-window (ANOVA: virus x power p < 0.01; Sidak post-hocs: Chrimson: 0 vs 20 Hz *p < 0.05, 0 vs 10 Hz p = 0.99, mCherry p = 0.28 and 0.51). G No effect of stimulation on mouse speed (ANOVA: power p = 0.56). H Opto-stimulation triggered in a closed-loop during ongoing locomotion when mouse speed reaches a defined threshold (see Methods). I As expected, mouse speed increases before the opto-trigger (baseline vs. threshold (thresh) and stim periods), but is not affected by opto-stimulation (0 vs. 0.2 mW) (ANOVA: epoch p < 0.001, epoch x LED p = 0.79; Sidak post-hocs all ***p < 0.001). J 5 s, 20 Hz stimulation of dSPN GPe axons at ultra-low power (0.2 mW) reduces motor-related Npas1 activity. Left: Average and summary data showing a significant increase in dFF before the opto-trigger (ANOVA: epoch p < 0.05). Middle: Heatmaps of all trials, Right: Amplitude change in Npas1 dFF in the opto-window (ANOVA: virus x LED p < 0.01; Sidak post-hocs: Chrimson **p < 0.01, mCherry p = 0.84). Heatmaps: straight/dashed line = LED onset/offset. N = 5 mCherry, N = 6 ChrimsonR throughout. Data are mean ± SEM. Exact p-values are given in Supplementary Dataset S2. See also Supplementary Fig. S9. Source data are provided as a Source Data file.
Fig. 9
Fig. 9. GPe Npas1 but not ChAT neurons mediate the effects of bridging collaterals on motor function.
A Optogenetic stimulation of globus pallidus externus (GPe) Npas1+ neurons using the optogenetic activator ChR2 B Optic fibers target Npas1 ChR2-YFP+ neurons in the GPe. C Left: 10 trials optogenetic stimulation during open field locomotion. Right: 20 Hz stimulation of Npas1 neurons significantly reduces mouse speed (ANOVA: virus x epoch p < 0.01; Sidak post-hocs ChR2 **p < 0.01, ***<0.001, GFP p > 0.9), N = 12 ChR2, 13 YFP. D Left: Optogenetic stimulation (20 Hz) during rotarod trials at accelerating speed. Right: Stimulation of Npas1 neurons significantly reduces latency to fall (ANOVA: virus x laser p < 0.05; Sidak post-hocs: ChR2 **p < 0.01, GFP p = 0.97), N = 8 ChR2, 9 YFP. E Optogenetic stimulation of GPe choline acetyltransferase (ChAT)+ cholinergic neurons. F Optic fibers target ChAT ChR2-YFP+ neurons in the caudal GPe. G Neither 10 Hz (ANOVA: virus x epoch p = 0.11) or 20 Hz (p = 0.06) ChAT stimulation affects mouse speed, N = 8 ChR2, 8 YFP. H 20 Hz stimulation of ChAT neurons does not affect latency to fall in the rotarod (ANOVA: virus x laser p = 0.63), N = 8 ChR2, 8 YFP. Data are mean ± SEM. Exact p-values are given in Supplementary Dataset S2. Source data are provided as a Source Data file.

Update of

Similar articles

Cited by

References

    1. Gerfen CR, Surmeier DJ. Modulation of striatal projection systems by dopamine. Annu. Rev. Neurosci. 2011;34:441–466. - PMC - PubMed
    1. Cox J, Witten IB. Striatal circuits for reward learning and decision-making. Nat. Rev. Neurosci. 2019;20:482–494. - PMC - PubMed
    1. Klaus A, Alves da Silva J, Costa RM. What, if, and when to move: basal ganglia circuits and self-paced action initiation. Annu. Rev. Neurosci. 2019;42:459–483. - PubMed
    1. Xiao X, et al. A genetically defined compartmentalized striatal direct pathway for negative reinforcement. Cell. 2020;183:211–227.e20. - PMC - PubMed
    1. Lee J, Sabatini BL. Striatal indirect pathway mediates exploration via collicular competition. Nature. 2021;599:645–649. - PMC - PubMed

Publication types

MeSH terms

Substances

LinkOut - more resources