. 2023 Oct 23;14(1):6700.
doi: 10.1038/s41467-023-42474-1.

Phase separation of BuGZ regulates gut regeneration and aging through interaction with m6A regulators

Affiliations

Phase separation of BuGZ regulates gut regeneration and aging through interaction with m6A regulators

Qiaoqiao Zhang et al. Nat Commun. .

Abstract

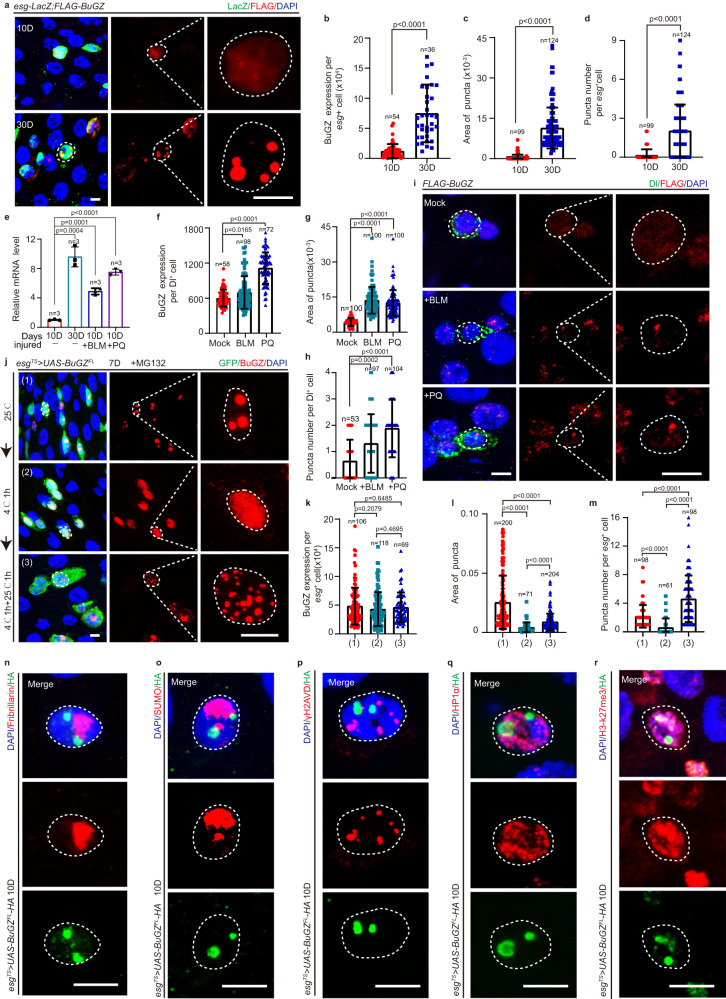
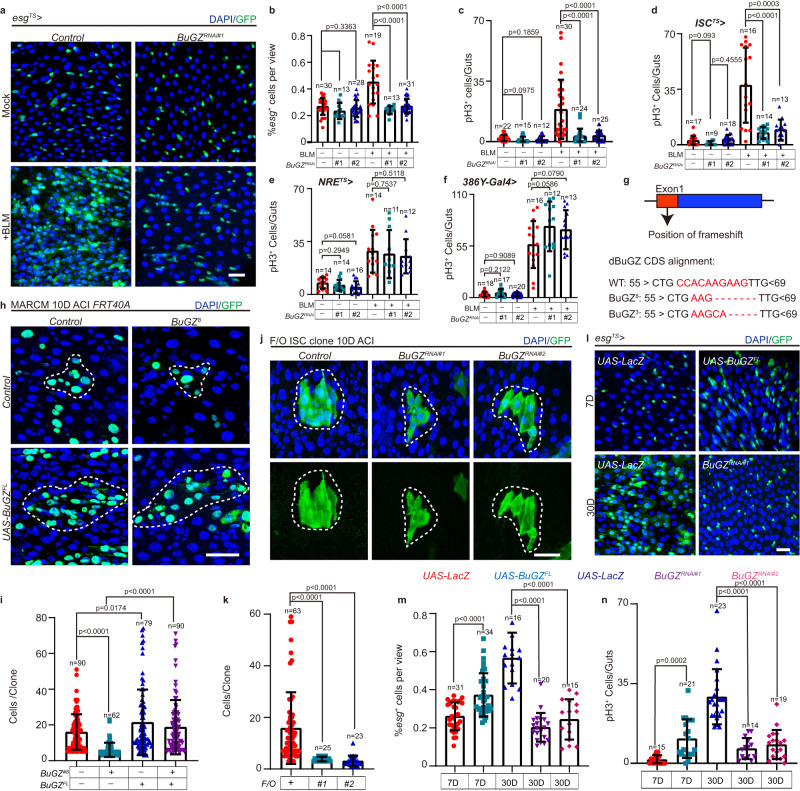
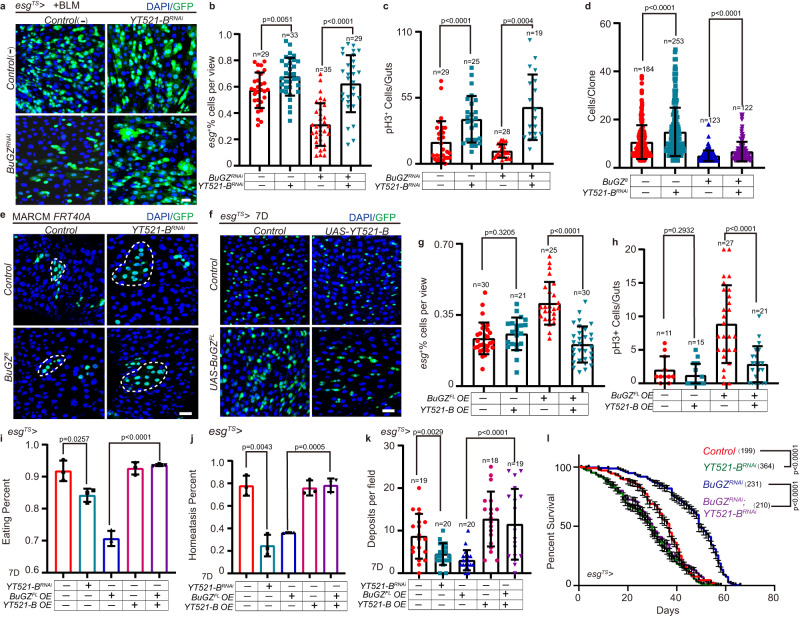
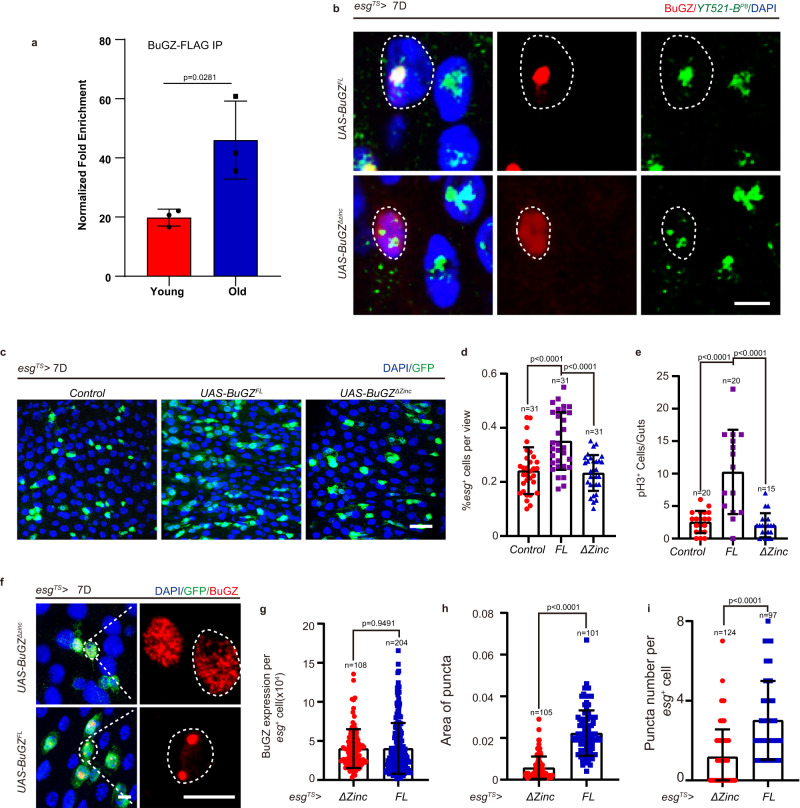
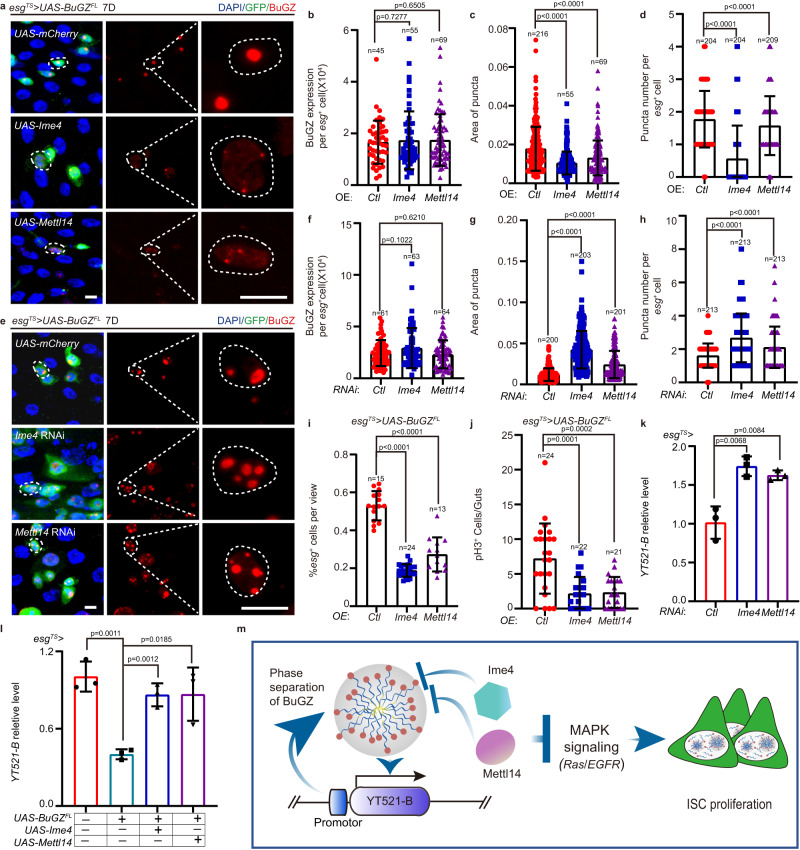
Exploring the role of phase separation in intracellular compartment formation is an active area of research. However, the associations of phase separation with intestinal stem cell (ISC)-dependent regeneration and aging remain unclear. Here, we demonstrate that BuGZ, a coacervating mitotic effector, shows age- and injury-associated condensation in Drosophila ISC nuclei during interphase. BuGZ condensation promotes ISC proliferation, affecting Drosophila gut repair and longevity. Moreover, m6A reader YT521-B acts as the transcriptional and functional downstream of BuGZ. The binding of YT521-B promotor or m6A writer Ime4/ Mettl14 to BuGZ controls its coacervation, indicating that the promotor may accelerate the phase transition of its binding transcription factor. Hence, we propose that phase separation and m6A regulators may be critical for ameliorating ISC-dependent gut regeneration and aging and requires further study.


Conflict of interest statement

The authors declare no competing interests.

Figures

Fig. 1
Fig. 1. BuGZ forms condensation puncta in ISCs during aging and after injury.
ad BuGZ forms puncta in esg+ cells during aging. Image of endogenous BuGZ (red) in esg+ cells (a). LacZ indicates esg+ cells (ISCs and EBs, green), nucleus is labeled by DAPI (blue). Fluorescence intensity of BuGZ (b). Area (c), number (d) of BuGZ puncta. Each dot corresponded to one esg+/BuGZ+ cell and DAPI is used to calculate the area of the nucleus (b, 10D: 54 cells; 30D:36 cells). If the puncta area is bigger than 0.001 pixels, the puncta area is calculated. Otherwise, the area is calculated as zero (c, 10D: 99 area; 30D 124 area). d 10D: 99 cells; 30D: 124 cells. e BuGZ mRNA level increases in old and BLM/PQ-injured esg+ cells (n = 3 biologically independent experiments). fi BuGZ forms puncta in BLM-/PQ-injured ISCs. Images of injured BuGZ puncta (i). Dl (Delta) labeled ISCs (i). Fluorescence intensity (f), area (g), number (h) of BuGZ or BuGZ puncta. (f, Mock: 58 cells; BLM: 98 cells; PQ: 72 cells. g, 100 areas. h, Mock: 53 cells; BLM: 97 cells; PQ: 104 cells). jm BuGZ undergoes concentration- or temperature-dependent phase separation. Image of BuGZ puncta (j). BuGZ is labeled by BuGZ antibody (red), GFP indicates esg+ cells (green). Quantification of the fluorescence intensity (k), area (l), number (m) of BuGZ or BuGZ puncta. (k, upper: 106 cells; middle: 118 cells; below: 69 cells. l, upper: 200 areas; middle: 71 areas; below: 204 areas. m, upper: 98 cells; middle: 61 cells; below: 98 cells). nr Puncta of BuGZ does not co-locate with nucleolus marked with Fribrillin (n), PML body marked with SUMO (o), γH2AVD labeled DNA repair foci (p), HP1α labeled heterochromatin (q), but partially co-locate with chromatin marked with H3K27me3 (r). The experiments were independently repeated three times, yielding similar results. Scale bars represent 5 μm. Bars are mean ± SD. P-values were calculated by two-tailed, unpaired Student’s t-test. Source data are provided as a Source Data file.
Fig. 2
Fig. 2. BuGZ regulates activation of ISC proliferation after gut injury and during aging.
ac BuGZ controls ISC proliferation after gut injury. Images of esg+ cells in control (UAS-LacZ), BuGZRNAi#1 (BDSC:27996), BuGZRNAi#2 (VDRC: v104498) midguts (a). Ratio of esg+ cells to DAPI cells (b, from left to right are 30, 13, 28, 19, 13, 31 views). pH3+ cells per midguts (c, from left to right are 22, 15, 12, 30, 24, 25 guts). GFP indicates esg+ cells (green). df BuGZ mediates ISC proliferation after injury by performing cell-autonomous functions. pH3+ cells per young (7D) or injured midguts under ISCTS (d), NRETS (e), 386Y-gal4 (f). (d: from left to right are 17, 9, 18, 16, 14, 13 guts; e: from left to right are 14, 14, 16, 14, 11, 12 guts; f: from left to right are 18, 17, 20, 16, 12, 13 guts). g Model of mutually independent BuGZ-null allele. h, i BuGZ depletion suppresses ISC proliferation after clone induction. Images of MARCM clones (h, green, outlined by white dotted lines). Number of cells per clone (i, from left to right are 90, 62, 79, 90 clones). GFP indicates ISCs (green). j, k Flip-out(F/O) lineage-tracing clone system is used to mark ISCs and their newborn progenies. Images of F/O clones (j). Number of cells per clone (k, from left to right are 63, 25, 23 clones). GFP indicates ISCs (green). ln BuGZ elevation leads to an increase ISC proliferation upon aging. Images of midguts with esg+ staining (l). GFP indicates esg+ cells (green). Ratio of esg+ cells to DAPI cells (m, from left to right are 31, 34, 16, 20, 15 views). Number of pH3+ cells per midgut (n, from left to right are 15, 21, 23, 14, 19 views). DAPI stained nuclei (blue). Scale bars represent 25 μm. View size is 3.4 × 104 μM2. Bars are mean ± SD. P-values were calculated by two-tailed, unpaired Student’s t-test. Source data are provided as a Source Data file.
Fig. 3
Fig. 3. LLPS of BuGZ regulates ISC proliferation.
a Model of BuGZ mutants (BuGZ13S, BuGZC, and BuGZCS). bg ISC proliferation is controlled by BuGZ coacervation. Images of midguts with esg+/BuGZ+ staining (b). BuGZ is indicated by the BuGZ antibody. GFP indicates esg+ cells (green). Fluorescence intensity (c), area (d), number (e) of BuGZ puncta. (c, UAS-BuGZFL, UAS-BuGZ13S: 51, 79 cells. d, UAS-BuGZFL, UAS-BuGZ13S: 200, 208 cells. e, UAS-BuGZFL, UAS-BuGZ13S: 53, 52 cells). Ratio of esg+ to DAPI cells (f, UAS-BuGZFL, UAS-BuGZ13S: 26, 40 views). pH3+ numbers per midgut (g, UAS-BuGZFL, UAS-BuGZ13S: 17, 29 guts). h, i LLPS of BuGZ is essential for ISC proliferation. Images of MARCM clones (i). Cell numbers per clone (h from left to right: 83, 37, 244, 53, 34, 136 clones). GFP indicates ISCs (green). jl BuGZ phase separation regulates ISC proliferation upon gut injury. Images of esg+ cells (j). Ratio of esg+ to DAPI cells (k, from left to right: 30, 25, 24, 30, 24, 32 views). pH3+ numbers per midgut (l, from left to right: 30, 33, 27, 28, 26, 29 guts). GFP indicates esg+ cells (green). m Overexpression of BuGZC inhibited the LLPS of BuGZ during gut repair, while BuGZC exhibited more effective influence than BuGZCS on suppressing BuGZ condensate. Dl labels ISCs. White arrow indicates puncta. Experiments were independently repeated three times. nr Truncated IDR peptide BuGZC instead of BuGZCS inhibits ISC proliferation by disrupting LLPS of BuGZ. Images of midguts with esg+/BuGZ+ staining. BuGZ is indicated by BuGZ antibody (n). GFP indicates esg+ cells (green). Quantification of the area (o), number (p) of BuGZ puncta (o, from left to right: 200, 209, 288 areas. p, from left to right: 206, 223, 223 cells). Ratio of esg+ to DAPI cells. (q, from left to right: 18, 34, 29 views). pH3+ numbers per midgut (r, 20, 40, 40 guts). Scale bars represent 5 μm (b, n), 10 μm (m), 25 μm (i, j). View size is 3.4 × 104 μM2. Bars are mean ± SD. P-values were calculated by two-tailed, unpaired Student’s t-test. Source data are provided as a Source Data file.
Fig. 4
Fig. 4. BuGZ facilitates Drosophila ISC proliferation via m6A reader YT521-B.
ac Expression of YT521-BRNAi promotes the proliferation of ISCs and rescues the defect of ISCs proliferation caused by BuGZ depletion after injury in esg+ cells. Immunofluorescence images of esg+ cells (a). Ratio of esg+ cells to DAPI cells (b, from left to right are 29, 33, 35, 29 views). Number of pH3+ cells per midgut (c, from left to right are 29, 25, 28, 19 guts). GFP indicates esg+ cells (green). Bars are mean ± SD, Two-tailed unpaired Student’s t-test. d, e Immunofluorescence images of MARCM clones (green, outlined by white dotted lines) (d). Cell numbers per clone (e, from left to right are 184, 253, 123, 122 clones, bars are mean ± SD, Two-tailed unpaired Student’s t-test.). GFP indicates ISCs (green). fh Overexpression of YT521-B significantly restrains the hyperproliferation of ISCs caused by BuGZFL-overexpressing. Representative images of esg+ cells (f). Ratio of esg+ cells to DAPI cells (g, from left to right are 30, 21, 25, 30 views). Number of pH3+ cells per midgut (h, from left to right are 11, 15, 27, 21 guts). GFP indicates esg+ cells (green). Bars are mean ± SD, Two-tailed unpaired Student’s t-test. i Percentage of the ratio of flies of eating to each indicated genotypes of young (7D) flies. Error bars show the SD of three independent experiments. Two-tailed unpaired Student’s t-test. j Percentage of the intestinal homeostasis categories from flies with indicated genotypes. Error bars show the SD of three independent experiments. Two-tailed unpaired Student’s t-test. k Excretion of Drosophila treated with Bromophenol blue from young (7D) flies with indicated genotypes. Tests were repeated as three independent experiments. Two-tailed unpaired Student’s t-test. l Percentage of survival of adults under esgTS. (Control: n = 199 flies; YT521-BRNAi: n = 364 flies; BuGZRNAi: n = 231 flies; BuGZRNAi; YT521-BRNAi: n = 210 flies). Tests were repeated as three independent experiments. Statistical significance among genotypes was calculated with a chi-square log-rank test. Scale bars represent 25 μm. The area of the view size is 3.4 × 104 μM2. Source data are provided as a Source Data file.
Fig. 5
Fig. 5. The binding of YT521-B promotor to BuGZ accelerates its coacervation to control the proliferation of ISCs.
a The interaction between BuGZ and P8 fragment by Chip-qPCR in the young or old guts of transgenic BuGZ-FLAG fly. The results demonstrated that the interaction between BuGZ and P8 was enhanced upon aging. b The in situ hybridization assay shows that, compared with BuGZΔZinc, BuGZFL protein exerted stronger behavior of condensation co-located with the DNA fragment P8. The experiments were independently repeated three times, yielding similar results. ce BuGZΔzinc does not affect the proliferation of ISCs. Immunofluorescence images of control (UAS-LacZ), BuGZFL-HA overexpressing, BuGZΔzinc-HA overexpressing esg+ cells (c). Ratio of esg+ cells to DAPI cells (d, 31 views). Number of pH3+ cells per midguts (e, Control: n = 20 guts; UAS-BuGZFL: n = 20 guts; UAS-BuGZΔzinc: n = 15 guts). GFP indicates esg+ cells (green). fh Overexpression of BuGZΔzinc shows smaller puncta than BuGZFL-overexpressing in esg+ cells. BuGZ foci (red, outlined by white dotted lines) is labeled by BuGZ antibody (f). Quantification of the fluorescence intensity (g), area (h), number (i) of BuGZ puncta. (g, UAS-BuGZΔzinc: n = 108 guts; UAS-BuGZFL: n = 204 cells. h, UAS-BuGZΔzinc: n = 105 areas; UAS-BuGZFL: n = 101 areas. i, UAS-BuGZΔzinc: n = 124 cells; UAS-BuGZFL: n = 97 cells). GFP indicates esg+ cells (green). DAPI stained nuclei (blue). Scale bars represent 5 μm (b, c), 25 μm (f). The area of the view size is 3.4 × 104 μM2. Bars are mean ± SD. P-values were calculated by two-tailed, unpaired Student’s t-test. Source data are provided as a Source Data file.
Fig. 6
Fig. 6. Ime4 and Mettl14 suppress ISC proliferation by inhibiting LLPS of BuGZ.
ac BuGZ foci is inhibited by Ime4 or Mettl14 overexpression. Images of esg+ cells (a). BuGZ foci labeled by BuGZ antibody. Fluorescence intensity (b), size (c), number (d) of BuGZ puncta. (b, from left to right are 45 cells, 55 cells, 69 cells. c, from left to right are 216, 55, 69 cells. d, from left to right are 204, 204, 209 cells). GFP indicates esg+ cells (green). eh LLPS of BuGZ is promoted by Ime4 or Mettl14 depletion. Images of esg+ cells (e). BuGZ foci are labeled by BuGZ antibody. Fluorescence intensity (f), size (g), number (h) of BuGZ puncta (f, from left to right are 61, 63, 64 cells. g, from left to right are 200, 203, 201 puncta. h, from left to right are 213, 213, 213 cells). GFP indicates esg+ cells (green). i, j Hyperproliferation of ISCs caused by BuGZFL overexpression is inhibited by overexpressing Ime4 and Mettl14 (h). Ratio of esg+ cells to DAPI cells (i, from left to right are 15, 24, 13 views). Number of pH3+ cells per midgut (j, from left to right are 24, 22, 21 guts). k Ime4/Mettl14 depletion results in elevated YT521-B mRNA levels in sorted esg+ cells (n = 3 biologically independent experiments). l Ime4 or Mettl14 overexpressing rescues YT521-B transcription suppression caused by BuGZ overexpression in sorted esg+ cells (n = 3 biologically independent experiments). m Model of mechanism: how BuGZ modulates ISC proliferation. LLPS of BuGZ inhibits YT521-B transcription to promote ISC proliferation by MAPK pathway. Additionally, both Ime4 and Mettl14 regulate YT521-B transcription by inhibiting BuGZ phase separation in ISCs, while in turn the promotor of YT521-B promotes the LLPS of BuGZ.DAPI stained nuclei (blue). Scale bars represent 5 μm. Bars are mean ± SD. P-values were calculated by two-tailed, unpaired Student’s t-test. Source data are provided as a Source Data file.

Similar articles

Cited by

References

    1. Brangwynne CP, et al. Germline P granules are liquid droplets that localize by controlled dissolution/condensation. Science. 2009;324:1729–1732. doi: 10.1126/science.1172046. - DOI - PubMed
    1. Shin Y, Brangwynne CP. Liquid phase condensation in cell physiology and disease. Science. 2017;357:eaaf4382. doi: 10.1126/science.aaf4382. - DOI - PubMed
    1. Riback JA, et al. Composition-dependent thermodynamics of intracellular phase separation. Nature. 2020;581:209–214. doi: 10.1038/s41586-020-2256-2. - DOI - PMC - PubMed
    1. Banani SF, Lee HO, Hyman AA, Rosen MK. Biomolecular condensates: organizers of cellular biochemistry. Nat. Rev. Mol. Cell Biol. 2017;18:285–298. doi: 10.1038/nrm.2017.7. - DOI - PMC - PubMed
    1. Alberti S, Gladfelter A, Mittag T. Considerations and challenges in studying liquid-liquid phase separation and biomolecular condensates. Cell. 2019;176:419–434. doi: 10.1016/j.cell.2018.12.035. - DOI - PMC - PubMed

Publication types

Substances

LinkOut - more resources