. 2023 Oct 23;14(1):6692.
doi: 10.1038/s41467-023-42402-3.

Dual targeted extracellular vesicles regulate oncogenic genes in advanced pancreatic cancer

Affiliations

Dual targeted extracellular vesicles regulate oncogenic genes in advanced pancreatic cancer

Chi-Ling Chiang et al. Nat Commun. .

Abstract

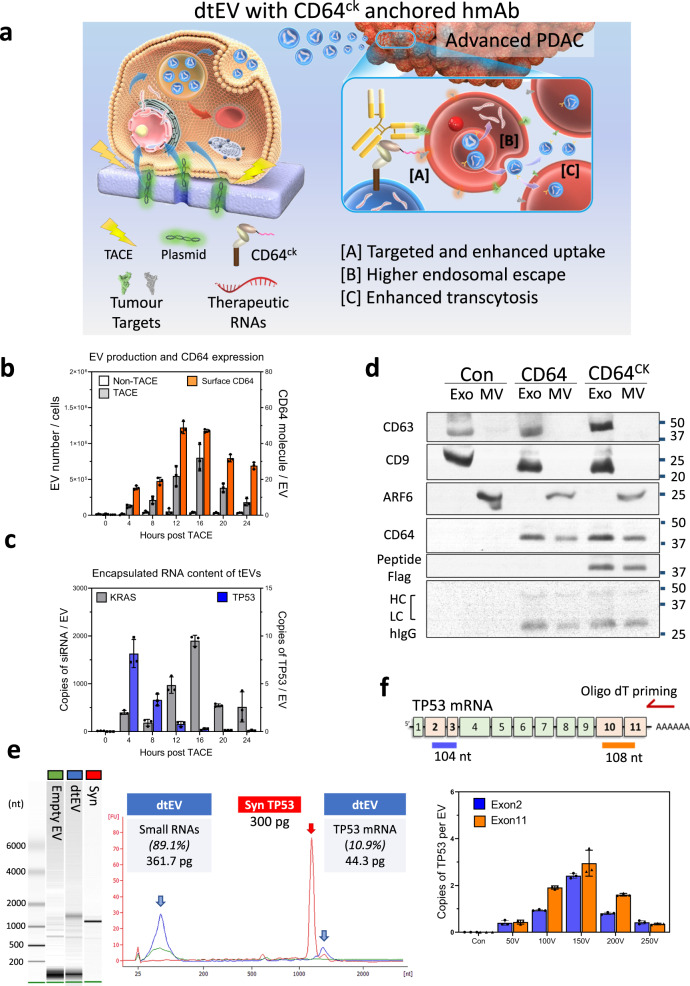
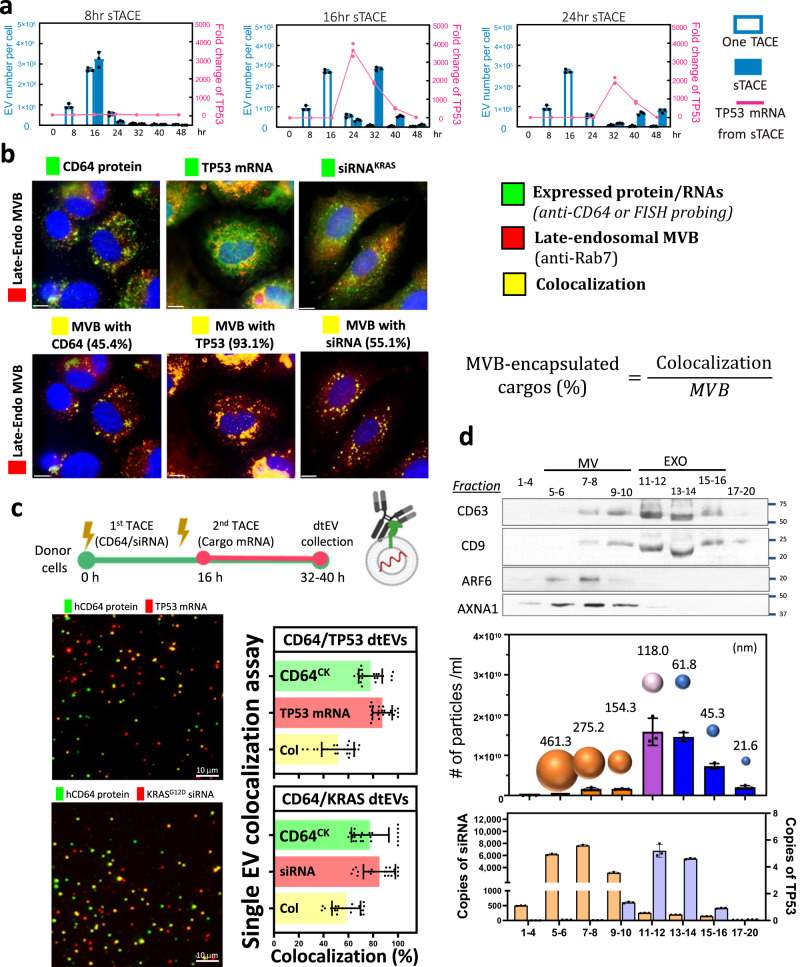
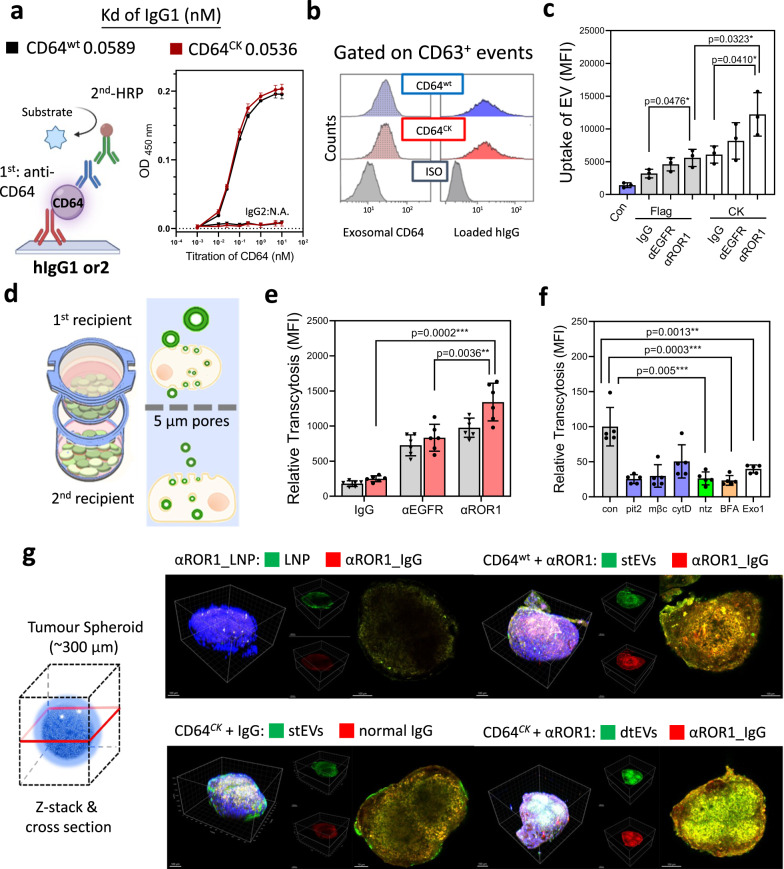
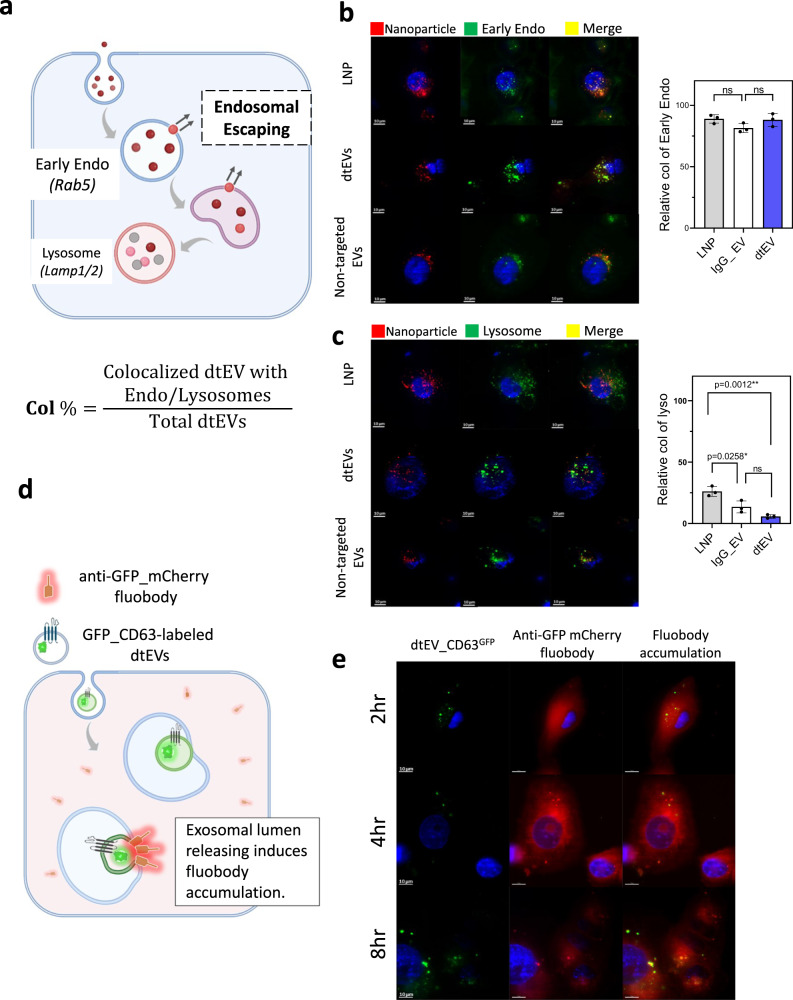
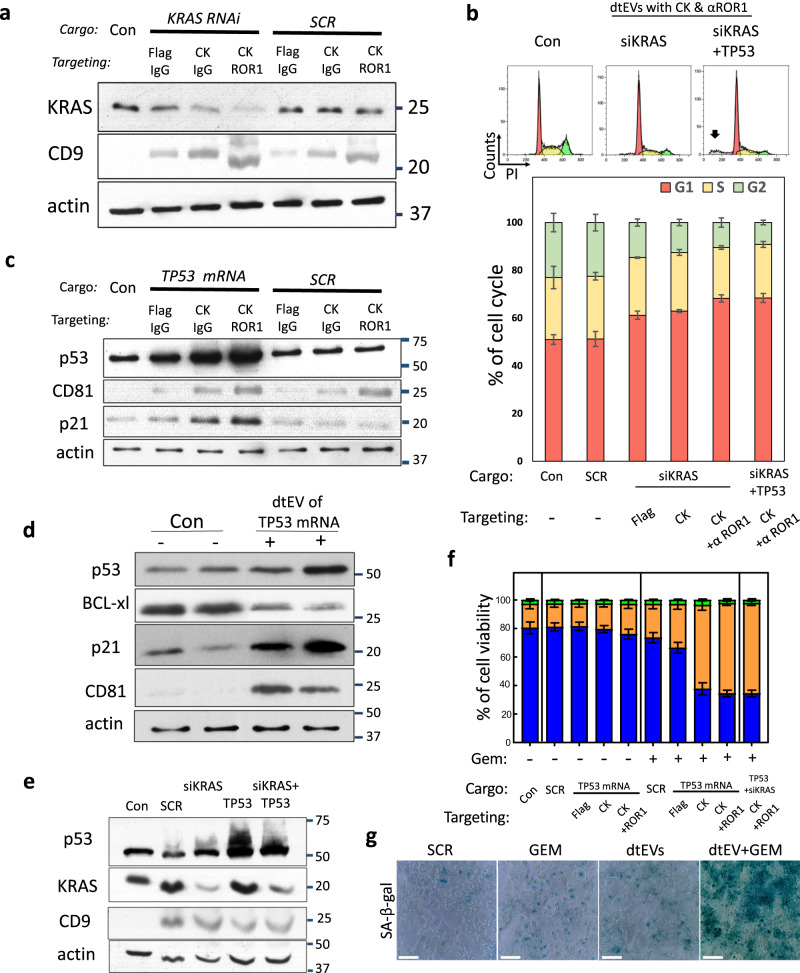
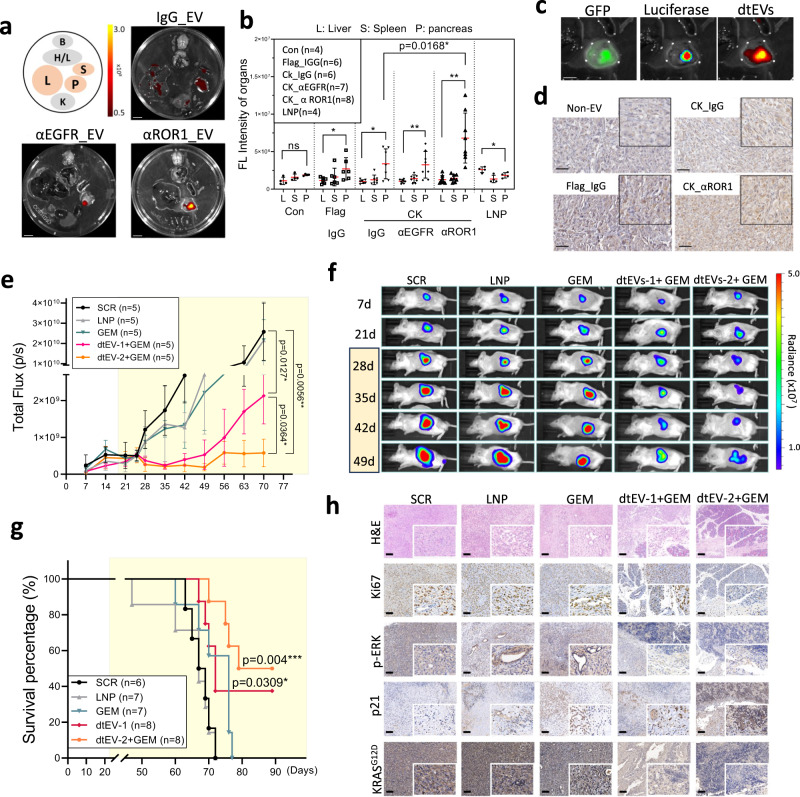
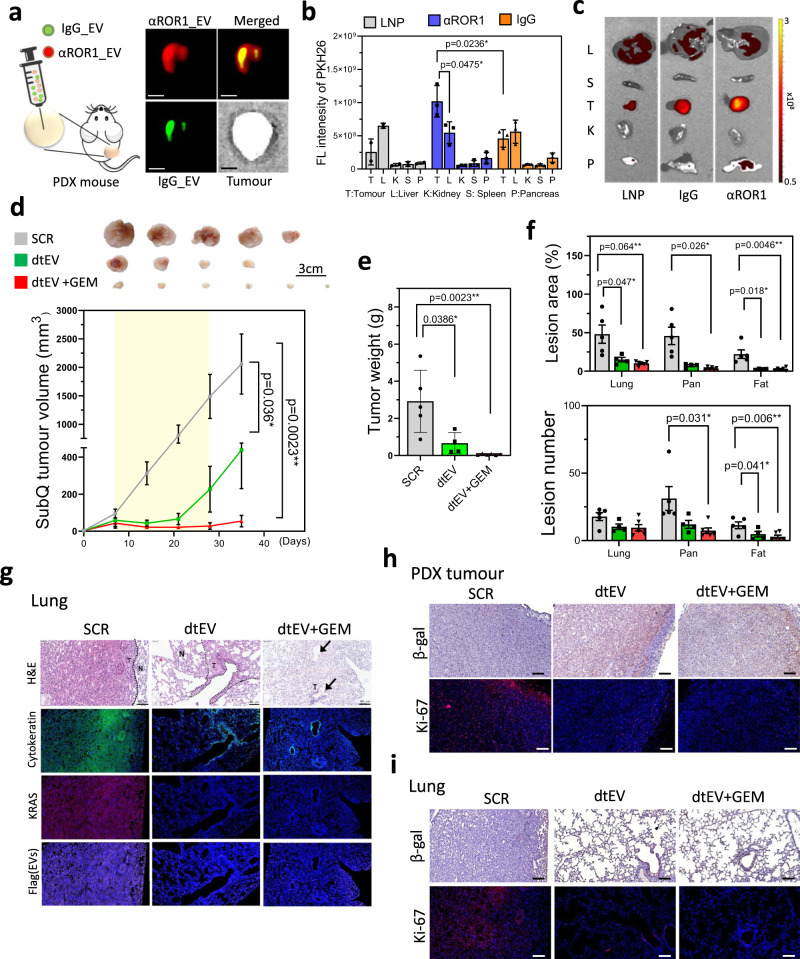
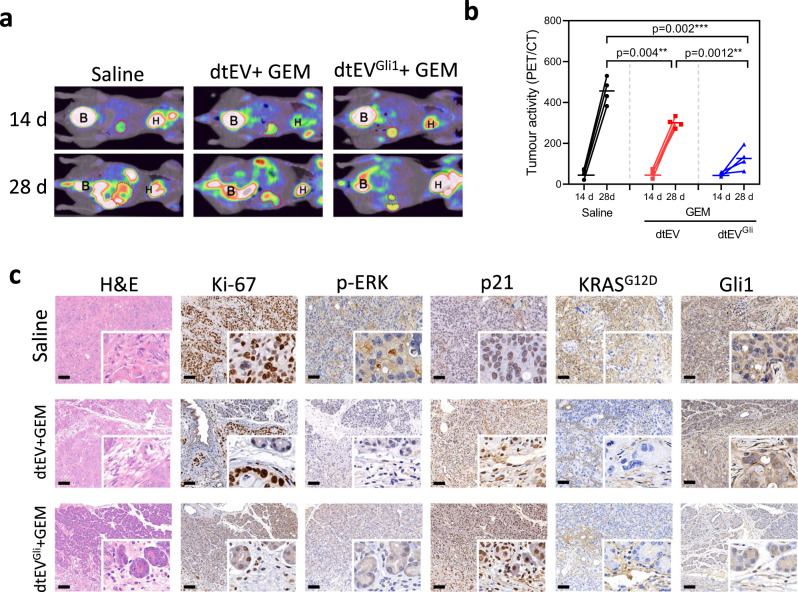
Pancreatic ductal adenocarcinoma (PDAC) tumours carry multiple gene mutations and respond poorly to treatments. There is currently an unmet need for drug carriers that can deliver multiple gene cargoes to target high solid tumour burden like PDAC. Here, we report a dual targeted extracellular vesicle (dtEV) carrying high loads of therapeutic RNA that effectively suppresses large PDAC tumours in mice. The EV surface contains a CD64 protein that has a tissue targeting peptide and a humanized monoclonal antibody. Cells sequentially transfected with plasmid DNAs encoding for the RNA and protein of interest by Transwell®-based asymmetric cell electroporation release abundant targeted EVs with high RNA loading. Together with a low dose chemotherapy drug, Gemcitabine, dtEVs suppress large orthotopic PANC-1 and patient derived xenograft tumours and metastasis in mice and extended animal survival. Our work presents a clinically accessible and scalable way to produce abundant EVs for delivering multiple gene cargoes to large solid tumours.


Conflict of interest statement

L.J.L. and A.S.L. are shareholders at Spot Biosystems Ltd. All other co-authors declare no competing interests.

Figures

Fig. 1
Fig. 1. Production and characterization of dtEVs.
a Donor cells on the Transwell® insert are transfected with plasmid DNA from below the insert through high-electric field strength in Transwell® pores (1 μm). Cargo RNAs transcribed from the plasmids reside inside intraluminal vesicles (ILVs) within multivesicular bodies (MVBs). TACE promotes the secretion of dtEVs containing therapeutic RNAs and CD64ck protein. Clinically available humanized monoclonal antibody (hmAb) anchors on CD64ck as the second targeting ligand. The hmAb and CK peptide dual targeted EVs (dtEVs) provide [A] specific tumor targeting and affinity-enhanced cancer cell uptake (better endocytosis), [B] improved cytosol release of therapeutic RNAs (higher endosome escape), and [C] superior tissue penetration (stronger transcytosis) by CD64ck/hmAb interactions with receptors on the cancer cell membrane. b MEFs electroporated at 150 V by TACE secreted >30-fold EVs than untreated native MEFs. EV secretion peaked at ~16 h was synchronized with CD64ck expression on dtEVs surface (27.6 ± 1.9 molecules/EV on average for >24 h, n = 3 biological independent experiments). c, TP53 mRNA expression in EVs peaked within 4 h (8.2 ± 1.5 copies/EV, n = 3 biological independent experiments) while siKRASG12D expression peaked much later at 16 h (1,899.9 ± 114.5 copies/EV, n = 3 biological independent experiments). d EVs with CD64wt or CD64ck harvested from donor cells were preloaded with human IgGs and pulled down for Western blotting. Captured human IgG was on exosomes (Exo) and microvesicles (MV). Con: untreated MEFs. e Bioanalyzer electrophoresis with a synthetic TP53 mRNA reference confirmed the integrity and quantity of TP53 mRNA in dtEVs. The mass ratio of small RNAs vs. mRNA in dtEVs was ~9:1. f The integrity of vesicular TP53 mRNA was also confirmed by oligo-dT primed qPCR from the two edges of transcript as the 5′ end (exons 2 and 3, blue) and 3’ end (exons 10 and 11, orange) (n = 3 biological independent experiments). Data were presented as mean ± SD. Source data are provided as a Source data file. d, e Electrophoresis and western blot images are representative of three independent experiments.
Fig. 2
Fig. 2. Sequential TACE (sTACE) for dtEV production and its RNA cargo loading.
a The sTACE was performed by delivering the CD64 plasmid first and then the TP53 plasmid DNA with a time gap of 8 h, 16 h, or 24 h in MEF cells. The optimized sTACE with 16 h gap gave the best coordination of surface CD64ck protein, TP53 mRNA loading, and EV number for our the dtEV formulation (n = 3 biological independent experiments). b Expressed CD64 protein was stained by florescence-labeled anti-CD64 antibodies, and RNA cargoes were recognized by FISH (fluorescence in situ hybridization) probes (green). The late-endosomal MVBs were stained by florescence-labeled anti-Rab7 (red). Through the proportion of colocalized versus total fluorescent signal, we estimated that ~45% MVBs contained CD64ck protein and ~93% MVBs contained TP53 mRNA at 4 h, while ~55% MVBs contained siKRASG12D at 12 h after TACE. Immunofluorescent images are representative of n = 3 biologically independent experiments. c TIRF fluorescence imaging of single dtEV shows ~55% of dtEVs co-expressed surface CD64ck and TP53 mRNA or siKRASG12D cargoes when CD64ck plasmid was delivered 16 h apart from TP53 plasmid or simultaneously with siKRAS plasmid. The colocalization ratio is 58.5 ± 2.4% for siKRAS and 51.6 ± 2.8% for TP53 mRNA (n = 3 biological independent experiments, 7 or 8 images each). d Harvested EVs from TACE stimulated MEFs were sorted by size exclusion chromatography (qEV columns, IZON) into 20 fractions in which the EV number, averaged EV size, surface protein markers, and loaded RNA/protein cargo in each fraction were characterized. By real-time PCR analysis for RNA cargoes from each fraction, TP53 mRNA was located mainly in exosomal fractions (11-14; high CD63/CD9 expression), while siKRASG12D was found in both exosomes and microvesicles (n = 3 biological independent experiments). Scale bars in b and c are 10 μm. Data were presented as mean ± SD. Source data are provided as a Source data file.
Fig. 3
Fig. 3. Penetration and uptake characteristics of dtEVs in PANC-1 cells.
a Enzyme-linked immunoassay (ELISA) shows both CD64wt (Kd = 0.0589 nM) and CD64ck (Kd = 0.0536 nM) bound to hIgG1, but not hIgG2, with high affinity (n = 3 biological independent experiments). b Flow cytometry analysis using anti-CD63 beads to capture dtEVs confirms surface CD64ck bound to hIgG. c Internalization assay using EVs labeled with fluorescent PKH67 dye shows higher cell uptake of dtEVs loaded with humanized anti-ROR1 mAb (αROR1) than humanized anti-EGFR (αEGFR) or control IgG. Uptake of dtEVs with CK peptides (12,209 ± 1914) doubled that of Flag control (5,585 ± 755.9) (n = 3 biological independent experiments). d Schematic of transcytosis assay used to quantify the entry and exit of various nanocarriers from the top to the bottom cell monolayer separated by a Transwell® insert membrane with 5 μm pores. e CD64ck_ αROR1 dtEVs displayed the greatest putative transcytosis (n = 5 biological independent experiments). f Pre-treating top cells with inhibitors of clathrin- mediated endocytosis (Pitstop 2, Pit2, 10 mM), caveolae- mediated endocytosis (Methyl-β-cyclodextrin, mβC, 10 mM) or exosomal secretion (neticonazole, Ntz, 10 mM) greatly prevented this putative transcytosis, but not inhibitor of macropinocytosis (Cytochalasin D, cytD, 10 µM). Con: no inhibitor (n = 5 biological independent experiments). g dtEVs penetrated tumor spheroids of PANC-1 cells (~300 µm) deeper than stEVs or LNPs after 24 h incubation (blue: DAPI). LNPs and EVs were labeled with PKH67 (green), while anti-hIgG was in red. Immunofluorescent images are representative of n = 3 biologically independent experiments. Scale bar in g: 100 μm. Data were presented as mean ± SD. For cf, the data were analyzed by unpaired two-sided Student’s t test. (*p < 0.05, **p < 0.01, ***p < 0.001, ****p < 0.0001). Source data are provided as a Source data file.
Fig. 4
Fig. 4. Trafficking of dtEVs in recipient cells.
a Nanocarriers labeled with PKH26 (red) were taken up by endocytosis and underwent vesicular trafficking in the recipient cells, from the endosome to the lysosome. b PANC-1 cells were initially treated with fluorescent nanoparticles (red) for 2 h and then fixed for co-staining with anti-Rab5 to visualize the colocalization in early endosome (green). Colocalization in recipient cells showed a similar level for LNPs, non-targeted IgG-EVs and dtEVs (colocalization % (Col%): LNP: 89.0 ± 3.5; non-targeted IgG-EV: 88.17 ± 5.2; dtEV: 81.50 ± 3.7, n = 3 biological independent experiments). c When comparing the colocalization (yellow) of LNPs, dtEVs, and non-targeted IgG-EVs, we observed less colocalization of dtEVs in lysosomes (green) after 8 h incubation (Col%: LNP: 26.17 ± 4.0; non-targeted IgG-EV: 13.53 ± 4.87; dtEV: 5.73 ± 1.45, n = 3 biological independent experiments). d A fluobody recognition system was used to monitor the interaction of dtEV lumens within vesicular trafficking. Recipient cells were pre-transfected with an anti-GFP fluobody tagged with mCherry (red), which is expressed in the cytosol. Upon release of the dtEV lumen, the cytosolic anti-GFP fluobody could recognize CD63GFP on the dtEV lumens, leading to temporary local accumulation. e PANC-1 cells expressing anti-GFP_mCherry fluobody were incubated with dtEVs containing CD63GFP for 2, 4, and 8 h. The induced accumulation of anti-GFP fluobody was observed to increase from 2 to 4 and 8 h, suggesting the potential of lumen releasing of dtEV. Fluorescent images are representative of n = 3 biologically independent experiments. Scale bar in b, c, and e are 10 μm. Data were presented as mean ± SD. For b and c, the data were analyzed by unpaired two-sided Student’s t test. (ns not significant, *p < 0.05, **p < 0.01, ***p < 0.001, ****p < 0.0001). Source data are provided as a Source data file.
Fig. 5
Fig. 5. In vitro efficacy of dtEVs carrying siKRASGG12D or TP53 mRNA.
a Western blot of PANC-1 cells treated with various dtEVs carrying endogenous siKRASG12D or scramble siRNA (SCR) for 24 h shows silenced KRASG12D expression. b Flow cytometry histogram of DNA distribution in PANC-1 cells treated with CD64ck_αROR1 dtEVs carrying siKRASG12D or 50/50 siKRASG12D/TP53 mRNA. Significant apoptosis (black arrow) is seen with cells treated with dtEVs carrying two cargoes. Lower panel shows percentage of cells at G1, S and G2/M stages of the cell cycle in PANC-1 cells treated with various stEVs (Flag, CK) and dtEVs (CK + αROR1) carrying either siKRASG12D alone or 50/50 siKRASG12D/TP53 mRNA. c Western blot of PANC-1 cells treated with various dtEVs carrying either endogenous TP53 or scramble (SCR) mRNA for 24 h. The p53 and p21 expressions were upregulated in cells treated with dtEVs carrying TP53 mRNA. d Western blot of PANC-1 cells treated with Gemcitabine (GEM) and CD64ck_αROR1 dtEVs carrying endogenous TP53 mRNA for 24 h shows upregulated p53 and p21, and downregulated BCL-xl expressions. e Western blot of PANC-1 cells treated with GEM and CD64ck_αROR1 dtEVs carrying SCR, siKRASG12D, TP53 mRNA, or 50/50 siKRASG12D/TP53 mRNA for 24 h. f Percentage of live, dead and apoptotic (Apop) PANC-1 cells treated with various stEVs (Flag, CK) and dtEVs carrying TP53 mRNA in the presence (+) or absence (−) of GEM. Cells treated with CD64ck_αROR1 dtEVs and GEM led to high cancer cell death. g The treatment of PANC-1 cells with dtEVs, both with and without GEM, elevated oncogene-induced senescence, as evidenced by increased in SA-β-galactosidase activities. Con is EVs from untreated native MEFs. All EVs were delivered at 1 × 106 EVs/cell. All error bars represent s.e.m. over three independent samples. The siRNA sequences are given in Supplementary Table 3. Scale bar in g is 100 μm. a, c, d, e, g Western blots and staining images are representative of three biological independent experiments.
Fig. 6
Fig. 6. Targeting and therapeutic efficacy of dtEVs in mice bearing orthotopic PANC-1 tumors.
a Organ imaging shows preferential accumulation of PKH26-labeled dtEVs in orthotopic PANC-1 tumors in NOD/SCID mice [B: brain; H/L: heart and lungs; L: liver; S: spleen; P: pancreas; K: kidneys, scale bar: 10 mm]. b Tissue distribution analysis reveals PKH26-labeled dtEVs accumulate preferentially in the pancreas, with the highest accumulation seen using CD64ck_αROR1 dtEV. c Co-localization of fluorescence signal from luciferase/GFP transfected PANC-1 and PKH26-labeled EVs confirms high dtEV accumulation in the orthotopic PANC-1 tumor (scale bar: 5 mm). d Immunohistochemical staining of residual PANC-1 tumor tissue treated with different EVs shows a strong accumulation of dtEVs (brown: anti-hCD64, scale bar: 50 μm). e, f Total flux of In Vivo Imaging System (IVIS) (e) and whole-animal imaging (f) over time shows combined GEM and dtEVs carrying both siKRASG12D and TP53 mRNA treatment was best at suppressing the growth of advanced tumors. The NOD/SCID mice (n = 5 mice each group) were i.p. injected with 1 × 1011 dtEVs carrying either scramble RNA, siKRASG12D (dtEVs-1), 50/50 siKRASG12D/TP53 mRNA (dtEVs-2) combined with GEM (15 mg/kg), or lipid nanoparticles (LNPs) loaded with 10-fold more synthetic TP53 mRNA and siKRASG12D. Both dtEVs and LNPs were injected 3 times per week, while GEM was injected once a week. One other control cohort was i.p. injected 15 mg/ kg Gemcitabine alone (GEM) once per week. g dtEVs significantly extended the survival of mice bearing PANC-1 orthotopic tumors (n of SCR, LNP, GEM, dtEV-1, and dtEV-2 + GEM are 6, 7, 7, 8, and 8 mice). *P < 0.05, **P < 0.01, log-rank test after Bonferroni correction. h Haematoxylin and eosin (H&E), Ki67, p-ERK, p21, KRASG12D staining of treated pancreatic tumors. Yellow marked regions in e and g are the drug treatment period. Data were presented as mean ± SD. For b and f, the data were analyzed by unpaired two-sided Student’s t test. (*p < 0.05, **p < 0.01, ***p < 0.001, ****p < 0.0001). Source data are provided as a Source data file. The siRNA sequences are given in Supplementary Table 3. Scale bar in h is 100 μm. a, c, d, h fluorescent and immunohistochemistry images are representative of three independent mice.
Fig. 7
Fig. 7. Targeting and therapeutic efficacy of dtEVs in PDX mouse models.
a Schematic (left) and fluorescence image (right) of subcutaneous PDX tumor intratumourally co-injected with PKH67-labeled IgG stEV (green) and PKH26-labeled CD64ck_αROR1 dtEV (red). Broader tumor penetration is seen with dtEV. (Scale bar is 5 mm) b Biodistribution (left) of PKH-labeled LNP, stEV (IgG) and dtEV (αROR1) in PDX mice bearing subcutaneously implanted pancreatic tumors shows dtEV accumulated preferentially in the tumor (n of LNP, stEV_IgG and dtEV_αROR1 = 2, 3, and 3 mice). c Organ imaging (right) confirms the tumor accumulation. Change in d, volume and e, weight of PDX tumors (with KRASG12D and TP53A138V mutations and EGFR+/ROR1+ expression) subcutaneously implanted in NOD/SCID mice after a 3-week treatment (yellow zone) with CD64ck_αROR1 dtEVs carrying scramble RNA (SCR), CD64ck_αROR1 dtEVs carrying 50/50 TP53 mRNA and siKRASG12D (dtEV), or CD64ck_αROR1 dtEVs carrying 50/50 TP53 mRNA and siKRASG12D plus 20 mg/kg GEM once per week. EVs were delivered at a dose of 1 × 1011 EVs 3 times per week. (n of SCR, dtEV, and dtEV+GEM = 5, 4, and 6 mice). f Number and area of metastatic tumor lesions in different organs (n of SCR, dtEV, and dtEV+GEM = 5, 4, and 6 mice). g Lung sections from treated PDX mice with hematoxylin and eosin (H&E) stain, DAPI (blue, nuclei), anti-cytokeratin (green, tumor marker), anti-KRAS (red), and anti-Flag (purple, delivered EV marker). Metastatic lesions in the lung were decreased by dtEVs with or without GEM [N: normal; T: tumor tissue]. h Tumor tissues of mice treated with dtEV or dtEV+GEM exhibited increased β-galactosidase expression and decreased K-i67 expression. i The therapeutic effect, characterized by increased β-galactosidase expression and decreased K-i67 expression, was also observed in metastatic lesions in the lung. The treatment period is highlighted in yellow in d. (*P < 0.05, **P < 0.01, ****P < 0.0001, as determined by unpaired two-sided Student’s t test. P-values are provided for selected comparisons.) The siRNA sequences are given in Supplementary Table 3. Source data are provided as a Source data file. (Scale bar of figures g, h, and i: 100 μm) gi fluorescent and immunohistochemistry images are representative of three independent mice.
Fig. 8
Fig. 8. Therapeutic efficacy of dtEVs in an orthotopic PDX mouse model.
a Representative PET-CT images displaying the growth of orthotopic PDAC tumors in the abdominal cavity of mice (n = 4 mice each group). b Biweekly monitoring of orthotopic PDX pancreatic tumors (with KRASG12D and TP53R196* mutations, and high ROR1 and Gli1 expressions) in Balb/C-nu mice subjected to different treatments: saline, CD64ck_αROR1 dtEVs carrying 50/50 TP53 mRNA and siKRASG12D combined with 50 mg/kg/week GEM (dtEV + GEM), or CD64ck_αROR1 dtEVs carrying 1/1/1 TP53 mRNA/siKRASG12D/siGli1 combined with 50 mg/kg GEM (dtEVGli1 + GEM). The dtEVs were administered at a dose of 1 × 1011 EVs three times per week, while GEM was administered once a week. Each cohort consisted of four mice (n = 4 mice, *P < 0.05, **P < 0.01, ****P < 0.0001, as determined by unpaired two-sided Student’s t test. P-values are provided for selected comparisons). c Representative histological analysis using H&E and IHC staining was performed for Ki-67, pERK, p21, KRASG12D, and Gli1 in orthotopic tumor tissues from 4 mice of each treatment group. Both dtEV and dtEVGli1, combined with GEM, exhibited suppression of Ki-67, pERK, p21, and KRASG12D. Treatment with dtEVGli1 + GEM further reduced Gli1 expression. The siRNA sequences are given in Supplementary Table 3. Source data are provided as a Source data file. (Scale bar in c: 100 μm).

References

    1. Siegel RL, Miller KD, Fuchs HE, Jemal A. Cancer Statistics, 2021. CA Cancer J. Clin. 2021;71:7–33. - PubMed
    1. Waters AM, Der CJ. KRAS: the critical driver and therapeutic target for pancreatic cancer. Cold Spring Harb. Perspect. Med. 2018;8:a031435. - PMC - PubMed
    1. Skoulidis F, et al. Sotorasib for lung cancers with KRAS p.G12C mutation. N. Engl. J. Med. 2021;384:2371–2381. - PMC - PubMed
    1. Hidalgo M. Pancreatic cancer. N. Engl. J. Med. 2010;362:1605–1617. - PubMed
    1. Kim MP, et al. Oncogenic KRAS recruits an expansive transcriptional network through mutant p53 to drive pancreatic cancer metastasis. Cancer Discov. 2021;11:2094–2111. - PMC - PubMed

Publication types