. 2023 Oct 23;14(1):6719.
doi: 10.1038/s41467-023-41798-2.

Immune checkpoint inhibitor-induced colitis is mediated by polyfunctional lymphocytes and is dependent on an IL23/IFNγ axis

Affiliations

Immune checkpoint inhibitor-induced colitis is mediated by polyfunctional lymphocytes and is dependent on an IL23/IFNγ axis

Jonathan W Lo et al. Nat Commun. .

Abstract

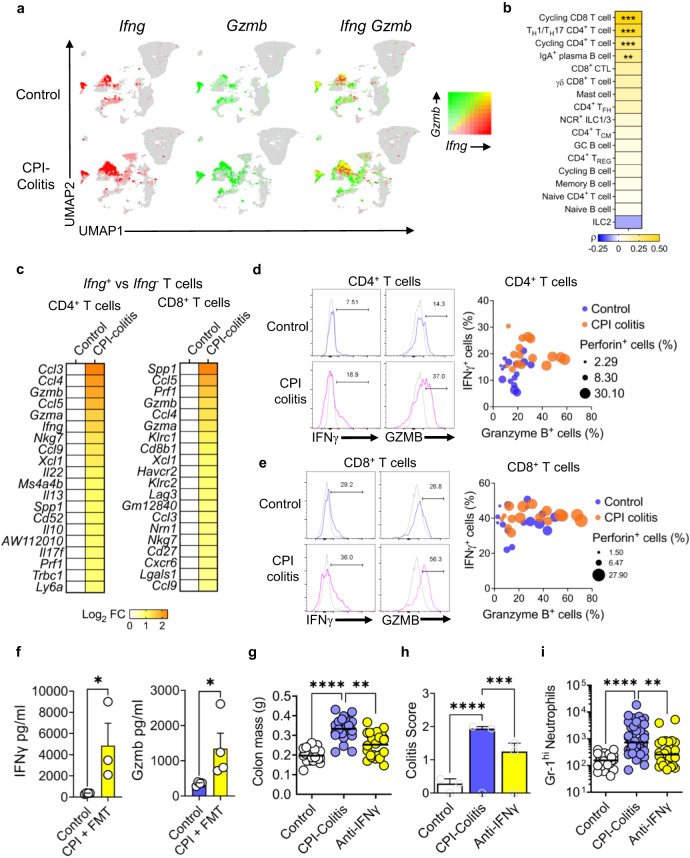
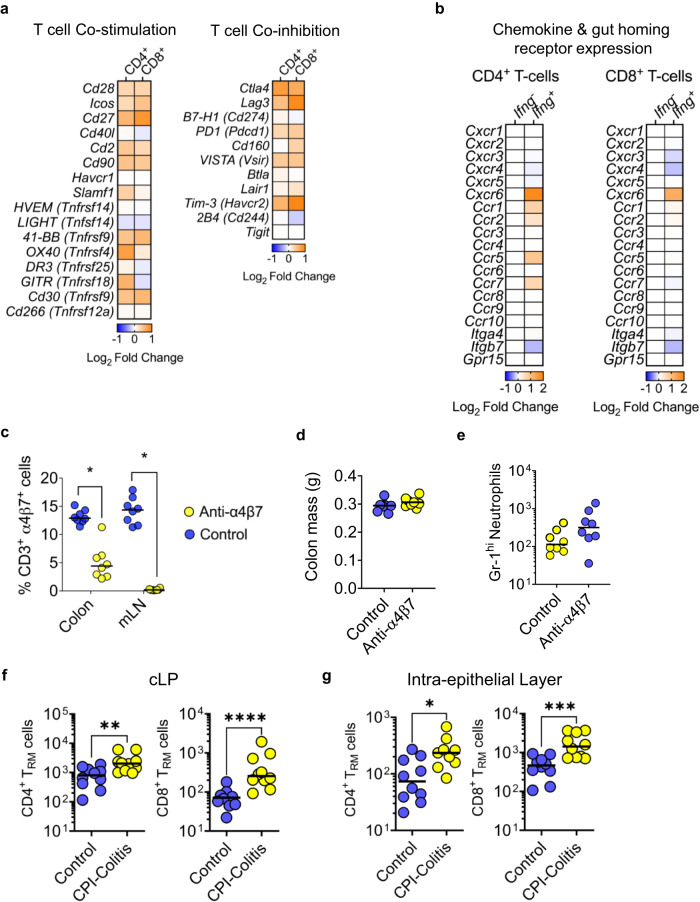
Immune checkpoint inhibitors (CPIs) are a relatively newly licenced cancer treatment, which make a once previously untreatable disease now amenable to a potential cure. Combination regimens of anti-CTLA4 and anti-PD-1 show enhanced efficacy but are prone to off-target immune-mediated tissue injury, particularly at the barrier surfaces. To probe the impact of immune checkpoints on intestinal homoeostasis, mice are challenged with anti-CTLA4 and anti-PD-1 immunotherapy and manipulation of the intestinal microbiota. The immune profile of the colon of these mice with CPI-colitis is analysed using bulk RNA sequencing, single-cell RNA sequencing and flow cytometry. CPI-colitis in mice is dependent on the composition of the intestinal microbiota and by the induction of lymphocytes expressing interferon-γ (IFNγ), cytotoxicity molecules and other pro-inflammatory cytokines/chemokines. This pre-clinical model of CPI-colitis could be attenuated following blockade of the IL23/IFNγ axis. Therapeutic targeting of IFNγ-producing lymphocytes or regulatory networks, may hold the key to reversing CPI-colitis.


Conflict of interest statement

The authors declare no competing interests.

Figures

Fig. 1
Fig. 1. Intestinal microbiota regulates susceptibility to CPI-induced colitis.
a Colon mass in wildtype female 6-week-old Balb/C mice at 1 week, 3 weeks and 6 weeks without treatment (Control: n = 56 at 1 week, n = 79 at 3 weeks, n = 4 at 6 weeks), treatment with combination anti-CTLA4/anti-PD-1 (CPI: n = 10 at 1 week, n = 25 at 3 weeks, n = 6 at 6 weeks), treatment with fecal microbiota (FMT: n = 6 at 1 week, n = 35 at 3 weeks, n = 24 at 6 weeks) and mice treated with both CPI and FMT (CPI + FMT: n = 68 at 1 week, n = 182 at 3 weeks, n = 23 at 6 weeks). Two-way ANOVA with Tukey’s multiple comparison test used ****P < 0.0001. CPI injections were given once a week intraperitoneally. b Representative colon sections cut at 3 µm thick FFPE from control, CPI, FMT and CPI + FMT treated wildtype female 6-week-old Balb/C mice stained with H&E (Leica). c Summary histological colitis score from mice treated with CPI-C (n = 11), plus controls (Control: n = 6, CPI: n = 7 and FMT: n = 7). Average colitis scored based on apoptosis (0–3), infiltrating lymphocytes (0–3), crypt abscess formation (0–3). Bar graph showing mean with SEM and Two-way ANOVA with Tukey’s multiple comparison test used whereby *P = 0.0106 **P = 0.0051 and ****P < 0.0001. d Representative flow cytometry plot showing the CD4+ and CD8+ T cell gating. e Number of CD4+ and CD8+ T cells from the colonic lamina propria of Control (n = 29), CPI (n = 12), FMT (n = 30) and CPI + FMT (n = 79) treated wildtype female 6-week-old Balb/C mice. Two-way ANOVA with Tukey’s multiple comparison test used ****P < 0.0001. f Representative flow cytometry plot showing Gr-1hi neutrophils from Control, CPI, FMT and CPI + FMT treated wildtype female 6-week-old Balb/C mice. g Number of Gr-1hi neutrophils from the colonic lamina propria of Control (n = 70), CPI (n = 18), FMT (n = 33) and CPI + FMT (n = 95) treated wildtype female 6-week-old Balb/C mice. Two-way ANOVA with Tukey’s multiple comparison test used **P<0.01 ****P < 0.0001.
Fig. 2
Fig. 2. Longitudinal 16S analysis of microbiota shows early and persistent changes in composition of microbiota after FMT.
a Alpha-diversity (Shannon diversity index) of the microbiota between untreated control Balb/C wildtype female 6-week-old mice (n = 6), Balb/C wildtype mice treated with FMT (n = 6) and Balb/C wildtype female 6-week-old mice treated with CPI + FMT (n = 6) longitudinally over a 3 week period. A liner mixed model was used, based on ANCOM-BC, to account for the repeated measures of the mice. FDR Bonferroni corrected Padj. Box plot is defined by: Week 0 – Untreated = “Min.:3.775” “1st Qu.:3.787” “Median :3.828” “Mean:3.856” “3rd Qu.:3.867” “Max.:4.051” Week 1 – Untreated = “Min. :3.640” “1st Qu.:3.670” “Median :3.819” “Mean :3.909” “3rd Qu.:3.929” “Max. :4.586” Week 2 – Untreated =“Min. :3.659” “1st Qu.:3.823” “Median :3.871” “Mean :3.911” “3rd Qu.:3.968” “Max. :4.255“Week 3 – Untreated =“Min. :3.148” “1st Qu.:4.105” “Median :4.236” “Mean :4.049” “3rd Qu.:4.331” “Max. :4.427” Week 0 – FMT-only = “Min.:3.603” “1st Qu.:3.823” “Median:3.852” “Mean :3.890” “3rd Qu.:4.033” “Max. :4.137” Week 1 – FMT-only = “Min. :3.610” “1st Qu.:3.901” “Median :3.990” “Mean :4.007” “3rd Qu.:4.100” “Max. :4.445” Week 2 – FMT-only = “Min. :3.859” “1st Qu.:3.927” “Median :4.008” “Mean :4.021” “3rd Qu.:4.114” “Max. :4.206” Week 3 – FMT-only = “Min.:3.832” “1st Qu.:4.016” “Median :4.037” “Mean :4.069” “3rd Qu.:4.193” “Max. :4.250” Week 0 – CPI = “Min. :3.591” “1st Qu.:3.734” “Median :3.801” “Mean :3.772” “3rd Qu.:3.836” “Max. :3.878” Week 1 – CPI= “Min. :3.080” “1st Qu.:3.265” “Median :3.515” “Mean :3.557” “3rd Qu.:3.844” “Max. :4.097” Week 2 – CPI= “Min. :3.770” “1st Qu.:3.952” “Median :4.030” “Mean :4.084” “3rd Qu.:4.280” “Max. :4.384” Week 3 – CPI = “Min. :3.902” “1st Qu.:3.944” “Median :4.461” “Mean :4.348” “3rd Qu.:4.592” “Max. :4.839” b Non-metric dimensional scaling plot showing the beta diversity of the microbiota from untreated control Balb/C wildtype female 6-week-old mice (n = 6), Balb/C wildtype female 6-week-old mice treated with FMT (n = 6) and Balb/C wildtype female 6-week-old mice treated with CPI + FMT (n = 6) longitudinally over a 3 week period. c Phylum level relative abundance profiles from untreated control Balb/C wildtype female 6-week-old mice (n = 6), Balb/C wildtype female 6-week-old mice treated with FMT (n = 6) and Balb/C wildtype female 6-week-old mice treated with CPI + FMT (n = 6) longitudinally over a 3 week period. d Family level relative abundance profiles from untreated control Balb/C wildtype female 6-week-old mice (n = 6), Balb/C wildtype female 6-week-old mice treated with FMT (n = 6) and Balb/C wildtype female 6-week-old mice treated with CPI + FMT (n = 6) longitudinally over a 3 week period. Genus level coefficient changes comparing Balb/C wildtype female 6-week-old mice treated with FMT (n = 6) and Balb/C wildtype female 6-week-old mice treated with CPI + FMT (n = 6) at e 1 week, f 2 weeks and g 3 weeks of treatment. A liner mixed model was used, based on ANCOM-BC, to account for the repeated measures of the mice. FDR Bonferroni corrected Padj.
Fig. 3
Fig. 3. Transcriptome analysis shows colonic epithelial dysfunction and activation of T cells, cytotoxicity, and immune compartments in mice with CPI-induced colitis.
a Venn diagram of the DEGs (FDR < 0.05) identified by comparing the expression profiles of whole colon biopsies from wildtype female 6-week-old mice with only CPI treatment (n = 4), only FMT (n = 3) or with both CPI + FMT (n = 3) against control wildtype female 6-week-old mice (n = 4). b Volcano plot highlighting the DEGs (FDR < 0.05) from the comparison of RNA samples from wildtype female 6-week-old mice treated with both CPI + FMT (n = 3) versus control wildtype female 6-week-old mice (n = 4). Positive log fold changes indicate over-expression in treated mice, while negative log fold changes indicate upregulation in wildtype mice. c The topmost significantly upregulated differentially expressed genes involved in epithelial function, protease/protease inhibitors, immune activation, interferon-stimulated genes and antigen processing/presentation in the distal colon of wildtype female 6-week-old mice with CPI-induced colitis (n = 3) in comparison with control wildtype female 6-week-old mice (n = 4). d Gene expression changes in the distal colon of wildtype female 6-week-old mice with CPI-induced colitis (n = 3) in comparison with control wildtype female 6-week-old mice (n = 4) were used to identify which biological pathways were significantly impacted, using IPA Canonical Pathways. P value adjustment for multiple comparisons was applied with the Benjamini and Hochberg method. e Hallmark pathway analysis using GSEA in the gene expression changes in the distal colon of wildtype female 6-week-old mice with CPI-induced colitis (n = 3) in comparison with control wildtype female 6-week-old mice (n = 4). P value adjustment for multiple comparisons was applied with the Benjamini and Hochberg method.
Fig. 4
Fig. 4. Comparison between anti-CTLA4 and anti-PD-1 monotherapy treated mice showed shared and distinct patterns of mucosal immune activation.
a Venn diagram of the DEGs (FDR < 0.05) identified by comparing the expression profiles of whole colon biopsies from wildtype female 6-week-old mice with only anti-CTLA4 treatment (n = 3) or anti-PD-1 treatment (n = 3) in comparison to control wildtype female 6-week-old mice (n = 3). b Chair plots showing differentially expressed transcripts ranked by decreasing log fold change and coloured by estimated FDR in wildtype female 6-week-old mice with only anti-CTLA4 treatment (n = 3) or anti-PD-1 treatment (n = 3) in comparison to control wildtype female 6-week-old mice (n = 3). c Circular plot showing activation score of biological pathways which were significantly impacted, using IPA Canonical Pathways, in wildtype female 6-week-old mice with only anti-CTLA4 treatment (n = 3) or anti-PD-1 treatment (n = 3) in comparison to control wildtype female 6-week-old mice (n = 3). d Hallmark pathway analysis using GSEA in the gene expression changes in the distal colon of wildtype female 6-week-old mice with only anti-CTLA4 treatment (n = 3) or anti-PD-1 treatment (n = 3) in comparison to control wildtype female 6-week-old mice (n = 3). P value adjustment for multiple comparisons was applied with the Benjamini and Hochberg method. e Radar plot showing log2 fold change for the top 20 genes associated to the IFNγ responsive pathway in the gene expression changes in the distal colon of wildtype female 6-week-old mice with only anti-CTLA4 treatment (n = 3), anti-PD-1 treatment (n = 3) or combination treatment (n = 3), in comparison to control wildtype female 6-week-old mice (n = 3). f GSEA running score for the IFNγ responsive pathway in the gene expression changes in the distal colon of wildtype female 6-week-old mice with only anti-CTLA4 treatment (n = 3), anti-PD-1 treatment (n = 3) or combination treatment (n = 3), in comparison to control wildtype female 6-week-old mice (n = 3).
Fig. 5
Fig. 5. Transcriptomic landscape of colonic lymphocytes in CPI-induced colitis at single-cell resolution.
a UMAP plots of the 17 lymphocyte populations labelled according to Louvain clustering, coloured based on SingleR cell-type assignments and split by the two conditions under consideration. b Dot plot of the key genes used to identify each of the 17 clusters as shown by average expression and percentage expressed in each cluster. c Average proportional changes shown across all clusters in wildtype female 6-week-old mice with CPI-induced colitis (n = 3) vs control wildtype female 6-week-old mice (n = 3). Bar graph showing mean with SEM and Two-way ANOVA with Sidak’s multiple comparison test used whereby ***P = 0.0004 and ****P < 0.0001. d Chair plots showing differentially expressed transcripts ranked by decreasing log fold change and coloured by estimated false discovery rate (FDR) across all CD4+ and CD8+ T cell clusters in wildtype female 6-week-old mice with CPI-induced colitis (n = 3) vs control wildtype female 6-week-old mice (n = 3). e Pathways, identified using GSEA Hallmark, upregulated in across all CD4+ and CD8+ T cell clusters in wildtype female 6-week-old mice with CPI-induced colitis (n = 3) vs control wildtype female 6-week-old mice (n = 3). P value adjustment for multiple comparisons was applied with the Benjamini and Hochberg method. f Violin plots showing the expression levels of cytokines across CD4+ and CD8+ T cell and B cell clusters in wildtype female 6-week-old mice with CPI-induced colitis (n = 3) vs control wildtype female 6-week-old mice (n = 3).
Fig. 6
Fig. 6. CPI-induced colitis exhibits a profound and increased cytotoxic phenotype.
a UMAP plot and b the Pearson correlation showing the increased occurrence of Ifng and Gzmb expressing cells in CPI-induced colitis (n = 3) vs control samples (n = 4). P value adjustment for multiple comparisons was applied with the Benjamini and Hochberg method. c Heatmap of cytokine and chemokine expression shown by log2 fold changes between CPI-induced colitis (n = 3) and control samples (n = 4) in colonic CD4+ and CD8+ T cell clusters. d Representative flow cytometry histograms and bubble plots showing the percentage of granzyme B, IFNγ and perforin expressing CD3+ CD4+ T cells and e CD3+ CD8+ T cells in wildtype female 6-week-old mice with CPI-induced colitis (n = 16) and control wildtype female 6-week-old mice (n = 16). f Concentrations of IFNγ and granzyme B were determined via Luminex of supernatants from cultured colonic lamina propria cells at 2 × 106/ml for 24 h with plate bound anti-CD3 (2 µg/ml) for untreated Balb/C wildtype female 6-week-old mice (Control: n = 4) and wildtype female 6-week-old mice treated with CPI colitis model (CPI + FMT: n = 4). Mean and standard deviation are shown. *P < 0.05 two-sided Mann–Whitney U T test performed. g Colon mass (Control: n = 21) or wildtype female 6-week-old CPI colitis mice treated with an isotype control (CPI colitis: n = 21) or anti-IFNγ (Anti-IFNγ: n = 24), Kruskal-Wallis Test with Dunn’s multiple corrections performed where **P = 0.0014 and ****P < 0.0001. h Average colitis score, using the same previous colitis score parameters (Control: n = 7) or wildtype female 6-week-old CPI colitis mice treated with an isotype control (CPI colitis: n = 17) or anti-IFNγ (Anti-IFNγ: n = 8). Bar graph showing mean with SEM and Two-way ANOVA with Tukey’s multiple comparison test used whereby ***P = 0.0003 and ****P < 0.0001. i Number of Gr-1hi neutrophils of untreated wildtype female 6-week-old Balb/C mice (Control: n = 25) or wildtype female 6-week-old CPI colitis mice treated with an isotype control (CPI colitis: n = 43) or anti-IFNγ (Anti-IFNγ: n = 24) Kruskal–Wallis Test with Dunn’s multiple corrections performed where **P = 0.0025 and ****P < 0.0001.
Fig. 7
Fig. 7. CPI-induced colitis is mediated by CXCR6 expressing tissue-resident T cells.
a Heatmap of co-stimulatory and co-inhibitory expression from Ifng+ expressing CD4+ and CD8+ T cells in comparison to Ifng--expressing CD4+ and CD8+ T cells. b Heatmap of chemokines and gut homing gene expression from Ifng+ expressing CD4+ and CD8+ T cells in comparison to Ifng--expressing CD4+ and CD8+ T cells. c Percentage of CD3+ α4β7+ in the colon and mesenteric lymph node (mLN), d colon mass and e number of Gr-1hi neutrophils in wildtype female 6-week-old CPI colitis mice treated with an isotype control (n = 8) or anti-α4β7 depleting antibody (n = 8). f Number of CD4+ and CD8+ T cells from the colonic lamina propria and g intraepithelial layer of untreated wildtype female 6-week-old Balb/C mice (Control: n = 10) and CPI + FMT (CPI colitis: n = 10). For both f, g, a two-tailed Mann–Whitney U Test was used where *P = 0.0172 **P = 0.0039 ***P = 0.0007 and ****P < 0.0001.
Fig. 8
Fig. 8. IL23 blockade attenuates the development of CPI colitis.
a Network analysis, using Enhanced Causal Network using Qiagen IPA, of predicted upstream regulators of Ifng-expressing CD4+ T cell in CPI colitis. Multiple cytokines, transmembrane receptors and transcriptional regulators were predicted to significantly (FDR < 0.05) regulate Ifng-expressing CD4+ T cell. b Representative flow cytometry plot and c percentage of IFNγ+/TNFα+ CD4+ T cells from wildtype female 6-week-old CPI colitis mice treated with an isotype control (n = 7) or an IL-23 blocking antibody (n = 8). Two-tailed Mann–Whitney Test performed where *P = 0.019. d Colon mass, in either control mice (n = 12) or wildtype female 6-week-old CPI colitis mice treated with an isotype control (n = 23) or an IL-23 blocking antibody (n = 24). Kruskal-Wallis test with Dunn’s multiple comparison used where ****P < 0.0001. e Gr-1hi neutrophil counts in either wildtype female 6-week-old CPI colitis mice treated with an isotype control (n = 24) or an IL-23 blocking antibody (n = 26), using a two-tailed Mann–Whitney Test to show ***P = 0.0006 and f Average colitis score, using the same previous colitis score parameters, in either control mice (n = 7) or wildtype female 6-week-old CPI colitis mice treated with an isotype control (n = 17) or an IL-23 blocking antibody (n = 8). Bar graph showing mean with SEM and Two-way ANOVA with Tukey’s multiple comparison test used whereby ****P < 0.0001. g Colon mass, using a two-tailed Mann–Whitney Test to show ***P = 0.0003, and h Gr-1hi neutrophil counts in either wildtype female 6-week-old mice (n = 17) or female 6-week-old Il23−/− mice (n = 20) treated with CPI colitis. A two-tailed Mann–Whitney Test to show **P = 0.005, i Percentage of IFNγ+/TNFα+ CD4+ T cells from CPI colitis treated wildtype female 6-week-old mice (n = 8) or female 6-week-old Il23−/− mice (n = 12). A two-tailed Mann–Whitney Test to show *P = 0.0, j PathLinker network analysis of Ifng-expressing CD4+ T cell in CPI colitis showing the highest-ranking shortest paths involving differentially expressed genes linking Il23r to Ifng through regulatory and protein-protein interactions queried from OmniPath. Paths with wider edges rank higher with upregulated genes shown in orange, downregulated in blue.

References

    1. Phan GQ, et al. Cancer regression and autoimmunity induced by cytotoxic T lymphocyte-associated antigen 4 blockade in patients with metastatic melanoma. Proc. Natl Acad. Sci. USA. 2003;100:8372–8377. doi: 10.1073/pnas.1533209100. - DOI - PMC - PubMed
    1. Hodi FS, et al. Improved survival with ipilimumab in patients with metastatic melanoma. N. Engl. J. Med. 2010;363:711–723. doi: 10.1056/NEJMoa1003466. - DOI - PMC - PubMed
    1. Robert C, et al. Pembrolizumab versus ipilimumab in advanced melanoma. N. Engl. J. Med. 2015;372:2521–2532. doi: 10.1056/NEJMoa1503093. - DOI - PubMed
    1. Antonia SJ, et al. Nivolumab alone and nivolumab plus ipilimumab in recurrent small-cell lung cancer (CheckMate 032): a multicentre, open-label, phase 1/2 trial. Lancet Oncol. 2016;17:883–895. doi: 10.1016/S1470-2045(16)30098-5. - DOI - PubMed
    1. Cohen EEW, et al. Pembrolizumab versus methotrexate, docetaxel, or cetuximab for recurrent or metastatic head-and-neck squamous cell carcinoma (KEYNOTE-040): a randomised, open-label, phase 3 study. Lancet. 2019;393:156–167. doi: 10.1016/S0140-6736(18)31999-8. - DOI - PubMed

Publication types