. 2023 Oct 23;14(1):6729.
doi: 10.1038/s41467-023-42473-2.

Lipocalin 2 regulates mitochondrial phospholipidome remodeling, dynamics, and function in brown adipose tissue in male mice

Affiliations

Lipocalin 2 regulates mitochondrial phospholipidome remodeling, dynamics, and function in brown adipose tissue in male mice

Hongming Su et al. Nat Commun. .

Erratum in

Abstract

Mitochondrial function is vital for energy metabolism in thermogenic adipocytes. Impaired mitochondrial bioenergetics in brown adipocytes are linked to disrupted thermogenesis and energy balance in obesity and aging. Phospholipid cardiolipin (CL) and phosphatidic acid (PA) jointly regulate mitochondrial membrane architecture and dynamics, with mitochondria-associated endoplasmic reticulum membranes (MAMs) serving as the platform for phospholipid biosynthesis and metabolism. However, little is known about the regulators of MAM phospholipid metabolism and their connection to mitochondrial function. We discover that LCN2 is a PA binding protein recruited to the MAM during inflammation and metabolic stimulation. Lcn2 deficiency disrupts mitochondrial fusion-fission balance and alters the acyl-chain composition of mitochondrial phospholipids in brown adipose tissue (BAT) of male mice. Lcn2 KO male mice exhibit an increase in the levels of CLs containing long-chain polyunsaturated fatty acids (LC-PUFA), a decrease in CLs containing monounsaturated fatty acids, resulting in mitochondrial dysfunction. This dysfunction triggers compensatory activation of peroxisomal function and the biosynthesis of LC-PUFA-containing plasmalogens in BAT. Additionally, Lcn2 deficiency alters PA production, correlating with changes in PA-regulated phospholipid-metabolizing enzymes and the mTOR signaling pathway. In conclusion, LCN2 plays a critical role in the acyl-chain remodeling of phospholipids and mitochondrial bioenergetics by regulating PA production and its function in activating signaling pathways.


Conflict of interest statement

The authors declare no competing interests.

Figures
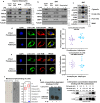
Fig. 1
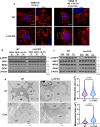
Fig. 1. Identification of LCN2 MAM localization and PA binding capability.
LCN2 is recruited to the MAM in inguinal adipocytes (a) in response to 6 h LPS (1 μg/mL) treatment and in BAT (b) in response to 6 h LPS stimulation along with known MAM proteins including FACL4, MFN2 and DRP1. The experiments in a and b were repeated 3 times independently. LCN2 protein levels in cytosolic, crude mitochondria, pure mitochondria, and MAM fractions in BAT of mice with saline, 6 h LPS (0.3 mg/kg body weight), or 6 h CL316, 243 (0.5 mg/kg body weight) treatment (c). The experiment in c was repeated twice independently. Co-localization of LCN2 with ER marker Calnexin (d) and mitochondrial maker TOM 20 (e) in 3T3-L1 preadipocytes and adipocytes. The correlation analysis was performed using Pearson’s coefficient. For the co-localization of LCN2 with ER, n = 16 for preadipocytes and n = 13 for adipocytes (d). For the co-localization of LCN2 with mitochondria, n = 13 for preadipoctes and n = 11 for adipocytes (d). Results are presented as mean ± SEM. Binding assay of membrane lipids with mouse LCN2 recombinant protein (f). Concentration-dependent binding of LCN2 to phospholipids (g). Various concentrations of PA and PC were spotted on the membrane and subjected to LCN2 binding assay. Cell lysates from 3T3-L1 adipocytes with or without IL-1β (1 ng/mL) treatment were spotted as a positive control. Concentration-dependent LCN2-PA binding with PA-coated beads (h). Beads without PA-coated served as a control. The experiment in h was repeated twice independently. Source data are provided as a Source data file. Mito: mitochondria; CL: CL316, 243.
Fig. 2
Fig. 2. Effect of Lcn2 deficiency on mitochondrial dynamics.
Mitochondrial dynamics induced by fasting and refeeding cycle in differentiated brown adipocytes (a). The expression of proteins involved in mitochondrial fission and fusion in differentiated brown adipocytes during the fasting-refeeding cycle (b) and upon norepinephrine (NE) (1 μM) or CL316, 243 (CL) (1 μM) treatment for one hour (c). TEM analysis of mitochondrial morphology and quantification of mitochondrial size in brown adipose tissue of mice at room temperature (RT) or after 5 h of 4 °C cold exposure (d). The in vitro experiments in b and c were repeated independently 3 and 2 times, respectively. The average mitochondrial size was determined based on 402 and 392 mitochondria from WT and Lcn2 KO mice at room temperature, and 496 and 510 mitochondria from WT and Lcn2 KO mice after 5 hours of exposure to 4 °C cold temperature (n = 3). Results are presented as mean ± SEM. Statistical significance was analyzed by Student’s t-test; all tests were two-sided. Source data are provided as a Source data file. PA: palmitate acid; HG: high glucose; LD: lipid droplet.
Fig. 3
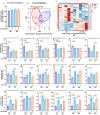
Fig. 3. Effect of Lcn2 deficiency on CL316, 243-induced changes in cardiolipin content in BAT.
WT and Lcn2 KO mice at 8–10 weeks of age were treated with either saline or CL316, 243 (0.5 mg/kg BW) via i.p. injection once a day for 14 days. Global analysis of total cardiolipins (a), PCA (b), and hierarchical clustering (c). CL316, 243-induced changes in the content of individual cardiolipins (d-u). Results are presented as mean ± SEM. Student’s t-test was performed to test differences between two independent groups. All tests were two-sided. n = 4 (saline-treated WT and Lcn2 KO mice), n = 5 (CL316, 243-treated WT and Lcn2 KO mice). Source data are provided as a Source data file.
Fig. 4
Fig. 4. Global analysis of three categories of measurable cardiolipin species in BAT.
(a) Sum of MUFA-containing CL species, C18:2n6 PUFA-containing CL species (b), C20-22 PUFA-containing CL species (c), Percentage of MUFA-containing cardiolipin (d), C18:2n6 PUFA-containing cardiolipin (e), and C20-22n6 PUFA-containing cardiolipin (f) in total measurable cardiolipin species in mitochondria isolated from BAT, and ratio of PUFA to MUFA-containing CL species (g) in BAT of male mice treated with or without CL316, 243 for 14 days. Pattern of changes in individual CL species presented as a percentage of total measurable CL species (h). Results are presented as mean ± SEM. Student’s t test was performed to test differences between two independent groups. All tests were two-sided. n = 4 (saline-treated WT and Lcn2 KO mice), n = 5 (CL316, 243-treated WT and Lcn2 KO mice). Sum of MUFA-CLs was calculated from the addition of the abundance of 11 measurable MUFA CLs (16:1-16:1-16:1-16:1, 16:0-16:1-16:1-16:1, 16:1-16:1-16:1-18:1, 16:0-16:1-16:1-18:1, 16:0-16:0-16:1-18:1, 18:1-18:1-16:1-16:1, 18:1-18:1-16:0-16:1, 18:1-18:1-16:0-16:0, 18:1-18:1-17:1-16:1, 16:1-18:1-18:1-18:1, 16:1-18:1-18:1-18:0). Sum of C18:2n6 PUFA-CLs was calculated from the addition of the abundance of 7 measurable C18:2n6 PUFA-CLs (18:2-18:2-16:1-16:1, 18:2-18:2-18:2-16:1, 18:2-18:2-18:2-16:0, 18:2-18:1-18:1-16:1, 18:2-18:2-18:2-18:2, 18:1-18:2-18:2-20:1, and 18:2-18:2-18:2-18:1). Sum of C20-22 PUFA-CLs was calculated from the addition of the abundance of 6 measurable C20-22n6 PUFA-CLs (20:4-18:2-16:1-16:1, 18:2-18:2-18:2-20:4, 18:2-18:2-18:2-20:3, 18:2-18:2-18:2-20:2, 18:1-18:2-18:2-20:2, and 18:2-18:2-18:2-22:5) and 2 measurable C22:6 PUFA CLs (18:2-18:2-16:1-22:6 and 18:2-18:2-18:2-22:6). The percentage of MUPA-CLs, C18-2n6 PUFA CLs, and C20-22n6 PUFA CLs was calculated from the sum of each category of CLs/total measurable CLs. Source data are provided as a Source data file.
Fig. 5
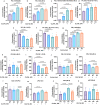
Fig. 5. Content of PC, PE, PS, and LPC species altered by Lcn2 deficiency in BAT.
Individual altered PC (a-f), PE (g), and PS (h-k) species. Sum of three altered LPC species (l) and three individual LPC species (m-o) in BAT of WT and Lcn2 KO mice treated with Saline or CL316, 243 for 14 days. Results are presented as mean ± SEM. Student’s t-test was performed to test differences between two independent groups. All tests were two-sided. n = 4 (saline-treated WT and Lcn2 KO mice), n = 5 (CL316, 243-treated WT and Lcn2 KO mice). Source data are provided as a Source data file.
Fig. 6
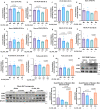
Fig. 6. Effect of Lcn2 deficiency on plasmalogen biosynthesis, peroxisomal β-oxidation and LC-PUFA metabolism in BAT.
Sum of PC-Pls (a) and individual PC-Pls (bc). Sum of PE-Pls (d), MUFA-PE-Pls (e), and PUFA-PE-Pls (f) as well as individual PE-Pls (gh). The levels of LC-PUFA (i–k) in BAT of WT and Lcn2 KO mice treated with Saline or CL316, 243 for 14 days. Protein expression of LCN2, COX2, and FAR1, a rate-limiting enzyme for plasmalogen biosynthesis in whole BAT homogenate (l) and isolated MAM fraction from BAT of male mice (m). MAM was isolated from pooled BAT of 4 male mice. Results are presented as mean ± SEM. Student’s t-test was performed to test differences between two independent groups. All tests were two-sided. n = 4 (saline-treated WT and Lcn2 KO mice), n = 5 (CL316, 243-treated WT and Lcn2 KO mice). Source data are provided as a Source data file. Pl: plasmalogen.
Fig. 7
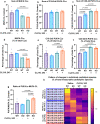
Fig. 7. Effect of Lcn2 deficiency on DAG and PA production and phospholipid-metabolizing enzymes in BAT.
The levels of measurable PA (ag) species and DAG species (hj); n = 5 per group. Gene expression of DGK isoforms (kn); n = 6 per group. Protein expression levels of phospholipid-metabolizing enzymes (o) in BAT homogenate of WT and Lcn2 KO mice treated with Saline or CL316, 243 for 14 days. Quantification of western-blotting band intensity (ps) (n = 3 mice). Results are presented as mean ± SEM. Student’s t-test was performed to test differences between two independent groups. All tests were two-sided. The animal experiment with CL316, 243 treatment was repeated 3 times independently; n = 56 mice per group for each independent experiment. Source data are provided as a Source data file.
Fig. 8
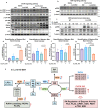
Fig. 8. Effect of Lcn2 deficiency on PA-regulated signaling pathways in BAT.
Protein expression levels of mTOR signaling components (a) and ERK (b) in BAT homogenate of WT and Lcn2 KO mice treated with Saline or CL316, 243 for 14 days. Time-course of ERK protein induction by CL316, 243 in differentiated brown adipocytes (c). Cell culture experiments were repeated twice independently. (dg) quantification of western-blotting band intensity (n = 3 mice). Results are presented as mean ± SEM. Student’s t-test was performed to test differences between two independent groups. All tests were two-sided. The diagram depicts the disrupted processes of acyl-chain remodeling and metabolism of phospholipids and the altered signaling PA production and function in Lcn2 KO BAT (h). Blue arrows indicate changes in enzymes and lipids in the basal condition. Red arrows represent changes in the CL316, 243-treated condition. Source data are provided as a Source data file.

Similar articles

Cited by

References

    1. Horvath S. E., Daum, G. Lipids of mitochondria. Prog. Lipid Res.52, 590–614 (2013). - PubMed
    1. Osman C, Voelker DR, Langer T. Making heads or tails of phospholipids in mitochondria. J. Cell Biol. 2011;192:7–16. doi: 10.1083/jcb.201006159. - DOI - PMC - PubMed
    1. Vance, J. E. Phospholipid Synthesis and Transport in Mammalian Cells. 10.1111/tra.12230 (2014). - PubMed
    1. Raturi A, Simmen T. Where the endoplasmic reticulum and the mitochondrion tie the knot: the mitochondria-associated membrane (MAM) Biochim. Biophys. Acta. 2013;1833:213–224. doi: 10.1016/j.bbamcr.2012.04.013. - DOI - PubMed
    1. Calzada E, et al. Phosphatidylethanolamine made in the inner mitochondrial membrane is essential for yeast cytochrome bc1 complex function. Nat. Commun. 2019;10:1432. doi: 10.1038/s41467-019-09425-1. - DOI - PMC - PubMed

Publication types