. 2023 Oct 23;10(1):724.
doi: 10.1038/s41597-023-02549-6.

High-resolution (1 km) Köppen-Geiger maps for 1901-2099 based on constrained CMIP6 projections

Affiliations

High-resolution (1 km) Köppen-Geiger maps for 1901-2099 based on constrained CMIP6 projections

Hylke E Beck et al. Sci Data. .

Abstract

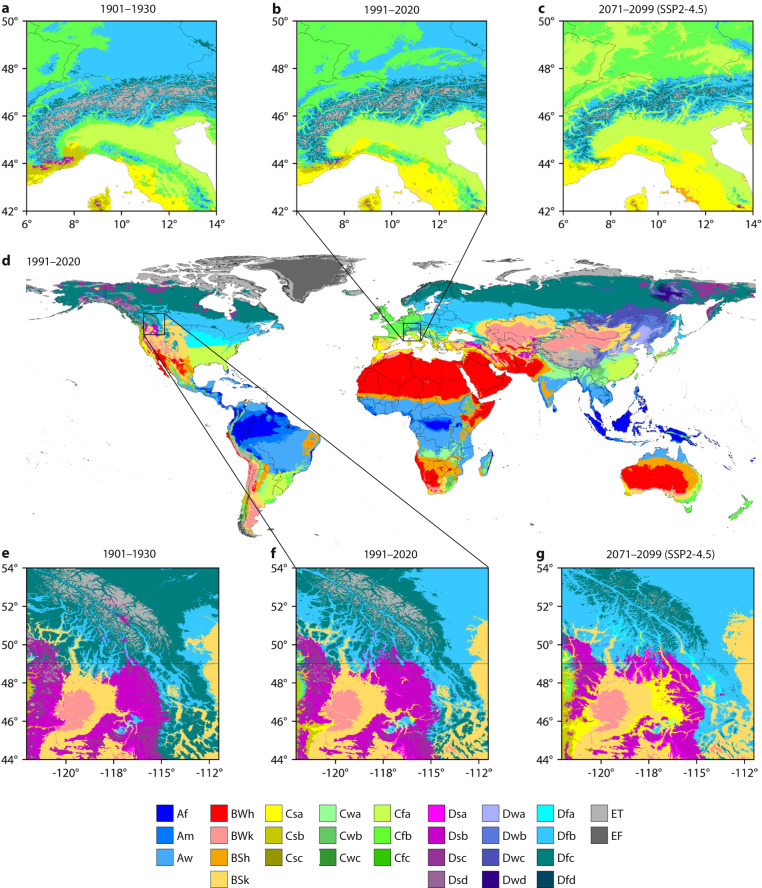
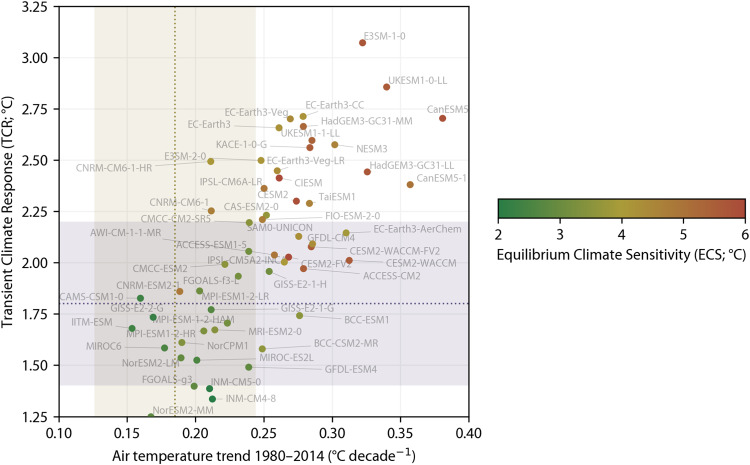
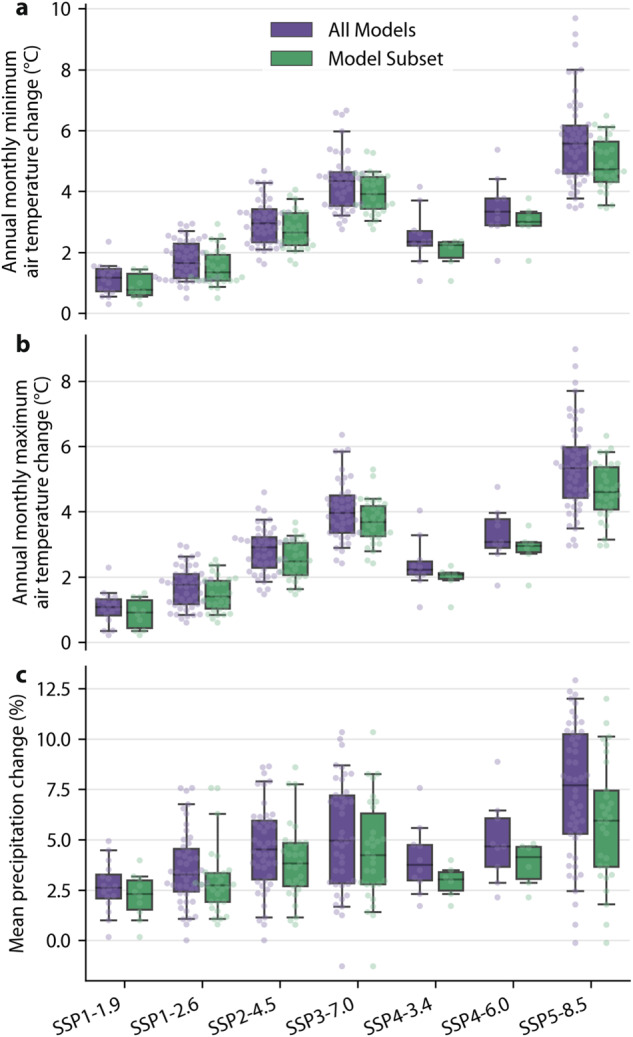
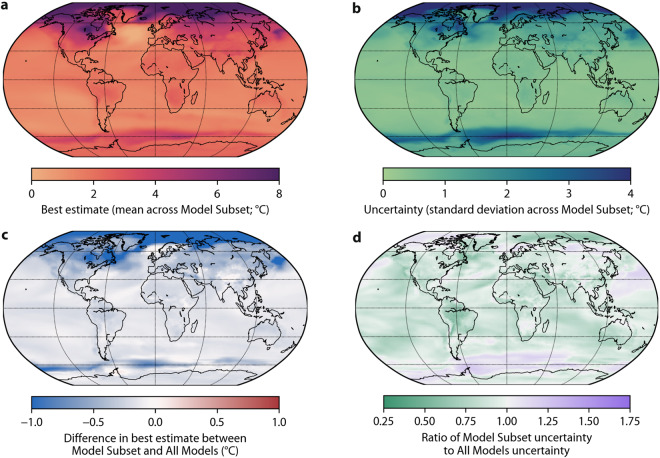
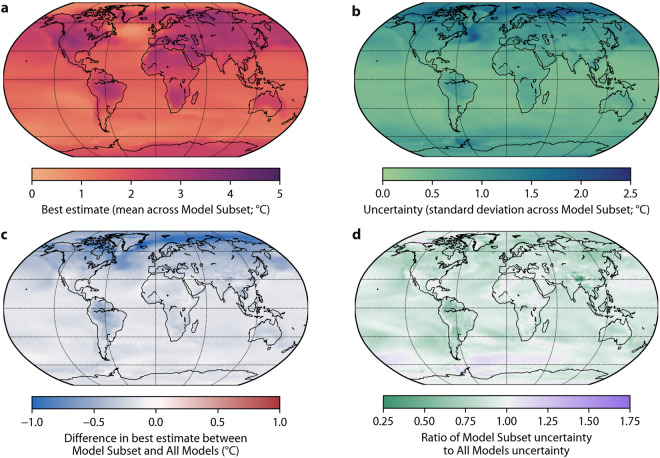
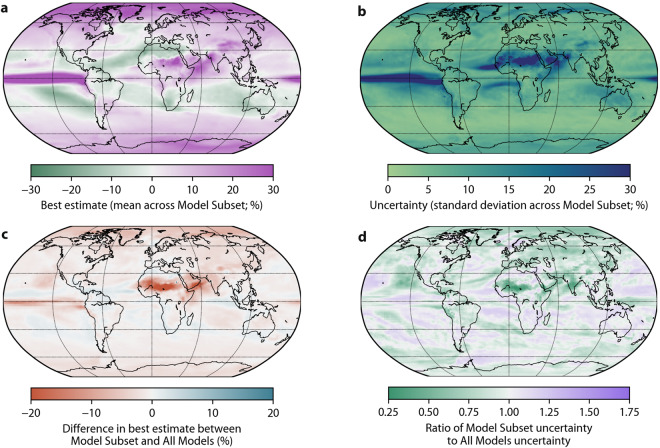
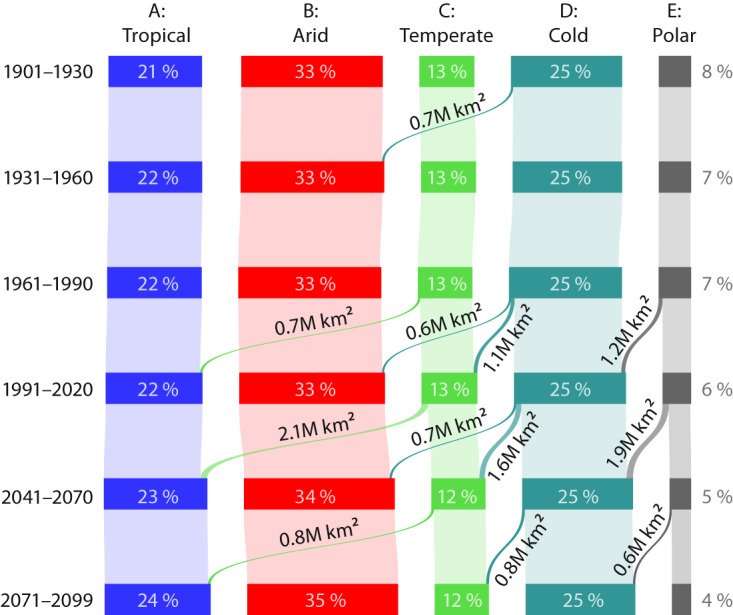
We introduce Version 2 of our widely used 1-km Köppen-Geiger climate classification maps for historical and future climate conditions. The historical maps (encompassing 1901-1930, 1931-1960, 1961-1990, and 1991-2020) are based on high-resolution, observation-based climatologies, while the future maps (encompassing 2041-2070 and 2071-2099) are based on downscaled and bias-corrected climate projections for seven shared socio-economic pathways (SSPs). We evaluated 67 climate models from the Coupled Model Intercomparison Project phase 6 (CMIP6) and kept a subset of 42 with the most plausible CO2-induced warming rates. We estimate that from 1901-1930 to 1991-2020, approximately 5% of the global land surface (excluding Antarctica) transitioned to a different major Köppen-Geiger class. Furthermore, we project that from 1991-2020 to 2071-2099, 5% of the land surface will transition to a different major class under the low-emissions SSP1-2.6 scenario, 8% under the middle-of-the-road SSP2-4.5 scenario, and 13% under the high-emissions SSP5-8.5 scenario. The Köppen-Geiger maps, along with associated confidence estimates, underlying monthly air temperature and precipitation data, and sensitivity metrics for the CMIP6 models, can be accessed at www.gloh2o.org/koppen .


Conflict of interest statement

The authors declare no competing interests.

Figures

Fig. 1
Fig. 1
Köppen-Geiger classification for the European Alps (a–c), the global land surface (d), and the central Rocky Mountains (eg) for 1901–1930 (a,e), 1991–2020 (b,d,f), and 2071–2099 (c,g) under the SSP2-4.5 scenario. In panels a–c the white areas are the Mediterranean Sea, with all seas and oceans being white in panel d.
Fig. 2
Fig. 2
TCR and ECS values and global-mean air temperature trends for all CMIP6 models with the required data to compute all three statistics (n = 56). The yellow dotted line represents the best estimate historical trend with the yellow shaded area representing the likely range (68% confidence limit; see section “Constraining CMIP6 projections”). The gray dotted line represents the best estimate TCR from IPCC AR6 with the gray shaded area indicating the likely range (66% confidence limit) also from IPCC AR6. Each circular marker represents a model. Models without sufficient data to calculate TCR or ECS values are not shown (n = 11). See Table 3 for historical trend, TCR, and ECS values (if available) for all models (n = 67).
Fig. 3
Fig. 3
Mean change across the land surface in 2071–2099 (relative to 1991–2020) for different socio-economic scenarios (SSP1-1.9 to SSP5-8.5) based on ‘All Models’ (all CMIP6 models with sufficient data; n ≤ 67) and ‘Model Subset’ (screened model subset without less realistic models; n ≤ 42). Each circular marker represents a model. The number of models varies depending on the socio-economic scenario. The box shows the quartiles of the distribution, the whiskers indicate the 5th and 95th percentiles, while the black horizontal line in the box is the median.
Fig. 4
Fig. 4
(a) Best estimate annual monthly minimum air temperature change in 2071–2099 (with respect to 1991–2020) under the SSP2-4.5 scenario (calculated as the mean across the Model Subset) with purple indicating a greater change. (b) Uncertainty corresponding to the best estimates (calculated as the standard deviation across the Model Subset) with dark blue indicating more uncertainty. (c) Difference in best estimate between Model Subset and All Models. Indicates how the model subsetting affects the best estimate with dark blue denoting greater changes. (d) Ratio of Model Subset uncertainty to All Models uncertainty. Indicates how the model subsetting affects the uncertainty with green denoting reduced uncertainty.
Fig. 5
Fig. 5
Same as Fig. 4 but for annual monthly maximum air temperature.
Fig. 6
Fig. 6
Same as Fig. 4 but for mean precipitation.
Fig. 7
Fig. 7
The global distribution and transitions of the five major Köppen-Geiger classes from 1901 to 2099 under the SSP2-4.5 scenario. Only transitions covering a surface area greater than 0.6 million km2 (roughly the area of Ukraine) are shown to avoid clutter. The capital ‘M’ stands for million. The percentages are expressed as a proportion of the global land surface area excluding Antarctica (137 million km2).

References

    1. Beck HE, 2023. High-resolution (1 km) Köppen-Geiger maps for 1901–2099 based on constrained CMIP6 projections. Figshare. - DOI - PMC - PubMed
    1. Köppen WD. Wärmezonen der Erde, nach der Dauer der heissen, gemässigten und kalten Zeit und nach der Wirkung der Wärme auf die organische Welt betrachtet. Meteorologische Zeitschrift. 1884;1:215–226.
    1. Köppen, W. Das geographische System der Klimate, 1–44 (Gebrüder Borntraeger, Berlin, Germany, 1936).
    1. Geiger, R. Klassifikation der Klimate nach W. Köppen, vol. 3 of Landolt-BörnsteinZahlenwerte und Funktionen aus Physik, Chemie, Astronomie, Geophysik und Technik, chap. 3, 603–607 (Springer, 1954).
    1. Geiger, R. Überarbeitete Neuausgabe von Geiger, R.: Köppen-Geiger/Klima der Erde. Wandkarte 1:16 Mill (1961).