Case Reports
. 2023 Nov;29(11):2731-2736.
doi: 10.1038/s41591-023-02613-z. Epub 2023 Oct 23.

Targeted depletion of TRBV9+ T cells as immunotherapy in a patient with ankylosing spondylitis

Affiliations
Case Reports

Targeted depletion of TRBV9+ T cells as immunotherapy in a patient with ankylosing spondylitis

Olga V Britanova et al. Nat Med. 2023 Nov.

Abstract

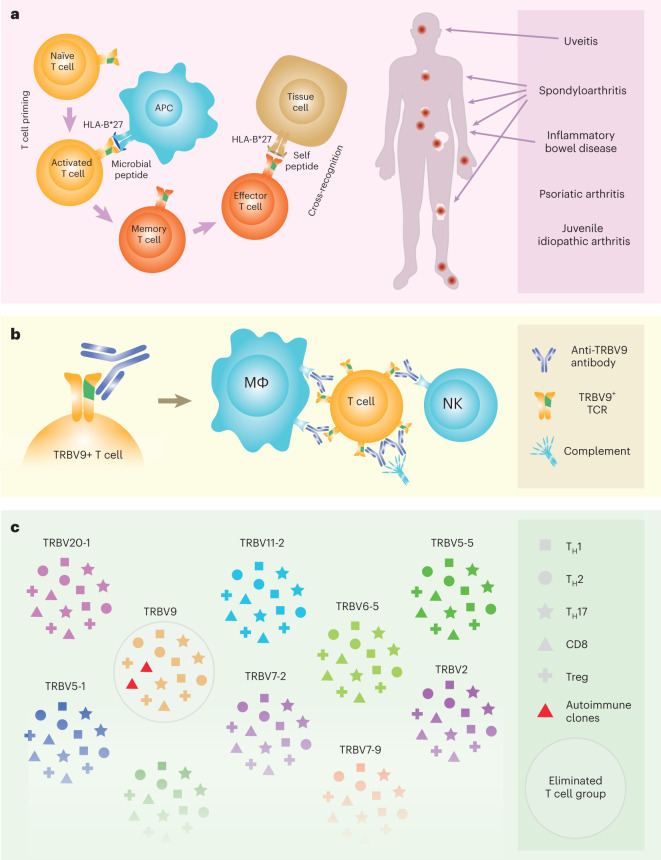
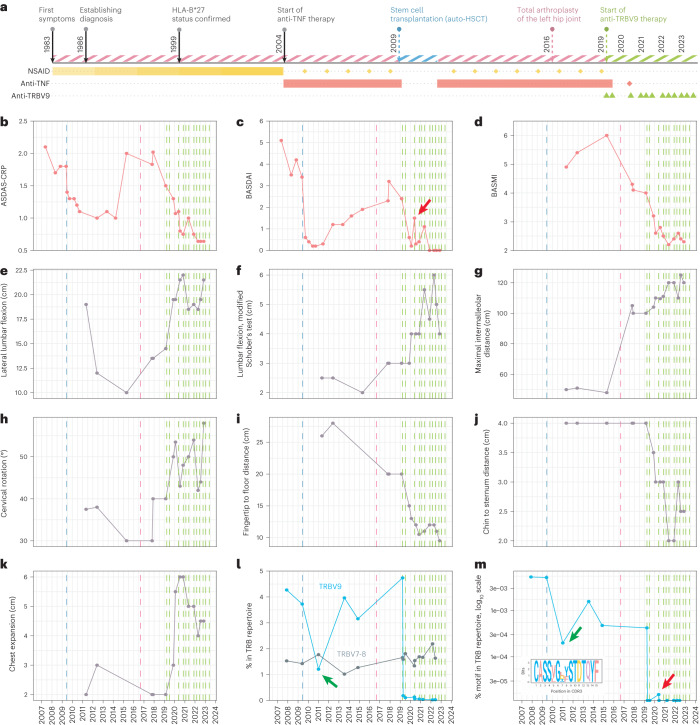
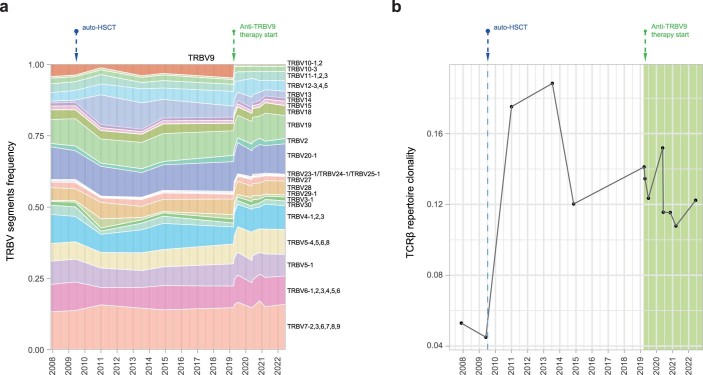
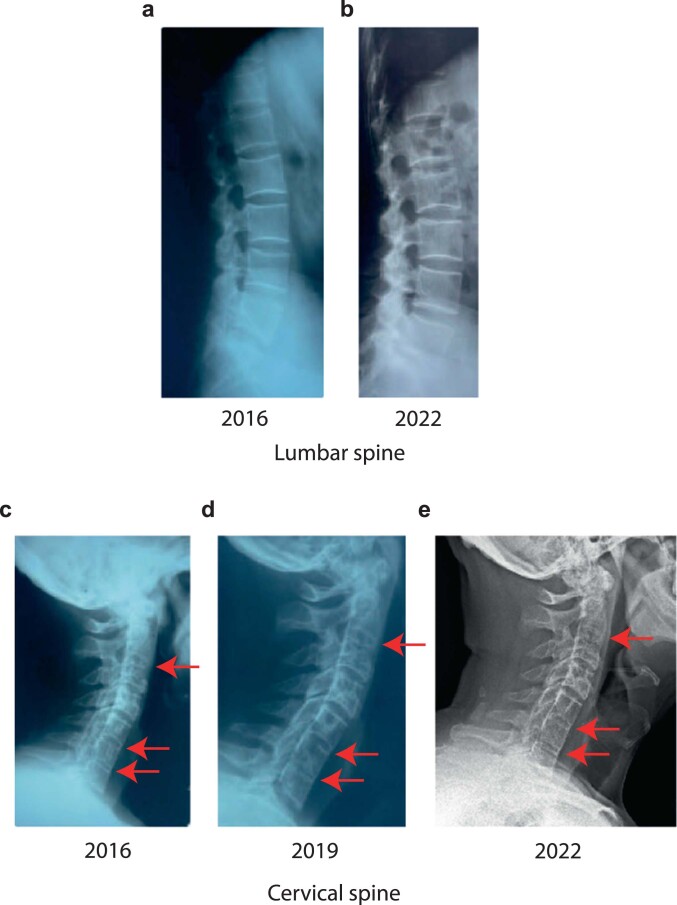
Autoimmunity is intrinsically driven by memory T and B cell clones inappropriately targeted at self-antigens. Selective depletion or suppression of self-reactive T cells remains a holy grail of autoimmune therapy, but disease-associated T cell receptors (TCRs) and cognate antigenic epitopes remained elusive. A TRBV9-containing CD8+ TCR motif was recently associated with the pathogenesis of ankylosing spondylitis, psoriatic arthritis and acute anterior uveitis, and cognate HLA-B*27-presented epitopes were identified. Following successful testing in nonhuman primate models, here we report human TRBV9+ T cell elimination in ankylosing spondylitis. The patient achieved remission within 3 months and ceased anti-TNF therapy after 5 years of continuous use. Complete remission has now persisted for 4 years, with three doses of anti-TRBV9 administered per year. We also observed a profound improvement in spinal mobility metrics and the Bath Ankylosing Spondylitis Metrology Index (BASMI). This represents a possibly curative therapy of an autoimmune disease via selective depletion of a TRBV-defined group of T cells. The anti-TRBV9 therapy could potentially be applicable to other HLA-B*27-associated spondyloarthropathies. Such targeted elimination of the underlying cause of the disease without systemic immunosuppression could offer a new generation of safe and efficient therapies for autoimmunity.


Conflict of interest statement

A.A.A., Y.Y.U., A.K.V. and P.A.I. are employees of BIOCAD. A.N.D. and M.I. are employees of MiLaboratories. E.S.E. is an employee of Miltenyi Biotec. The other authors declare no competing interests.

Figures

Fig. 1
Fig. 1. Overview of HLA-B*27-associated spondyloarthropathies, and mechanics and consequences of anti-TRBV9 immunotherapy.
a, Concept of arthritogenic peptide. CD8+ T cells primed by microbial peptides presented by HLA-B*27 form memory populations that subsequently interact with HLA-B*27-bound self-peptides owing to natural cross-reactivity. Depending on T cell homing and other factors, HLA-B*27-associated spondyloarthropathies manifest in a range of autoimmune diseases. b, Therapy with anti-TRBV9 cytotoxic antibody leads to complete elimination of TRBV9+ T cells via antibody-dependent cellular cytotoxicity by NK cells and complement proteins, as well as antibody-dependent cellular phagocytosis by macrophages (MΦ) such as liver Kupffer cells. c, Anti-TRBV9 therapy eliminates TRBV9+ T cell clones, including autoimmune ones, but does not systemically alter any branch of T cell immunity. Only the most frequently used TRBV gene segments are shown.
Fig. 2
Fig. 2. The patient’s clinical history up to and during antibody-mediated depletion of TRBV9+ T cells.
a, Medical history of the patient. Pink stripes indicate periods of disease activity, and blue and green stripes show remission. Anti-TRBV9 antibody injections are indicated by green triangles. Other medications are shown as rectangles according to the period of use. Yellow gradient rectangle reflects increasing indomethacin dosage. Sporadic medications are shown with diamonds. Dashed vertical lines show autologous HSCT (blue), arthroplasty (pink) and anti-TRBV9 therapy (green). b, Ankylosing spondylitis disease activity score with C-reactive protein (ASDAS-CRP). c, BASDAI. d, BASMI. ek, Spinal mobility metrics over the course of the patient’s treatment history. l, Proportion of TRBV9 and TRBV7-8 clonotypes in peripheral blood according to deep TCRβ repertoire profiling. m, Proportion of ankylosing spondylitis-associated CDR3 motif (logo shown as inset) within the total TCRβ repertoire in peripheral blood as analyzed via deep targeted TRBV9 repertoire profiling, accounting for the proportion of TRBV9 TCRβ clonotypes in peripheral blood. Green arrows indicate depletion of TRBV9 (l) and ankylosing spondylitis-associated CDR3 motif (m) after auto-HSCT. Red arrows indicate period of relapse, which co-occurred with ankylosing spondylitis-associated CDR3 motif detection in peripheral blood. Source data
Extended Data Fig. 1
Extended Data Fig. 1. TRBV9+ T cell depletion in monkeys.
a-i. TRBV9+ T cell depletion in Macaca mulatta. Plots show (a–c) Real-time PCR-based dynamic changes of TRBV9 mRNA concentration in peripheral blood mononuclear cells (PBMCs) normalized to control TRBV7 mRNA levels, and the proportion of (d–f) functional TRBV9+ and (g–i) TRBV7+ clonotypes within the TCRβ repertoire (normalized to the first time-point). TRBV7 data represent the sum of TRBV7 gene segments. Kruskal-Wallis test results are shown on the top of each plot. No adjustment was made for multiple comparisons. The mean value is shown with a dotted line. Standard deviation is shown in gray. N = 4 animals per group. j. BCD-180-mediated TRBV9+ T cell depletion in Macaca fascicularis. Plot shows relative concentration of TRBV9 mRNA in PBMCs 21 days after the first injection, as determined by real-time PCR and normalized to levels of TRBV7 control mRNA. Groups were compared by type of treatment using Kruskal-Wallis test followed by Dunnett’s test. *** p < 0.001. N = 20 animals per group. The box plots show median and 1st–3rd interquartile range. The whiskers extend from hinges to the maximum or minimum. Data beyond the 1.5 x interquartile range are plotted individually. k. Pharmacokinetic profile of BCD-180 in M. fascicularis. Accumulation of serum BCD-180 was observed with a half-life of 9 ± 3,8 days, 12,9 ± 7 and 13,2 ± 7,2 days for 3, 10, and 30 mg kg1 animal groups, respectively. Source data
Extended Data Fig. 2
Extended Data Fig. 2. Radiographic confirmation of ankylosing spondylitis.
a. X-ray radiography (from 2011) demonstrates complete ankylosis (grade 4 bilaterally) of sacroiliac joints. The left hip shows severe joint space narrowing, large osteophytes, severe sclerosis, and bone deformation (Kellgren-Lawrence grade 4). The right hip shows slight joint gap narrowing and a small osteophyte along the upper edge of the femoral head. b. Sagittal computed tomography (CT) scan of cervical thoracic part of spinal cord (2019) shows multisegmental syndesmophytes (complete anterior ossification) between Th3-Th7.
Extended Data Fig. 3
Extended Data Fig. 3. Dynamics of TRBV segments usage and TCRβ repertoire clonality during observational period.
a. Cumulative frequency of TCRβ CDR3 clonotypes carrying different TRBV segments in the total PBMC repertoire at each time point is shown. Low frequency segments are grouped together. Note prominent decrease of TRBV9+ T cells after auto-HSCT and complete disappearance after the start of anti-TRBV9+ therapy. Note that anti-TRBV9+ therapy did not lead to depletion of any other TRBV segment. b. TCRβ repertoire clonality (relative presence of large clonal expansions) calculated as [1-Normalized Shannon Wiener]. Note growth of clonality after auto-HSCT, stabilization in subsequent period, and absence of prominent changes after initiation of anti-TRBV9 therapy.
Extended Data Fig. 4
Extended Data Fig. 4. TRBV9+ T cell depletion.
a. Dynamic changes relative to the first time-point for TRBV9 and TRBV7 mRNA concentrations in PBMCs as measured by real-time PCR and normalized to control TRBC mRNA. b. Proportion of non-functional CDR3 rearrangements within TRBV9 repertoire. TRBV9 repertoire profiling showed a gradual increase in the proportion of non-functional rearrangements within the remaining TRBV9 repertoire. Such non-functional rearrangements are often present in the second copy of the TCR variable domain in mature T cells and are detectable at the level of mRNA but do not encode functional TCR chains and thus are not subjected to anti-TRBV9-mediated depletion. Considering the high proportion of non-functional mRNA within the remaining TRBV9 repertoire after anti-TRBV9 therapy, the actual depletion of functional TRBV9+ T cells is actually ~3-fold deeper than estimated by real-time PCR in (a). Dashed vertical lines show autologous HSCT (blue), arthroplasty (pink) and anti-TRBV9 therapy (green).
Extended Data Fig. 5
Extended Data Fig. 5. Radiography of the lumbar (a,b) and cervical (c-e) spine from 2016 to 2022.
No ankylosis observed in lumbar spine, with a slight increase in the mSASSS index from 7 to 9 points. For cervical spine, ankylosis at the level of C2-C3, C5-C6, C6-C7 has been noted since 2016 (red arrows). Progression in the mSASSS index from 21 to 25 points was observed in the period 2016 to 2019, stabilized at the level of 26 points during 3 years on anti-TRBV9 therapy.
Extended Data Fig. 6
Extended Data Fig. 6. Hip X-ray images from 2009 to 2023.
From 2009–2019, we observed an increase in the size of osteophytes (red arrowheads) along the upper edge of the femoral head and closure of the acetabular plate, with uneven narrowing of the joint space more along the lower edge of the head. From 2019–2023, we observed gradual degradation of the osteophyte. Lower panels show insets indicated by white dashed box in top panels.

References

    1. Benjamin R, Parham P. Guilt by association: HLA-B27 and ankylosing spondylitis. Immunol. Today. 1990;11:137–142. doi: 10.1016/0167-5699(90)90051-A. - DOI - PubMed
    1. Faham M, et al. Discovery of T cell receptor beta motifs specific to HLA-B27-positive ankylosing spondylitis by deep repertoire sequence analysis. Arthritis Rheumatol. 2017;69:774–784. doi: 10.1002/art.40028. - DOI - PubMed
    1. Komech EA, et al. CD8+ T cells with characteristic T cell receptor beta motif are detected in blood and expanded in synovial fluid of ankylosing spondylitis patients. Rheumatology. 2018;57:1097–1104. doi: 10.1093/rheumatology/kex517. - DOI - PubMed
    1. Pogorelyy MV, et al. Detecting T cell receptors involved in immune responses from single repertoire snapshots. PLoS Biol. 2019;17:e3000314. doi: 10.1371/journal.pbio.3000314. - DOI - PMC - PubMed
    1. May E, et al. Conserved TCR beta chain usage in reactive arthritis; evidence for selection by a putative HLA-B27-associated autoantigen. Tissue Antigens. 2002;60:299–308. doi: 10.1034/j.1399-0039.2002.600404.x. - DOI - PubMed

Publication types