. 2023 Oct 23;6(1):1078.
doi: 10.1038/s42003-023-05238-7.

A novel mouse model of mitochondrial disease exhibits juvenile-onset severe neurological impairment due to parvalbumin cell mitochondrial dysfunction

Affiliations

A novel mouse model of mitochondrial disease exhibits juvenile-onset severe neurological impairment due to parvalbumin cell mitochondrial dysfunction

Elizaveta A Olkhova et al. Commun Biol. .

Abstract

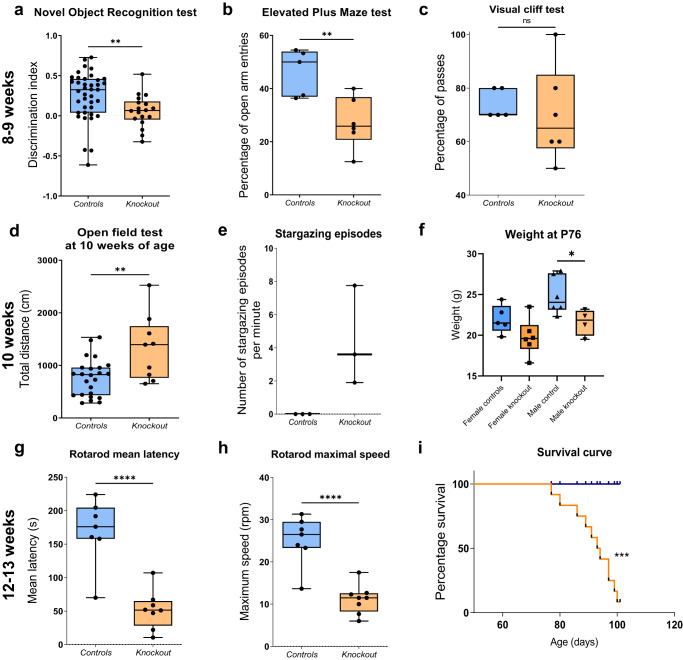
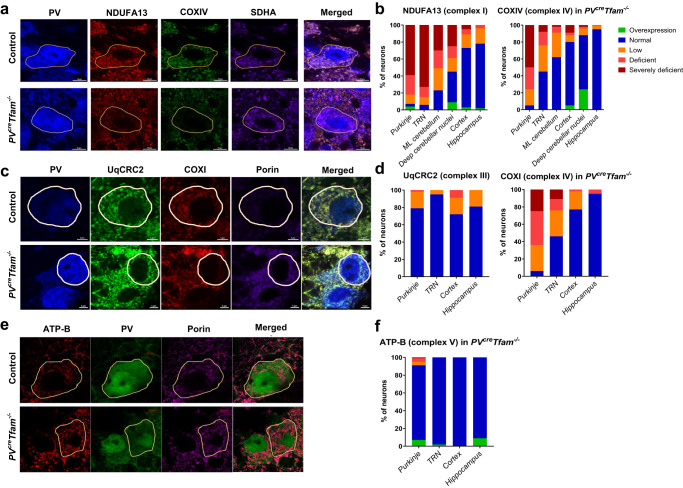
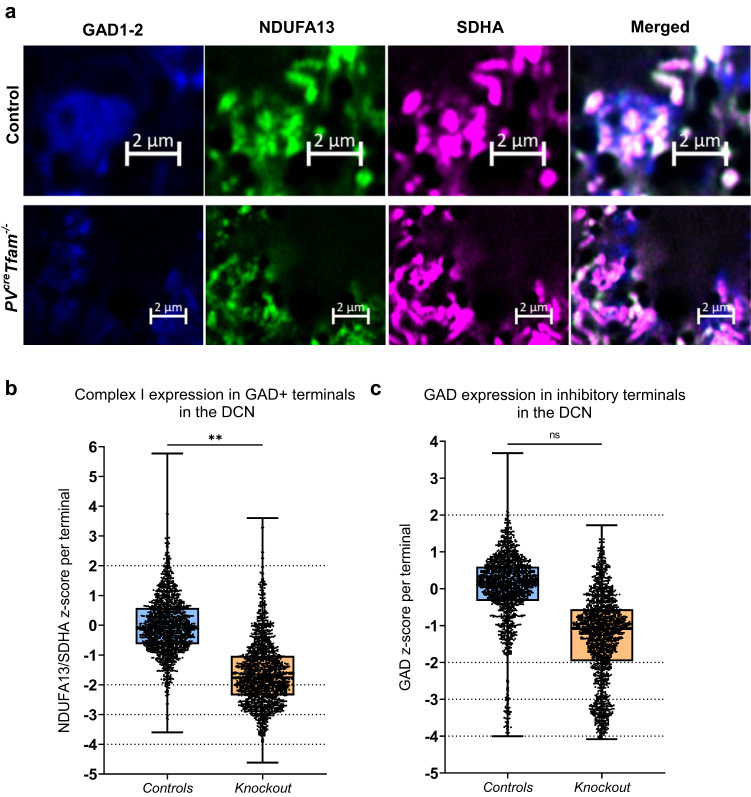
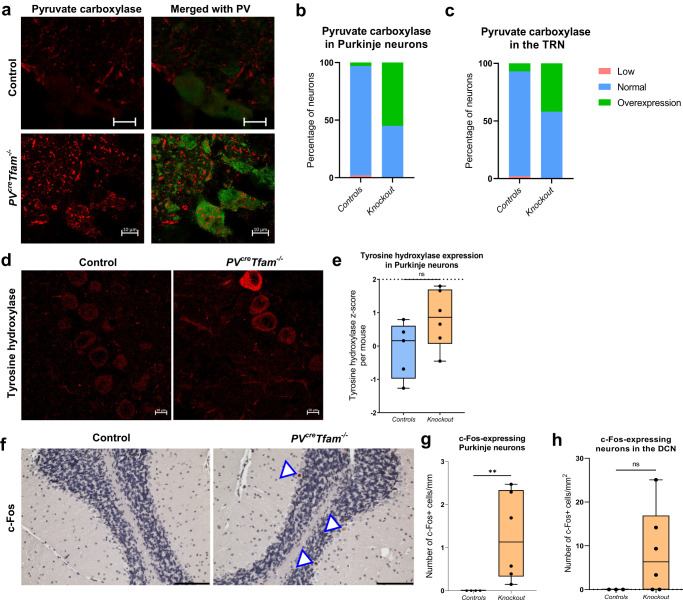
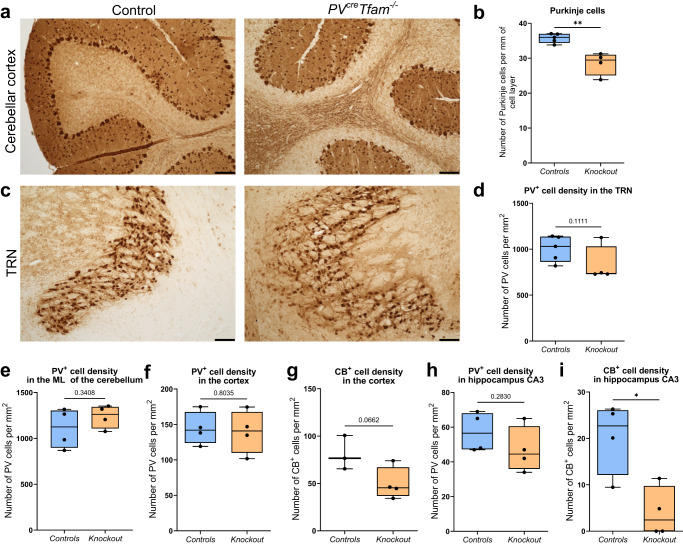
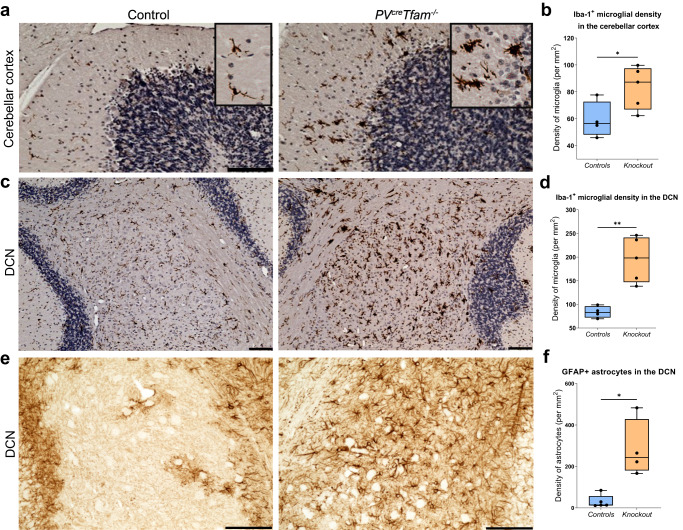
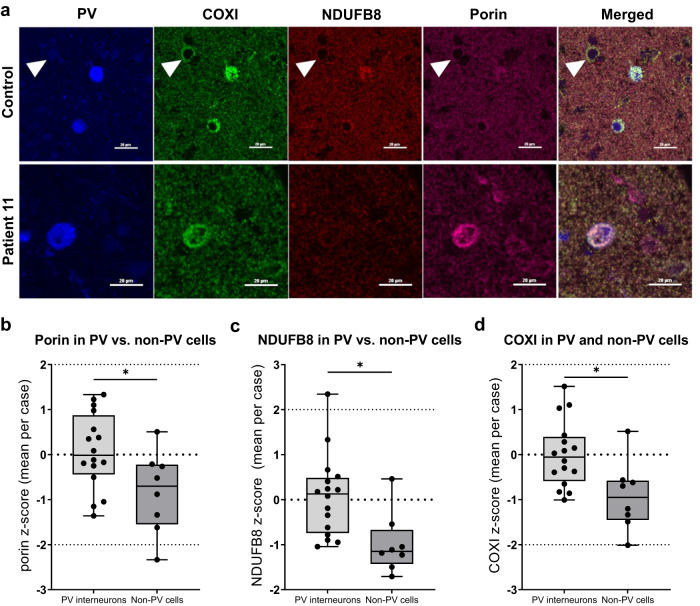
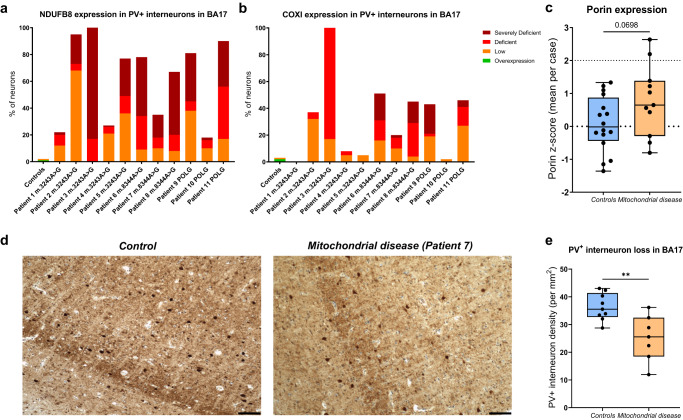
Mitochondrial diseases comprise a common group of neurometabolic disorders resulting from OXPHOS defects, that may manifest with neurological impairments, for which there are currently no disease-modifying therapies. Previous studies suggest inhibitory interneuron susceptibility to mitochondrial impairment, especially of parvalbumin-expressing interneurons (PV+). We have developed a mouse model of mitochondrial dysfunction specifically in PV+ cells via conditional Tfam knockout, that exhibited a juvenile-onset progressive phenotype characterised by cognitive deficits, anxiety-like behaviour, head-nodding, stargazing, ataxia, and reduced lifespan. A brain region-dependent decrease of OXPHOS complexes I and IV in PV+ neurons was detected, with Purkinje neurons being most affected. We validated these findings in a neuropathological study of patients with pathogenic mtDNA and POLG variants showing PV+ interneuron loss and deficiencies in complexes I and IV. This mouse model offers a drug screening platform to propel the discovery of therapeutics to treat severe neurological impairment due to mitochondrial dysfunction.


Conflict of interest statement

The authors declare no competing interests.

Figures

Fig. 1
Fig. 1. PVcreTfam−/− mice display juvenile-onset progressive symptoms reminiscent of mitochondrial disease at 8, 10 and 12 weeks of age.
a NOR test results demonstrate a four-fold reduction in median discrimination index, measured as the difference in time spent exploring novel and familiar objects, divided by the time spent exploring both objects during the retrieval trial of the test, in the knockout animals (n = 19) compared to littermate controls (n = 38) (P = 0.0043, Mann–Whitney test) at 8 weeks of age. b The mean percentage of open arm entries of the EPM is significantly lower in the knockout group (27%) in comparison to the littermate control (46%) group (P = 0.0079, t-test; n = 5 control and n = 6 knockout mice) at 8–9 weeks of age. c Visual Cliff test shows no visual depth perception impairment in the knockout animals at 8–9 weeks of age in comparison to controls (P = 0.4493, Mann–Whitney test; n = 5 control and n = 6 knockout mice). d Open-field test results with distance travelled in littermate controls (n = 24) and knockout mice (n = 9) at 10 weeks of age. e The mean number of stargazing episodes per minute, with two investigators independently quantifying the total number of episodes in a 10-min recording interval at 10 weeks of age. f The mean body weight in male knockout mice (n = 4) was significantly lower than in male control mice (n = 6) and did not reach significance between female mice (n = 5 control and n = 6 knockout mice) (P = 0.0413 and 0.1113, t-test, respectively). g The mean latency as well as h the speed of the rotating rod at which the animal lost its balance was significantly reduced by more than three- and two-fold, respectively, in the knockout mice (n = 8), compared to the littermate controls (n = 7) (P < 0.0001, t-test). i Kaplan–Meier curve indicates a significant reduction in the survival of the knockout animals (n = 12) with a median survival of 94 days in comparison to their littermate controls (n = 4) lifespan (P = 0.0008, Mantel-Cox log-rank test).
Fig. 2
Fig. 2. OXPHOS-functioning protein deficiencies in PV+ neurons in PVcreTfam−/− mice are brain region-dependent.
a Example quadruple confocal micrographs showing Purkinje cells with severe loss of NDUFA13 (complex I) and COXIV (complex IV) with intact SDHA (complex II, used as a mitochondrial mass marker) in the knockout mice. Scale bars – 10 µm. b Percentage of neurons in regions of interest with overexpressed (green), normal (blue), low (yellow), deficient (orange), and severely deficient (red) complexes I and IV subunit expression in the knockout mouse sections. Purkinje neurons were analysed in knockout animals (n = 276 neurons from 6 mice) and controls (n = 130 neurons from 3 mice); PV+ neurons of the TRN in knockout animals (n = 282 neurons from 6 mice) and controls (n = 119 neurons from 3 mice); PV+ interneurons of the molecular layer of the cerebellum in knockout animals (n = 224 neurons from 6 mice) and controls (n = 129 neurons from 4 mice); PV+ interneurons in somatosensory and visual cortical areas in knockout animals (n = 110 neurons from 6 mice) and controls (n = 47 neurons from 2 mice); PV+ interneurons across the hippocampal formation in the knockout mice (n = 55 neurons; 6 mice) and controls (n = 20 neurons; 3 mice). c Quadruple confocal images depicting PV, UqCRC2 (complex III), COXI (complex IV) and porin (mitochondrial mass). Scale bars – 5 µm. d Purkinje neurons were analysed in the knockout animals (n = 212 neurons from 6 mice) and controls (n = 122 neurons from 4 mice); PV+ neurons of the TRN in the knockout animals (n = 171 neurons from 5 mice) and controls (n = 111 neurons from 3 mice); PV+ interneurons in the somatosensory and visual cortical areas in the knockout animals (n = 57 neurons from 5 mice) and controls (n = 43 neurons from 3 mice); PV+ interneurons in the hippocampus in the knockout animals (n = 21 neurons from 5 mice) and controls (n = 16 neurons from 3 mice). e Triplex confocal images depicting ATP-B (complex V), PV and porin. Scale bars – 10 µm. f Purkinje neurons were analysed in the knockout animals (n = 205 neurons from 6 mice) and controls (n = 140 neurons from 5 mice); PV+ neurons of the TRN in the knockout animals (n = 167 neurons from 4 mice) and controls (n = 176 neurons from 4 mice); PV+ interneurons in the somatosensory and visual cortical areas in the knockout animals (n = 57 neurons from 3 mice) and controls (n = 69 neurons from 3 mice); PV+ interneurons in the hippocampus in the knockout animals (n = 23 neurons from 4 mice) and controls (n = 25 neurons from 3 mice).
Fig. 3
Fig. 3. Milder complex I deficiencies in GABAergic inhibitory axonal terminals surrounding deep cerebellar nuclei neurons in comparison to Purkinje neuron cell bodies.
a Example confocal micrographs demonstrating GAD1-2 (blue), NDUFA13 (green) and SDHA (purple) immunofluorescence of inhibitory synapses surrounding DCN neurons. Knockout section demonstrates a mild reduction in NDUFA13 signal in comparison to the control, whereas SDHA expression is intact. Scale bars –2 µm. b Boxplot demonstrating z-score data NDUFA13/SDHA distribution in GAD-positive inhibitory terminals within DCN (P = 0.0045, linear mixed-effects model analysis; n = 1594 and 1676 terminals analysed from 4 mice per group). Dashed lines represent z-scores at normal (2 < z < −2), low (<−2), deficient (< −3), and severely deficient (< −4). c Boxplot demonstrating z-score GAD1-2 distribution in the inhibitory terminals within DCN (P = 0.0739, linear mixed-effects model analysis; n = 4 mice per group).
Fig. 4
Fig. 4. Metabolic remodelling via pyruvate carboxylase expression, accompanied by signs of hyperexcitability such as ectopic expression of tyrosine hydroxylase and c-Fos expression in Purkinje neurons of the knockout mice.
a Example confocal micrographs of Purkinje neurons (PV, green) and pyruvate carboxylase (PC) co-staining (red) in littermate control and knockout mouse cerebellum. Scale bars – 10 µm. b Increase in the percentage of Purkinje neurons displaying overexpression of PC. P = 0.0681, linear mixed-effects model; n = 107 neurons from 3 control and n = 230 from 6 knockout mice. c Increase in the percentage of PV+ neurons of the TRN with PC overexpression in the knockout mice. P = 0.5743, linear mixed-effects model; n = 54 neurons from 2 control and n = 108 neurons from 3 knockout mice. d Example confocal micrographs of Purkinje neurons expressing tyrosine hydroxylase. Scale bars – 10 µm. e Quantification of optical density z-scores of tyrosine hydroxylase in individual Purkinje neurons revealed a non-significant increase in the knockout mouse group (P = 0.1022, linear mixed-effects model; n = 166 neurons from 5 control and n = 228 from 6 knockout mice). f Example light micrograph of c-Fos immunohistochemical staining in Purkinje neurons in the knockout cerebellum. Arrowheads show neurons with positive c-Fos signal detected within nuclei. Scale bar – 100 µm. g Graph demonstrates the number of c-Fos-immunoreactive Purkinje cells per unit length of the Purkinje cell layer (n = 4 control and n = 6 knockout mice). h c-Fos-expressing neuronal density in the DCN was non-significantly increased in the knockout group (P = 0.1667, Mann–Whitney test; n = 3 control and n = 6 knockout mice).
Fig. 5
Fig. 5. Changes in PV+ neuronal density according to the brain region.
a Immunohistochemistry of PV in the cerebellum demonstrating a loss of PV+ Purkinje cells in the knockout mice. b Number of PV-immunoreactive Purkinje neurons per length of the Purkinje cell layer (cells were only analysed if arranged in a single lamina) was significantly lower in the knockout mice (n = 4) in comparison to control (n = 5) mice (P = 0.0026, t-test). c Immunohistochemistry of PV neurons n the thalamic reticular nucleus (TRN) and d quantified PV+ cell density in the TRN (n = 5 control and n = 4 knockout mice). e Density of PV+ interneurons within the molecular layer of the cerebellum (n = 5 control and n = 4 knockout mice). f PV+ (n = 4 control and n = 4 knockout mice) and g CB+ interneuron density estimation in the somatosensory and visual cortical areas (n = 3 control and n = 4 knockout mice). h PV+ interneuron densities and i CB+ interneuron loss in the CA3 area in the hippocampus in the knockout mice (P = 0.283 and 0.0136, respectively, t-test; n = 4 mice per group). All scale bars — 100 µm.
Fig. 6
Fig. 6. Severe OXPHOS deficiencies in PV+ neurons of the cerebellum are sufficient to trigger secondary microglial and astrocytic changes.
a Light micrographs depict microglial activation in the cerebellar cortex of knockout animals. Inserts show microglia/macrophages in the molecular layer of the cerebellar cortex with distinct morphology between the groups: ramified and elongated processes in the littermate control group suggestive of quiescent microglia and amoeboid, enlarged cell bodies with retracted processes in the knockout group suggestive of microglial reactivity. Scale bars – 100 µm. b Mean density of Iba-1+ microglia/macrophages in the cerebellar cortex of the knockout animals was significantly greater than in controls (P = 0.0463, t-test; n = 4 control and n = 5 knockout mice). c Microglial activation in the DCN of knockout animals. Scale bars –100 µm. d Mean density of Iba-1+ microglia/macrophages in the DCN of the knockout animals was greater than in controls (P = 0.0028, t-test; n = 4 control and n = 5 knockout mice). e GFAP immunohistochemistry depicting reactive astrocytes in the DCN in control and knockout mice. Scale bars –100 µm. f Median density of reactive astrocytes was significantly increased in the DCN region (P = 0.0159, Mann–Whitney test; n = 5 control and n = 4 knockout mice).
Fig. 7
Fig. 7. Microglia display a reactive phenotype in the cerebellum and a greater proportion of Purkinje neuron contacts in the knockout mice.
a Microglial soma size is significantly increased in the knockout group (P = 0.0281, t-test; n = 341 microglia from 4 control mice and n = 549 from 5 knockout mice). b Microglial process length is shorter in the knockout group (P = 0.0121, t-test). c Absolute number of microglia in contact with Purkinje neurons (black) and not in contact (grey) within the cerebellum. The proportion of microglia displaying contact with Purkinje cells is increased in the knockout mice, although it did not reach significance (P = 0.1111, linear mixed-effects model analysis; n = 4 control and n = 5 knockout mice). d Mean microglial volume is significantly increased in the knockout group in the cerebellar cortex (P = 0.0021, t-test; n = 61 microglia from 4 control mice and n = 86 from 4 knockout mice) and e DCN (P = 0.0132, t-test; n = 15 microglia from 3 control mice and n = 34 from 3 knockout mice).
Fig. 8
Fig. 8. PV+ interneurons of the primary visual cortex display a greater overall expression of mitochondrial mass, complex I and complex IV subunits in comparison to non-PV-expressing cells in control tissue and patients with mitochondrial disease frequently demonstrate a decrease in complex I subunit expression.
a Example confocal micrographs demonstrating PV (blue), COXI (green), NDUFB8 (red) and porin (purple) immunofluorescence in primary visual cortex in control and patient 11 (POLG). Arrowhead points to a non-PV-immunoreactive cell that appears to have reduced mitochondrial mass, NDUFB8 and COXI expression in relation to PV+ interneurons in control tissues. Patient 11 PV+ interneuron shows almost complete loss of NDUFB8, decreased COXI, and increased porin signal. Scale bars – 20 µm. bd Boxplots demonstrating significantly increased porin, NDUFB8 and COXI (not normalised to porin) expression in PV+ interneurons vs. non-PV-immunoreactive cells in the occipital lobe of neurologically normal controls (P = 0.0235, 0.0131, 0.0131, respectively; t-test with Benjamini–Hochberg adjustment; n = 775 PV+ interneurons from 16 controls and n = 453 non-PV-immunoreactive cells analysed from 8 controls).
Fig. 9
Fig. 9. NDUFB8 (complex I) and COXI (complex IV) OXPHOS deficiencies detected in PV+ interneurons of the primary visual cortex in adult patients with mitochondrial disease.
a Bar chart demonstrates the percentage of neurons in each classification of normalised NDUFB8/porin expression in PV+ interneurons in the BA17 area. Coloured bars denote overexpression (green), low (orange), deficient (red) or severely deficient (dark red) expression. b Bar chart demonstrates the percentage of neurons in each patient of normalised COXI/porin expression in PV+ interneurons in the BA17 area in each group: low (orange), deficient (red) or severely deficient (dark red). In total, n = 775 neurons from 16 control subjects and n = 469 from 11 patients were analysed. c A statistical trend towards an increase in mean porin expression in PV+ interneurons in the mitochondrial disease group was observed (P = 0.0698, t-test). d Example images of BA17 area of the occipital cortex with PV+ interneurons in brown in control and mitochondrial disease patient 7. All scale bars –100 µm. e PV+ interneuron cell density in controls (n = 9) and mitochondrial disease patients (n = 7, patients 1, 2, 3, 6, 7, 9, 11) with a statistically significant reduction in the density of PV+ interneurons in the mitochondrial disease group (P = 0.0044, t-test).

References

    1. Gorman GS, et al. Mitochondrial diseases. Nat. Rev. Dis. Primers. 2016;2:16080. - PubMed
    1. Ng YS, et al. Mitochondrial disease in adults: recent advances and future promise. Lancet Neurol. 2021;20:573–584. - PubMed
    1. Iizuka T, et al. Neuronal hyperexcitability in stroke-like episodes of MELAS syndrome. Neurology. 2002;59:816. - PubMed
    1. Tzoulis C, Bindoff LA. Acute mitochondrial encephalopathy reflects neuronal energy failure irrespective of which genome the genetic defect affects. Brain. 2012;135:3627–3634. - PubMed
    1. Ng YS, et al. Consensus-based statements for the management of mitochondrial stroke-like episodes. Wellcome Open Res. 2019;4:201. - PMC - PubMed

Publication types