Review
. 2023 Nov 13;52(22):7848-7948.
doi: 10.1039/d0cs00936a.

Pursuing excitonic energy transfer with programmable DNA-based optical breadboards

Affiliations
Review

Pursuing excitonic energy transfer with programmable DNA-based optical breadboards

Divita Mathur et al. Chem Soc Rev. .

Abstract

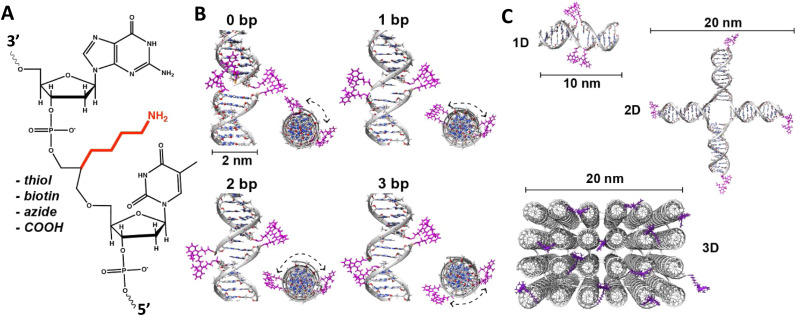
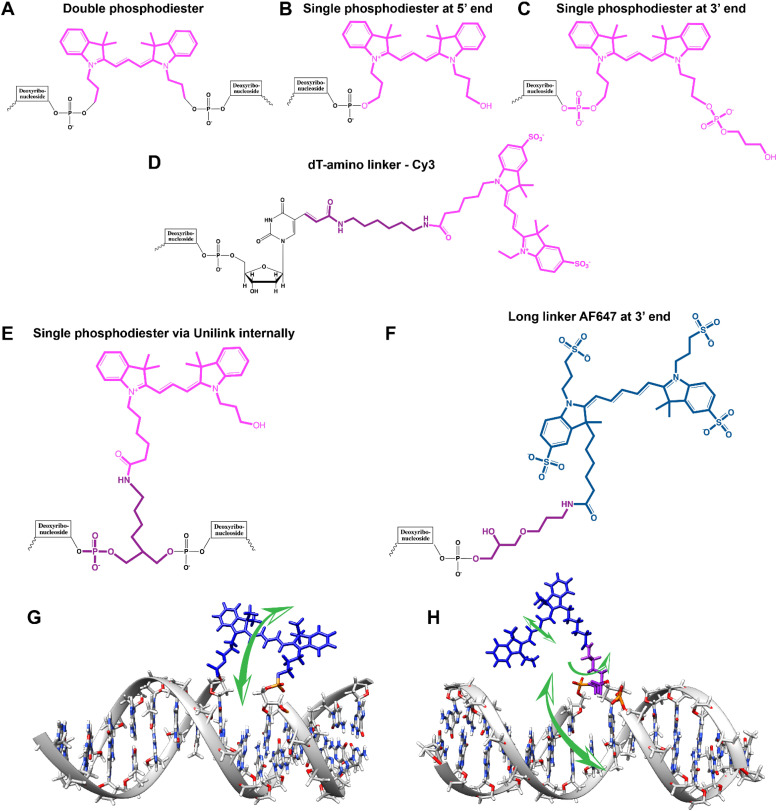
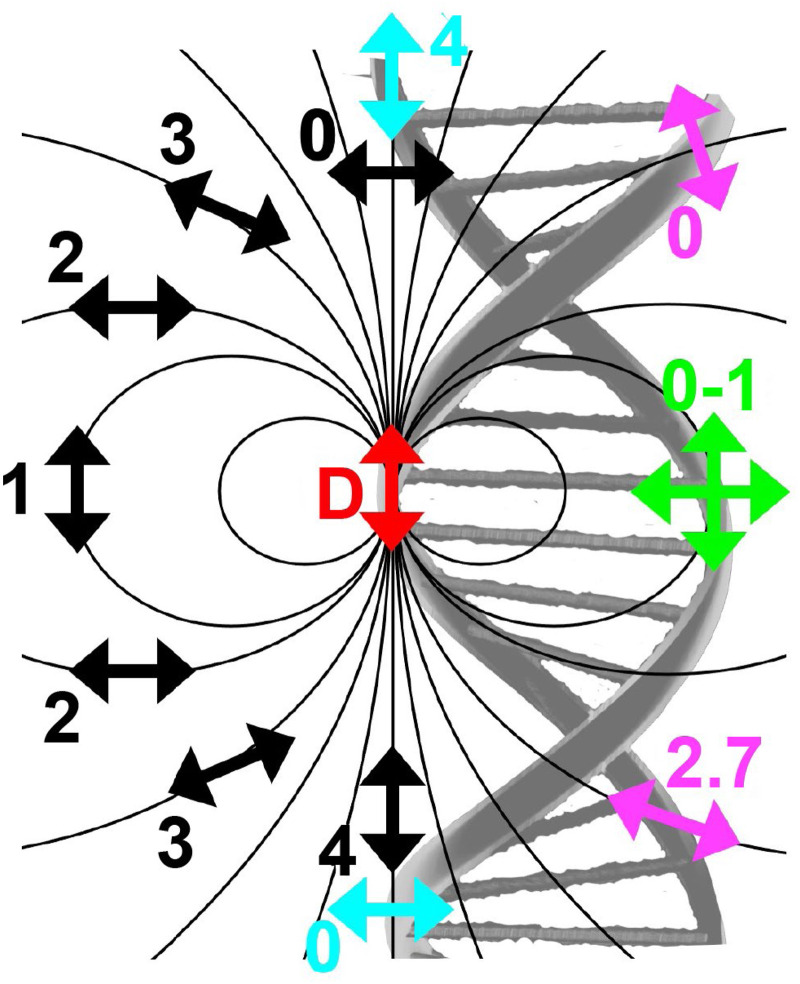
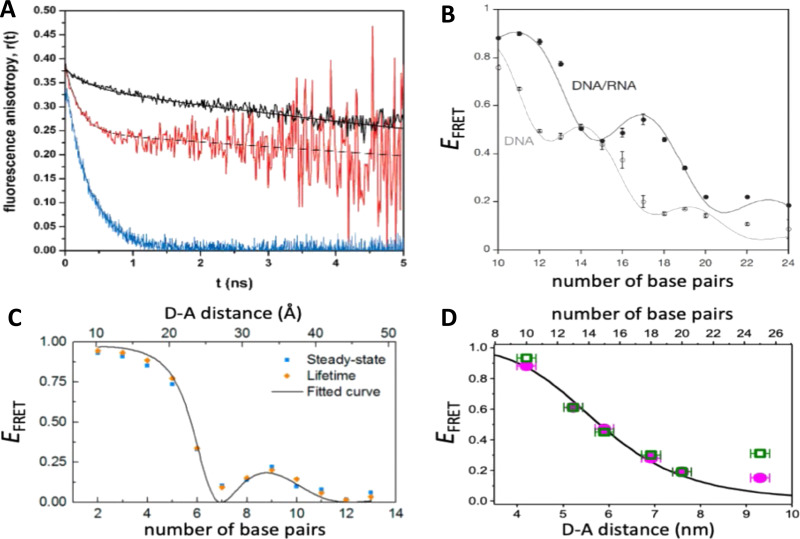
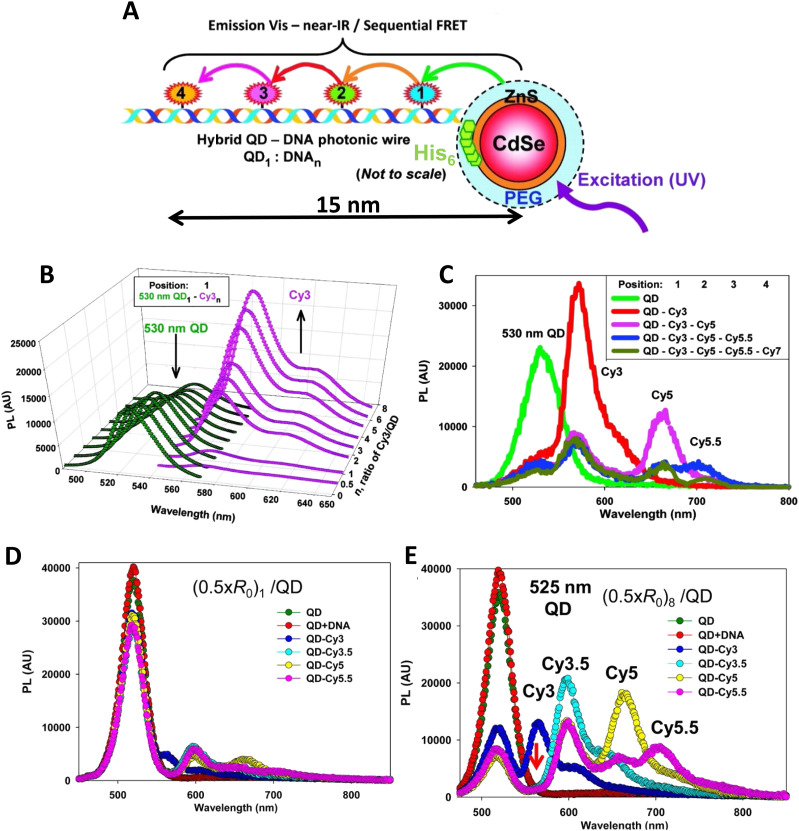
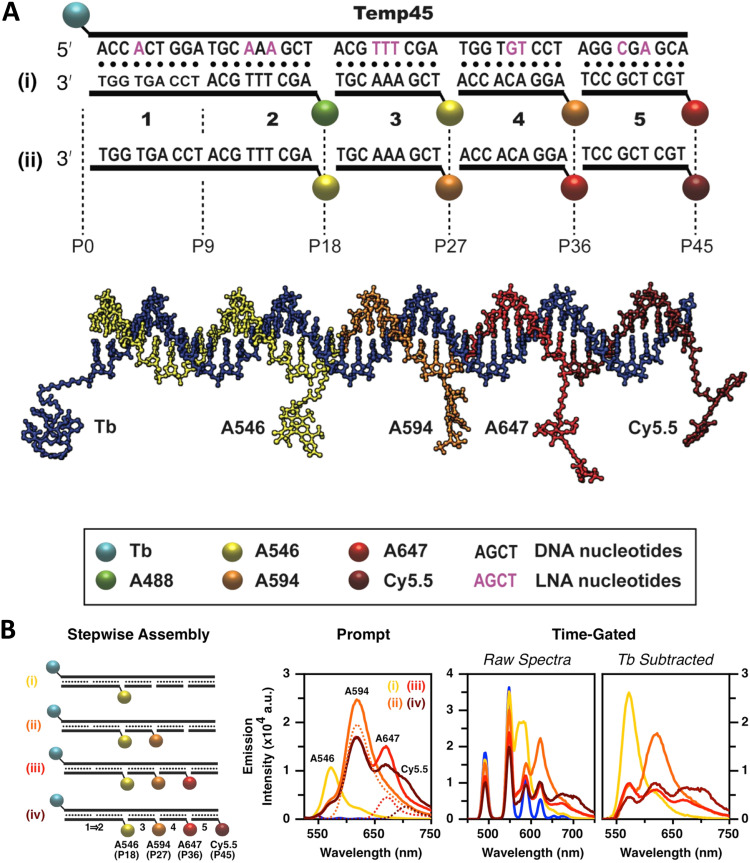
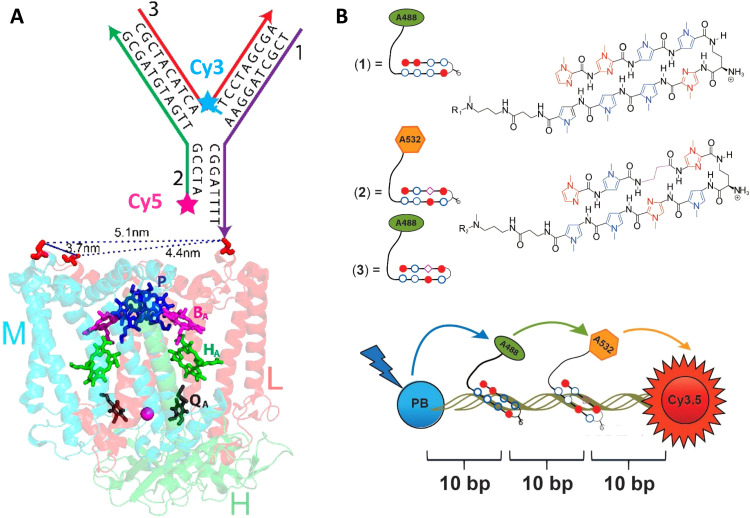
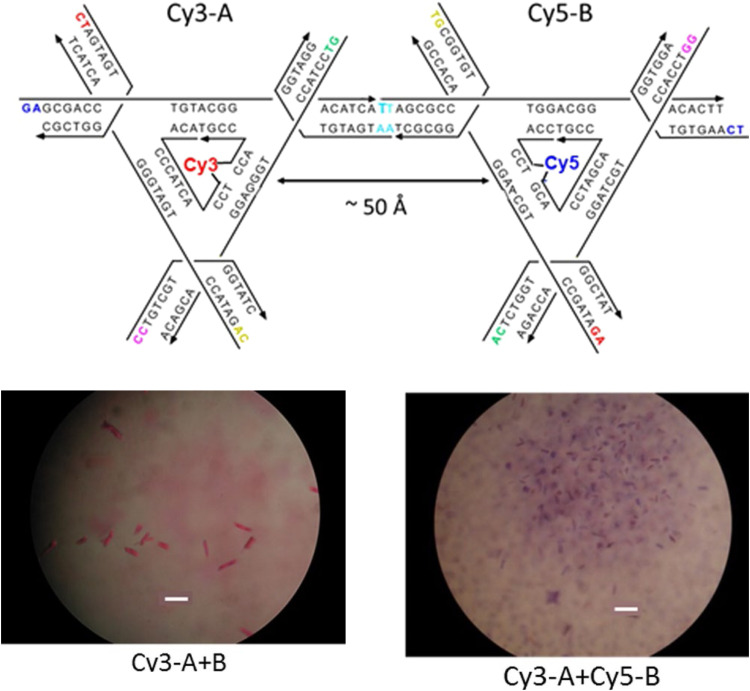
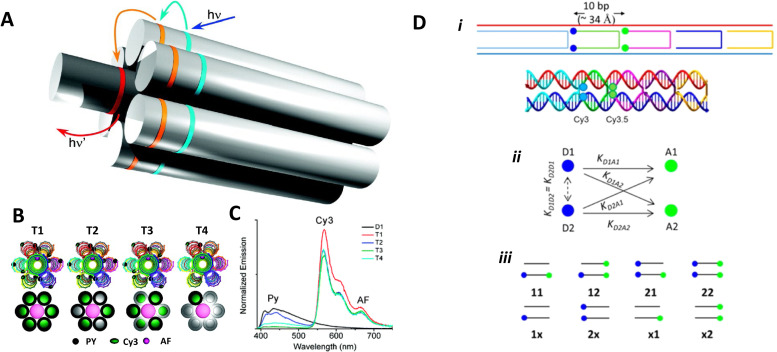
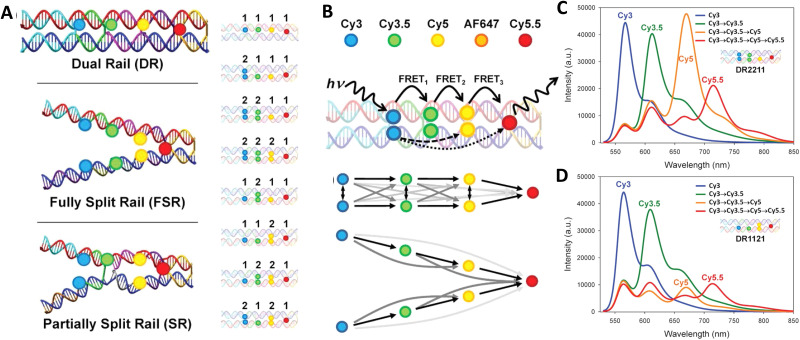
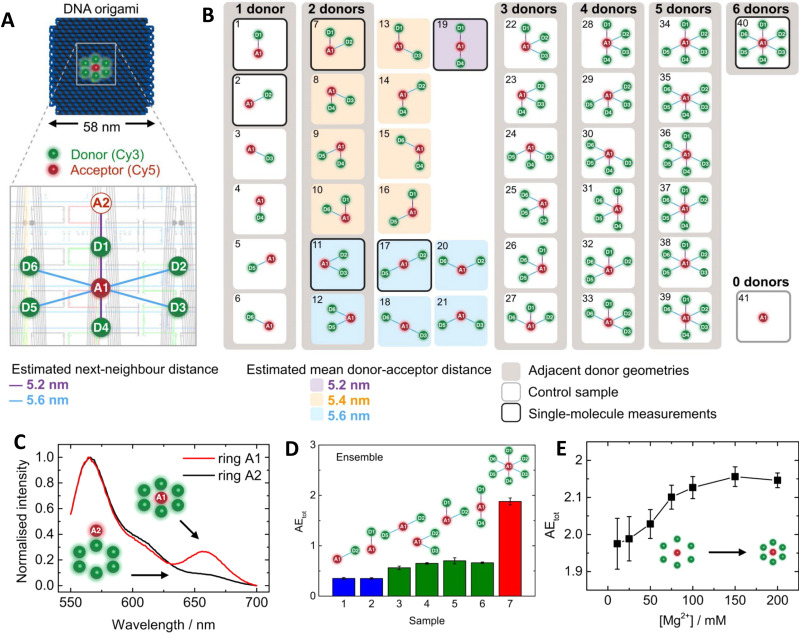
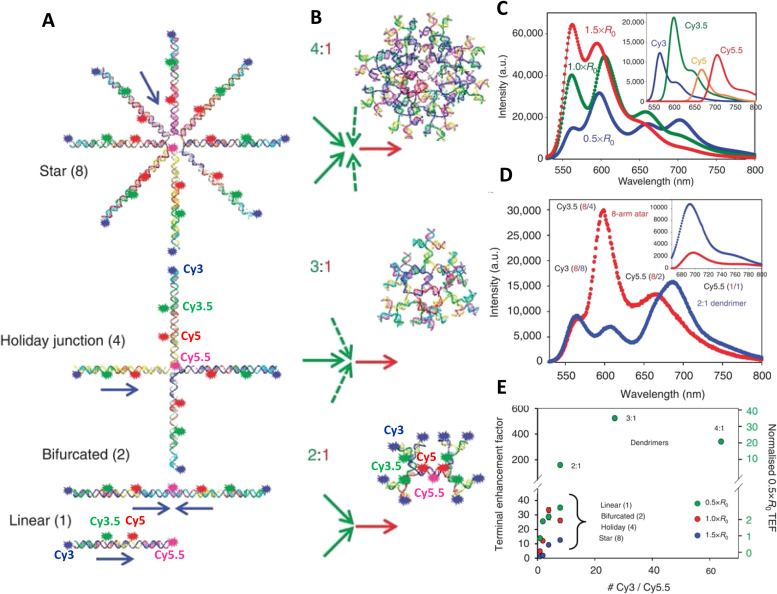
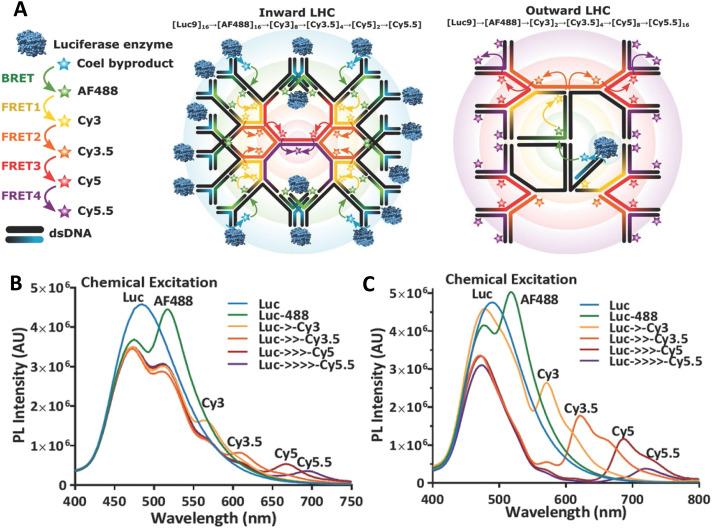
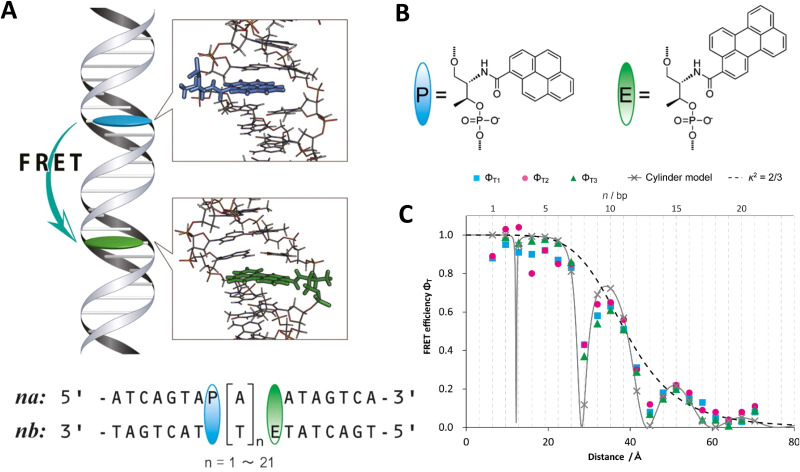
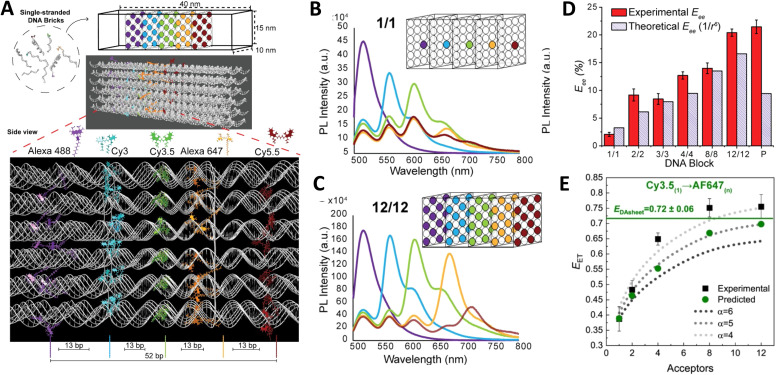
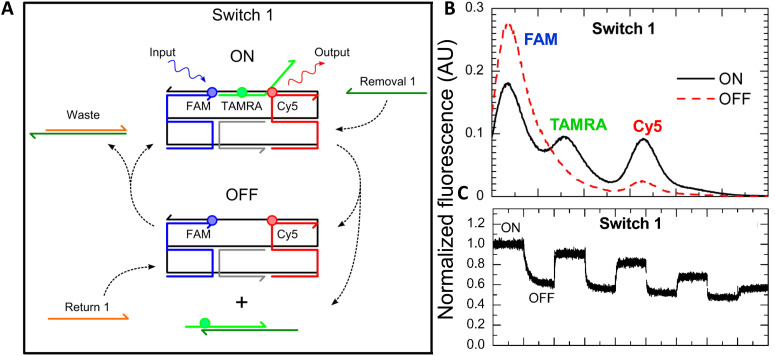
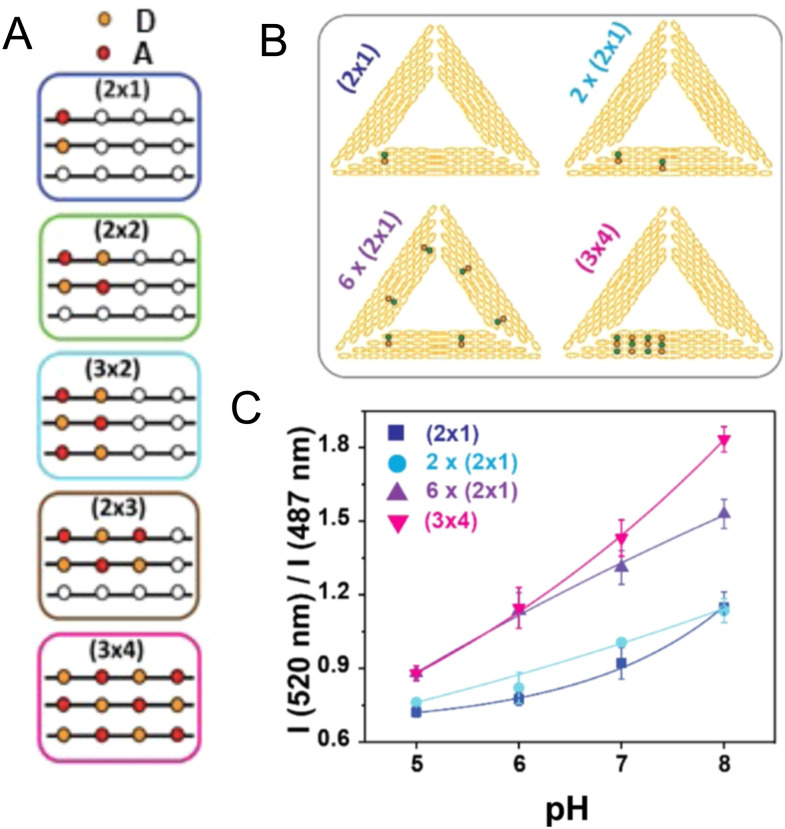
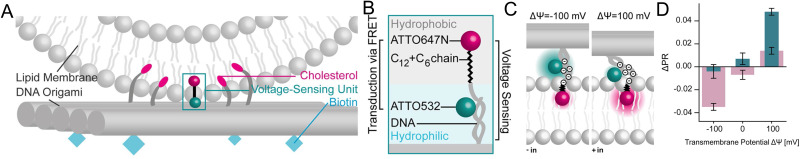
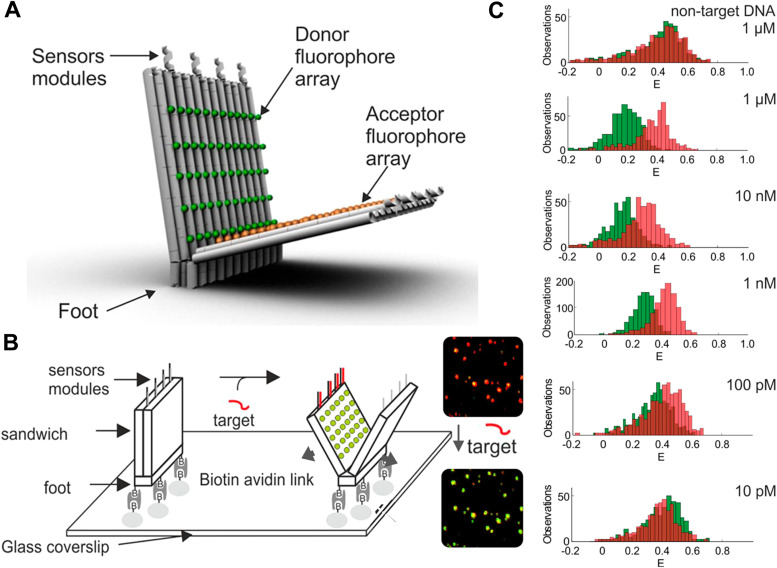
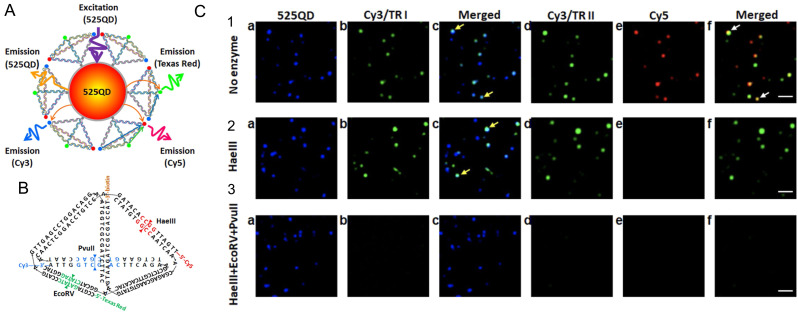
DNA nanotechnology has now enabled the self-assembly of almost any prescribed 3-dimensional nanoscale structure in large numbers and with high fidelity. These structures are also amenable to site-specific modification with a variety of small molecules ranging from drugs to reporter dyes. Beyond obvious application in biotechnology, such DNA structures are being pursued as programmable nanoscale optical breadboards where multiple different/identical fluorophores can be positioned with sub-nanometer resolution in a manner designed to allow them to engage in multistep excitonic energy-transfer (ET) via Förster resonance energy transfer (FRET) or other related processes. Not only is the ability to create such complex optical structures unique, more importantly, the ability to rapidly redesign and prototype almost all structural and optical analogues in a massively parallel format allows for deep insight into the underlying photophysical processes. Dynamic DNA structures further provide the unparalleled capability to reconfigure a DNA scaffold on the fly in situ and thus switch between ET pathways within a given assembly, actively change its properties, and even repeatedly toggle between two states such as on/off. Here, we review progress in developing these composite materials for potential applications that include artificial light harvesting, smart sensors, nanoactuators, optical barcoding, bioprobes, cryptography, computing, charge conversion, and theranostics to even new forms of optical data storage. Along with an introduction into the DNA scaffolding itself, the diverse fluorophores utilized in these structures, their incorporation chemistry, and the photophysical processes they are designed to exploit, we highlight the evolution of DNA architectures implemented in the pursuit of increased transfer efficiency and the key lessons about ET learned from each iteration. We also focus on recent and growing efforts to exploit DNA as a scaffold for assembling molecular dye aggregates that host delocalized excitons as a test bed for creating excitonic circuits and accessing other quantum-like optical phenomena. We conclude with an outlook on what is still required to transition these materials from a research pursuit to application specific prototypes and beyond.


Conflict of interest statement

There are no conflicts to declare.

Figures

Fig. 1
Fig. 1. Visual comparison of a ‘macroscale’ optical table hosting a laser setup to a simulated nanoscale dye-based excitonic relay system assembled on a DNA sheet in solution (blue to represent the aqueous environment) and which is being excited by an external laser. For the latter, a series of dyes are placed on the DNA sheet such that they engage in cascaded FRET with the movement of excitons guided by programmed elements that engage in both homo- and hetero energy transfer. For simplicity, dye placement in schematic does not conform to actual FRET requirements. Not all ET pathways including some homoFRET pathways are shown for simplicity. The ability to move and fix active optical elements across the table is mirrored in the addressability of individual DNA strands on the structure aforement. Top laser table image reproduced from https://en.wikipedia.org/wiki/Optical_table#/media/File:Laser.jpg (Tom Trower-NASA/Ames Research Center, in the public domain). Bottom schematic by D. Mathur.
Fig. 2
Fig. 2. Representative DNA structures highlighting size, increasing complexity, and select properties of what some different assembly approaches can provide. (A) The nucleobases on two nucleotides hydrogen-bonded to each other (2 nm wide) and a 16 bp dsDNA sequence (B-form DNA) that is 5.3 nm long. (B) Other notable dimensions of a dsDNA include the major and minor grooves and the spacing between adjacent base pairs. (C) Top: Representative DNA tetrahedron, a DNA double crossover tile (DX tile), a Holliday junction (HJ), and a DNA block assembled using the DNA brick approach. Bottom: left to right shows a wireframe polyhedral, a rectangular DNA origami, and a tetraplex of linked rectangular origami. (D) Magnified inset from the rectangular DNA origami in (C) showing the typical inter-helical spacing within a DNA nanostructure.
Fig. 3
Fig. 3. Schematic showing step-wise oligonucleotide synthesis via phosphoramidite solid-state chemistry. Synthesis is carried out by the addition of one nucleotide per coupling cycle, as shown here. Step 0: the dimethoxytrityl (DMT) protective group of the 3′end base that is bound to the controlled pore glass bead (CPG) is removed using deblocking reagents such as 3% trichloroacetic acid in dichloromethane. Step 1: The same process occurs during synthesis in which the DMT group on the last nucleotide attached to the CPG-oligo is deprotected. Step 2: Representative structure of the phosphoramidite derivative of a nucleotide is shown. It contains protective groups, namely, DMT (pink), benzoyl (blue), and diisopropyl amino and 2-cyanoethyl moieties (yellow). The next nucleotide-phosphoramidite is mixed with activating reagent such as 5-ethylthio-1H-tetrazole and introduced to the CPG for coupling. The activator renders the nucleotide-phosphoramidite reactive at the 5′ P-atom which leads to a phosphodiester bond with the last nucleotide on the CPG. Step 3: Unsuccessful coupling reactions are left with a reactive hydroxide group on the 5′ end of the CPG beads. These failed reactions are capped to replace the hydroxide with acetic anhydride using capping reagents such as 1-methylimidazzole in tetrahydrofuran/pyridine and tetrahydrofuran/acetic anhydride. Step 4: The oxidation state of the 5′ atom is changed from +3 to +5 using oxidizing reagent such as iodine in tetrahydrofuran/water/pyridine. The process is repeated until all nucleotides of a desired sequence are coupled from the 3′ end to the 5′ end. Below: Post-synthesis processing includes cleavage and release of the oligonucleotide from the CPG beads as well as hydrolysis of the bases and 5′ P atoms to remove the corresponding protective groups (shown in yellow and blue). Highly basic conditions such as ammonium hydroxide (7–30%) are typically used. The oligonucleotide can be used as is or further purified using reverse phase chromatography from any partial and incomplete sequences. Modified bases and dyes are inserted into the sequence using their phosphoramidite derivatives.
Fig. 4
Fig. 4. Representative in-synthesis modifications of DNA (denoted as X). (A) Scheme showing the general strategy for 5′-modification of DNA using a modified phosphoramidite without hydroxyl-handle for further chain elongation. (B) 3′-modification of DNA using a modified solid support. (C) Internal modification of DNA using a non-nucleobase phosphoramidite containing the modification. (D) Internal modification of DNA using a modified nucleobase in order to maintain Watson–Crick–Franklin base pairing in the oligonucleotide product. In this case modified dT is shown, but all four bases can in principle be employed, although dT and dA remain the most popular sites for modification. Note that the oligonucleotide products on the right-hand side are rotated 180° to display the sequences in the 5′ to 3′ direction. (E) Branching modifications can also be employed in DNA synthesis. Reproduced with permission from ref. Copyright 2019 American Chemical Society.
Fig. 5
Fig. 5. DNA modification and multidye placement on increasingly complex structures. (A) ssDNA synthesized to display a primary amine (internal universal-link amino modifier) on the end of a 4 carbon linker. This would then be labeled by amino-reactive dyes such as those functionalized with N-hydroxysuccinimidyl esters. Other common groups inserted for chemical modification are also listed. (B) Dye (pink) insertion into complementary strands with the number of bps separating the dyes indicated to highlight the effect of dsDNA (silver) twist (C) Dye placement highlighted on increasing larger and complex DNA structures including a 1D ds, a 2D HJ, and a 3D DNA brick-based structure where the dyes are found across an internal plane. Models in (B) and (C) were created in UCSF Chimera.
Fig. 6
Fig. 6. Representative DNA–dye conjugation strategies. (A) Double phosphodiester linkages (at 3′ and 5′ ends) for internally coupling a Cy3 dye (pink) for instance – to the oligonucleotide phosphate backbone. (B) End-coupling the Cy3 to the 5′ end of the oligo. (C) End-coupling a Cy3 to the 3′ end of the oligo. Note, often the 3′ end-coupled dye could have an addition C3 spacer group on the non-attached propyl chain that supports attachment to the CPG bead during synthesis. (D) Internally- or end-coupling Cy3 via a C6 amide linkage onto an amine-modified dT nucleotide. This labeling would usually occur post-synthesis using a N-hydroxysuccinimide (NHS-ester) activated version of the dye. (E) Internally coupling the dye but using a short C3 amide linkage and single point of dye attachment to an amine inserted into the DNA during synthesis. This would also be post-synthesis. (F) Internally coupling a different dye – Alexa Fluor 647 (indigo) to an amine on a linker inserted during synthesis – but using a longer linker. (G) The double phosphodiester linkage will severely restrict rotational motion in the dye – Cy5 (blue). (H) A single phosphodiester linkage allows for far more rotation about the linkage as well as along the polymethine bridge of Cy5. The former could promote dye interaction with the major groove while the latter could lead to photoisomerization.
Fig. 7
Fig. 7. Schematic representation of relative orientations of transition dipole moments of D emission (D-red double-headed arrow) and A absorption. The left side (black double-headed arrows) represents orientation in free space. The right side (colored double-headed arrows) represents attachment of D and As to DNA (orientations were chosen randomly to show values between 0 and 4). Same colors represent same D–A distances. Green arrows represent random orientation. The value of κ2 (numbers next to the A arrows) depends on the angle between the transition moment of A and the electric field of D at the location of A (ω) and the angle between the transition moment of D and the line connecting the centers of D and A (θ). κ2 = (1 + 3 cos2 θ) cos2 ω.
Fig. 8
Fig. 8. Distance and orientation dependence of FRET. (A) Time-resolved fluorescence anisotropy of free Cy3 (blue: fast rotation), Cy3 attached to dsDNA through a C6 flexible linker (red: fast and slow rotation), and DNA backbone internal modification (black: slow rotation). Reproduced with permission from ref. Copyright 2009 American Chemical Society. (B) EFRET for Cy3–Cy5-labeled dsDNA and hybrid RNA/DNA duplexes as a function of duplex length. Due to the rigidly stacked dyes on the duplex ends and the double-helix structure of the duplexes, EFRET shows distance (1/rDA6) and orientation (changing κ2) dependence, resulting in a decreasing “bouncing ball” type curve, which is different for B-form dsDNA and A-form hybrid RNA/DNA. Reproduced with permission from ref. Copyright 2008 by The National Academy of Sciences. (C) DNA with firmly incorporated fluorescent base analogues as D and A shows a similar “bouncing ball” type EFRET distance-orientation dependence due to the DNA double-helix structure. Reproduced with permission from ref. Copyright 2017 American Chemical Society. (D) EFRET for Tb-Cy5.5-labeled dsDNA, and PL lifetimes of Tb (green open squares) and Cy5.5 (magenta dots) as a function of duplex length. Due to the long excited-state lifetime of Tb (∼2.7 ms) and its isotropic emission, FRET in the DNA double helix is only distance dependent and dynamic averaging with a constant orientation factor (κ2 = 2/3) becomes applicable. Significant uncertainties become only visible for very long D–A distances beyond 9 nm. Reproduced with permission from ref. Copyright, 2017, John Wiley & Sons.
Fig. 9
Fig. 9. Molecular dynamics (MD) derived results for a free or DNA-bound Cy molecule in solution assuming different water models. (A) Computed transients in the fluorescence anisotropy. (B) MD-derived diffusion constants and relaxation times compared with experimental values. Reproduced with permission from ref. Copyright 2020 American Chemical Society. MD-derived histories for the spacing (C) and dipole orientation factor (D) of the nearest-neighbor dye pairs in a linear DNA construct labeled with four dyes, see Fig. 22 for a schematic of the structure. Reproduced with permission from ref. Copyright, 2021, John Wiley & Sons.
Fig. 10
Fig. 10. Molecular dynamic (MD) analysis of a DNA block scaffolded multi-dye structure. (A) Dye positions as estimated from the MD simulation with the small spheres representing the dyes. In the ideal crystal the planes would be flat and the vertical lines (that approximate every other constituent duplexes in the block) would be straight. The axes dimensions are in nm. See Fig. 27 for a schematic of the structure. MD estimated distribution of (B) distances and (C) dipole orientation factor between a central Cy3.5 and the plane of Cy5.5 dyes. Reproduced with permission from ref. Copyright 2021 American Chemical Society.
Fig. 11
Fig. 11. MD analysis of dye orientation in a DNA origami bundle. (A) Schematic of the DNA bundle (grey) with one staple strand (cyan) including a dye in three configurations, namely, End-attached (Abundle), Centered (Ebundle), and At a crossover (Fbundle). (B)–(D) Snapshots of the local bundle structures (Abundle, Ebundle and, Fbundle, respectively) from the MD simulations. The position of the Cy3 molecule is shown in cyan color. (E)–(G) Comparison of simulated (green curves) and experimental (red curves) normalized time-resolved anisotropy for Abundle, Ebundle, and Fbundle. Solid curves are fits to the data. Reproduced with permission from ref. Copyright 2021 American Chemical Society.
Fig. 12
Fig. 12. MD-derived dye distance and orientation probability distributions. (A) A linear duplex and (B) DNA bundle shown in Fig. 11 were compared for the dye spacings, dipole orientation factors and R0 values for Cy3–Cy5 pairs. The Cy3 position is shown in green whereas Cy5 was simulated in particular locations namely g1 in the “G dsDNA” duplex and G1 through G4 sites in the DNA bundle fragment shown in (B). The inter-dye distance, orientation factor, and Förster radius change is shown for (C) g1 site, (D) G4 site, and (E) F1 site (the structure is not shown here). Reproduced with permission from ref. Copyright 2021 American Chemical Society.
Fig. 13
Fig. 13. Ideal and non-ideal FRET simulations. (A) Experimental FRET efficiencies for transfer from a single Cy3.5 to a variable number of Cy5.5s arrayed in a plane compared with ideal simulations assuming dynamic dipoles. For the simulations the distance between the Cy3.5 and the plane is assumed to be 8.6 nm, while the distances between Cy5.5s is 5.6 nm. (B) Non-ideal simulations using the MD-derived spacings and orientations. One calculation assumes all dyes are present (100% Sim) while the other assumes a DNA structural assembly yield of 90%. See Fig. 27 for a schematic of the structure from which this data is derived. Reprinted with permission from ref. Copyright 2021 American Chemical Society.
Fig. 14
Fig. 14. KRM Model Simulations. (A) Graphical representation of the quantities εvm,α and Dm,α for vibronic mode α of dye m. εvm,α and Dm,α are extracted from optical data using the KRM Model Simulation Tool mentioned in the subsequent sections on exciton delocalization. Calculated (B) normalized absorbance spectra for increasing H-R factors starting from zero and (C) normalized CD spectra. Orientations and monomer properties held fixed. The vertical orange stick represents the 0-0 monomer transition energy of 1.92 eV. Unless the absorbance and CD are not perfectly electronic in nature (black curves) some degree of vibronic coupling is involved. Reprinted with permission from ref. Copyright 2021 American Chemical Society.
Fig. 15
Fig. 15. smFRET analysis of a 5-dye wire. (A) Synthesis strategy used to incorporate five different chromophores into dsDNA at well-defined positions. TMR was introduced via phosphoramidite chemistry. All other chromophores were covalently attached to amino-modified oligonucleotides using standard NHS chemistry. RhG-Rhodamine Green, TMR - tetramethylrhodamine, LCR-LightCycler Red. (B) False color fluorescence intensity image (10 × 10 μm) of photonic wires adsorbed on dry glass surface (488 nm excitation, 50 nm per pixel, 2 ms integration time, 10–100 counts/2 ms). The different colors demonstrate strongly different multistep FRET efficiencies. Histogram of spectral characteristics of 200 photonic wires (color columns) compared to the distribution as expected (calculated) from the ensemble emission spectrum (gray columns). Reproduced with permission from ref. Copyright 2004 American Chemical Society. (C) Confocal spectrally resolved fluorescence intensity images of hybridized photonic wires on a cover slide as each subsequent TMR, ATTO590, ATTO647N, and Cy5.5 labeled strand is added to the immobilized ss 60 mer carrying biotin on the 3‘-end and RhG on the 5′-end. (detection channels 1–4 are encoded in blue, green, yellow, and red). Reproduced with permission from ref. Copyright 2006 American Chemical Society.
Fig. 16
Fig. 16. Seven dye FRET cascade. (A) Schematic of the modular ds concatenated DNA scaffold highlighting the 9 different sequences used (A–I), how they assemble together, the position of each of the dyes and the six putative FRET steps. Fl – fluorescein, AF610 – Alexa Fluor 610, AF700 – Alexa Fluor 700. Discrete dye/FRET steps within a given construct are abbreviated as Fl → Cy5.5, for example. Note the schematic does not account for the DNA helicity in dye placement. (B) Normalized absorption/emission spectra of the 7 dyes used. (C) Averaged Eee values for each consecutive FRET step within the 7 dye construct. Inset magnifies values for the last 4 steps. Reproduced with permission from ref. Copyright 2014 The Royal Society of Chemistry.
Fig. 17
Fig. 17. Hybrid QD-DNA linear wires. (A) (His)6-modified DNA backbone self-assembled to the QDs via metal-affinity coordination. The resulting structure consists of a central QD with multiple, rigid dye-labeled DNA centro-symmetrically arrayed on its surface as designated by the QD1 : DNAn ratio. UV excitation of the system results in an energy transfer cascade from the central QD through the sequential aligned dye-acceptors. 1–4 indicate sequential dyes and are used to indicate dye position relative to the QD. (B) Deconvoluted PL spectra from 530 nm QD donors self-assembled with an increasing ratio of (His)6-peptide-DNA with Cy3 acceptor located in position-1. (C) Composite PL spectra from 530 nm QD donors self-assembled with unlabeled DNA, DNA with Cy3 in position-1, Cy3 in 1/Cy5 in 2, Cy3 in 1/Cy5 in 2/Cy5.5 in 3, Cy3 in 1/Cy5 in 2/Cy5.5 in 3/Cy7 in 4. Panels A-C reproduced with permission from ref. Copyright 2010 American Chemical Society. Representative FRET progression in second generation QD-DNA constructs where the QD displays 1 fully dye-loaded wire (D) or 8 full wires (E). FRET acceptors are placed on the wires with 0.5 × R0 inter-dye spacing. Green and red curves correspond to the emission spectrum of DHLA-PEG coated QDs alone and then in the presence of just 1 non-labeled DNA wire. Panels D, E reproduced with permission from ref. Copyright 2013 American Chemical Society.
Fig. 18
Fig. 18. Design of the Temp45 photonic wire and time-gated FRET. (A) Nucleotide sequences of the template and complementary segment strands; two arrangements of fluorescent dyes, (i) and (ii), and a model of the photonic wire in (ii). Boldface Arabic numbers are used to denote segment strands and Pn labels denote dye positions. (B) Evolution of the FRET cascade in the Tb/A546-initiated photonic wire. From left to right: stepwise assembly of the full photonic wire; representative prompt emission spectra (estimated direct excitation components are shown as dashed lines and arise from the UV absorption of the dyes); representative raw time-gated emission spectra; and corresponding Tb-subtracted time-gated emission spectra. The colors of the spectra correspond to the colors of the lowercase Roman numeral labels. Lag time and integration time of 32 and 350 μs, respectively, for time-gated measurements. 20 μs integration time used for prompt measurements. Reproduced with permission from ref. Copyright 2015 American Chemical Society.
Fig. 19
Fig. 19. DNA-sensitized reaction centers and polyamide driven assembly of dyes to DNA duplexes. (A) Modified structure of the reaction center (RC) from Rhodobacter sphaeroides 2.4.1 (PDB 2J8C10) with sequences of the three-arm-DNA construct shown. Cofactors of the RC are colored, those active in electron transfer reactions are designated by letters: P, bacteriochlorophyll pair; BA, bacteriochlorophyll monomer; HA, bacteriopheophytin; QA, ubiquinone. The arrows in the DNA structure point in the direction of the 3′-end of DNA strands. The 3′-amine-modified strand-1 (purple) of the three-arm DNA is conjugated to one of the Cys (shown in red) on the surface of the RC. Other two strands (strand-2 and -3, in green and red, respectively) hybridize to strand-1 to form the three-arm-DNA junction. Inter-Cys distances on the RC marked as dotted lines. Reproduced with permission from ref. Copyright 2014 American Chemical Society. (B) Top: Structure of the fluorophore-tethered pyrrole-imidazole polyamides where 1 binds the sequence 5′-ATGGACA-3′ while 2,3 bind to 5′-TACTGCT-3′. Bottom: Schematic of the ds 30 bp Pacific Blue (PB), Alexa 488 (A488), Alexa 532 (A532), Cy3.5 multiFRET construct. Reproduced from ref. with permission from Springer Nature, copyright 2013.
Fig. 20
Fig. 20. Dye incorporating DNA crystals. Top: Tensegrity triangle sequences that form the 3-D DNA crystals. Bottom: Micrograph image of DNA crystals with a Cy3 labeled A triangle and unlabeled B triangle. Micrograph image of DNA crystals with Cy3 labeled A triangle and Cy5-labeled B triangle. Scale bar in both images is 100 μm. Reproduced with permission from ref. Copyright 2016 American Chemical Society.
Fig. 21
Fig. 21. Seven-helix DNA bundle hosting cyclic arrays of three chromophores and dual rail structure. (A) Schematic of the self-assembled 7-helix bundle (7HB) nanoscaffold containing three distinct arrays of chromophores: the primary D, the intermediate relay R, and the A, represented by the cyan, orange, and red rings, respectively. Upon excitation of the primary D array, a stepwise energy transfer cascade occurs. The distance (along the helical axes) between the dyes in adjacent arrays is 3.5 bps. (B) Schematic representation of each triad. The black spheres, dark green ovals, and pink spheres represent Py, Cy3, and AF, respectively. A simplified representation of each triad is also shown below the corresponding helical schematic, where the colored circles represent the presence of the dye molecules on the DNA helices. Triads 1–4 contain ratios of 6 : 6 : 1, 6 : 3 : 1, 3 : 6 : 1, and 1 : 1 : 1 of the Py, Cy3, and AF dyes, respectively. (C) Normalized emission spectra of D1 and T1–T4, all with excitation at 380 nm. Reproduced with permission from ref. Copyright 2011 American Chemical Society. (D) i – Upper: Dual rail structure schematic self-assembled from seven DNA oligos. Cy3 and Cy3.5 positions at the ends of hairpin oligos indicated by solid blue circles and solid green circles, respectively. One Cy3 attached using a 3-carbon linker, while the other Cy3 uses a 6-carbon linker. Cy3.5s are each attached using a 3-carbon linker. Lower: Schematic of the dual rail DNA structure showing the double crossover motif and dye positioning. ii – Putative ET pathways from Cy3 (solid blue circles) and Cy3.5 (solid green circles). The solid black arrows indicate D–A hetero-FRET and dashed black double arrow is a homo-FRET coupling between the two Ds. iii – Schematics of the FRET structures and control structures. Reproduced with permission from ref. Copyright 2016 American Chemical Society.
Fig. 22
Fig. 22. Comparison of FRET pathway redundancy in dual versus split rail DNA constructs. (A) Schematic of DNA rail structures including dual rail (DR), fully split (FSR), and partially split rails (SR). Each is assembled from several constituent dsDNA oligonucleotides highlighted by colored strands. Full array of DR constructs each dye shown on right. (B) Cy3, Cy3.5, Cy5, AF647, and Cy5.5 dyes used as energy collection, transfer, and reporter elements. Potential ET pathways, including the three primary FRET channels (FRET1–3) and longer distance interactions, from the primary Cy3 donor. ET pathways in the DR construct highlighting multiple interacting pathways and split rail SR construct where the two branches are depicted acting primarily as two independent wires. Spectral evolution of the DR2211 (C) and DR1121 (D), representing the best and worst performing structures, respectively, with the addition of fluorophores Cy3.5, Cy5, and Cy5.5. Reproduced with permission from ref. Copyright, 2021, John Wiley & Sons.
Fig. 23
Fig. 23. Systematic evaluation of LH in a circular ring configuration. (A) Ring of Cy3 D dyes (green) surrounds a Cy5 A dye (red) on a flat, square-shaped DNA origami platform. The zoomed-in window shows the precise fluorophore attachment sites using a caDNAno scheme. (B) For each number of Ds N, all six permutations of adjacent D positions (gray boxes) were prepared and compared to an acceptor only control sample (gray frame). For N = 2, all possible dye geometries were assembled resulting in three groups of different mean D–A distances (colored boxes). The seven structures highlighted with black frames were analyzed both in ensemble and single-molecule measurements. (C) Normalized fluorescence emission spectra with A inside and outside the D ring. (D) AEtot obtained from ensemble measurements. Samples analyzed include one-D (blue), two-D (green), and six-D (red) assemblies. (E) Influence of Mg2+ concentration on antenna effect (AEtot) for the six-D ring with an A in the center. Increases in Mg2+ concentration to shrink the interhelix distances in DNA origami structures. Reproduced with permission from ref. Copyright 2016 American Chemical Society.
Fig. 24
Fig. 24. Comparison of linear versus dendrimeric photonic wires. (A) Linear [Cy3 → Cy3.5 → Cy5]n → Cy5.5 four-dye, three FRET step systems with sequential donor–acceptor arrangements of Cy3 (blue), Cy3.5 (green), Cy5 (red) and Cy5.5 (pink) in photonic wire configurations. The number of [Cy3 → Cy3.5 → Cy5]n wires leading into each terminal Cy5.5 dye increases from one to eight using linear, bifurcated, HJ and eight-arm star constructs. Blue arrows indicate directionality of the FRET cascade(s) along each wire in each structure as they converge on the terminal Cy5.5 A. (B) Dendrimer-based FRET systems in configurations where each dye preceding the central-terminal Cy5.5 A has two, three, or four Ds. D–A spacing for the dendrimers fixed at 0.5 × R0. The linear, HJ, and 2 : 1 dendrimer structure show approximate dye locations. (C) Representative comparative spectral data for the 0.5 ×, 1.0 ×, and 1.5 × R0 linear systems. Data were normalized to the direct Cy5.5 emission at the same excitation. Inset: Decomposed individual component spectra for the 0.5 × R0 linear system. (D) Comparison of normalized emission for the 0.5 × R0 2 : 1 dendrimer and eight-arm photonic wire star structures. Dye ratios corresponding to each position in each structure are indicated with red or blue numbers in parenthesis. Inset: Decomposed Cy5.5 sensitization for the 2 : 1 dendrimer (blue) is much larger than for the eight-arm star (red). (E) Plot of Cy5.5 terminal enhancement factor (TEF) for the [Cy3 → Cy3.5 → Cy5]n → Cy5.5 photonic wire and the 2 : 1, 3 : 1 and 4 : 1 0.5 × R0 dendrimer structures as compared with the initial 1.5 × R0 linear system (left axis). Right scale plots TEF for only the 0.5 × R0 structures as compared with the 0.5 × R0 linear four-dye system. Reproduced from ref. with permission from Springer Nature, copyright 2014.
Fig. 25
Fig. 25. MultiFRET BRET-FRET dendrimers. (A) Left - Schematic of the inward LHC, in which 16 Luc9 are displayed on the outside of the dendrimer and energy is transferred toward the terminal Cy5.5 at the center of the dendrimer through the multistep FRET relay with two Ds per A. Right-Schematic of the outward LHC, in which a single Luc9 is attached in the center and excitons travel from this central Luc9 to the peripheral Cy5.5 dyes via the same FRET cascade but with two acceptors per donor. (B) Emission profiles with sequential addition of fluorophores. Representative BRET/FRET progression for the inward LHC as the dyes are consecutively incorporated in the dendrimer structure. Emission from the Luc-only construct (blue) gets quenched as AF488 is introduced with a concomitant BRET sensitized emission from it (green). Effects of subsequent dye additions of Cy3 (yellow), Cy3.5 (orange), Cy5 (red), out to the final acceptor Cy5.5 (purple) via multiple dyes, are seen in the respective traces. Arrows in the legends indicate the presence of intermediate fluorophores. (C) Representative BRET/FRET progression of outward LHC as the dyes are consecutively incorporated in the dendrimer structure. Reproduced with permission from ref. Copyright, 2017, John Wiley & Sons.
Fig. 26
Fig. 26. Confirmation of dye position and orientation during FRET within DNA duplexes. (A) Top: Schematic of FRET system used in this study. Bottom: Sequence of FRET dsDNA pair. AT pairs were inserted between P (pyrene as D) and E (perylene as A). P and E moieties were introduced into strands na and nb, respectively, where n indicates the number of inserted A or T residues. (B) Structure of P and E fluorophores were directly conjugated via d-threoninol to the DNA strand. (C) Comparison of FRET efficiency obtained from static fluorescence measurement (ΦT1, cyan squares, ΦT2, magenta circles) and time-resolved fluorescence spectroscopy (ΦT3, green triangles) with theoretical values of cylinder model (gray line with cross symbols). The value of averaged orientation shown by dashed line. Reproduced with permission from ref. Copyright 2013 American Chemical Society.
Fig. 27
Fig. 27. Accessing sheet FRET in a DNA block assembly. (A) Schematic of the rectangular dye-labeled DNA block. Top: The DNA block self-assembles from ssDNA bricks into a prescribed 10 × 15 × 40 nm3 cuboidal structure shown schematically and as rendered in UCSF Chimera. Below: An enlarged side view highlighting the positioning of the five 2D planes arranged with an inter dye-plane separation of 13 bp. Each plane can display from 1 up to 12 dye copies with each dye copy positioned on alternating helices. The planes display Alexa 488, Cy3, Cy3.5, Alexa 647, and Cy5.5, respectively, to yield the full sequential initial D → relay → terminal A FRET cascade. (B) Steady-state fluorescence characterization of DNA blocks incorporating 1 (B) and 12 (C) ratios of dyes per plane. Each panel shows the evolution of spectra collected as downstream A dye(s) were added to the next plane in parallel assemblies. Nomenclature indicates the number of copies of each dye type incorporated in the structure, while the box structure schematically depicts this for the final plane-to-plane configuration. (D) Experimentally determined Eee estimated from steady-state fluorescence collected from fully labeled block assemblies (AF488 →→ Cy5.5) as the number of dye copies per plane is increased. Theoretical Eee assumes each D–A pair has a 1/r6EFRET distance dependency. (E) Experimental and predicted Eee values for a single Cy3.5 D to multiple A647 As distributed in a plane. The dashed curves are guides for the1/rαEFRET distance dependency exponent values of α = 4, 5, or 6. Predicted EDAsheet values show the predicted FRET in the sheet regime shown as the horizontal lines. Reproduced with permission from ref. Copyright 2021 American Chemical Society.
Fig. 28
Fig. 28. Cyclic switching of dynamic FRET-based transmission lines by DNA strand invasion. (A) When Switch 1 is in its ON state, the TAMRA-functionalized control strand (green) is attached to the scaffold (black), resulting in an intact transmission line. The Removal 1 strand (dark green) hybridizes with the control strand, removing the TAMRA dye from the scaffold and interrupting FRET, which switches the device to its OFF state. To restore FRET and return the device to its ON state, the Return 1 strand (orange) hybridizes with the Removal 1 strand, releasing the control strand and allowing the TAMRA dye to rejoin with the scaffold. (B) Full fluorescence spectra for Switch 1 in its ON and OFF states. (C) Switch reaction kinetics data demonstrating changes in terminal Cy5 A fluorescence intensity due to control strand removal and restoration. Reproduced with permission from ref. Copyright 2012 American Chemical Society.
Fig. 29
Fig. 29. DNA functionalized QDs for molecular logic. (A) TEM of the DNA functionalized ternary complex consisting of ZnHgSe (red), CdTe (green), and ZnCdSe (blue) QDs. (B) Ternary complex that has undergone disassembly and reassembly through strand displacement reactions. (C) Multi-round strand displacement reactions of RGB ternary complex with fuel and anti-fuel DNA. (D) Illustration of disassembly and reassembly of ternary QD complex through strand displacement reactions. (E) QD photonic logic gates operated by strand displacement reactions to yield QD PL output signals corresponding to the definitions of XOR and XNOR logic gates. Reproduced with permission from ref. Copyright, 2014, John Wiley & Sons.
Fig. 30
Fig. 30. Spectral analysis of representative external modification-based approaches. Each row represents one structural conformation. (A) The native DNA dendrimer was compared to (B) the Belt-6 dendrimer, with the smallest bridge length (6 bp) and the (C) star grabber with the ball conformation. The first column (i) displays a schematic of the dendrimer and what each modification is intended to do. Structures were analyzed with the (ii) two dye (Cy3 → Cy3.5), (iii) three dye (Cy3 → Cy3.5 → Cy5), or (iv) four dye (Cy3 → Cy3.5 → Cy5 → Cy5.5) cascades present. Black arrows indicate FRET steps. FRET efficiencies from penultimate donor (underlined) loss for each subsequent dye addition are shown in the upper right corner in each panel: (ii) Cy3 donor loss; (iii) Cy3.5 donor loss; and (iv) Cy5 donor loss. Raw data is shown as the solid blue line, with the reconstructed spectral fit as the blue dashed line. The contributions of each dye are separated by color; Cy3 (green), Cy3.5 (yellow), Cy5 (orange), and Cy5.5 (red). Reproduced with permission from ref. Copyright 2017 American Chemical Society.
Fig. 31
Fig. 31. Switching of single polymer conformations on a DNA origami scaffold. (A) Nanomechanical switching of poly(APPV-DNA) on DNA origami based on toehold-mediated strand displacement. Schematic illustration of guiding/removing ssDNA-assisted switching of poly(APPV-DNA) conformation. Complementary sequences are shown in the same color and denoted as X and X*, respectively. The arrowheads represent the 3′ end of DNA. (B) Time-dependent FRET measurement of nanomechanical switching. For FRET experiments, the initial state of poly(APPV-DNA) was the L-turned pattern. Fluorescence intensities of A 1 measured at its maximum emission wavelength, 618 nm (yellow line), and A 2 measured at its maximum emission wavelength, 670 nm (blue line), were used to follow polymer switching through energy transfer from the polymer to the acceptors. (C) FRET measurement of nanomechanical switching showing six successive events of programmed poly(APPV-DNA) switching. Reproduced with permission from ref. Copyright 2016 American Chemical Society.
Fig. 32
Fig. 32. Comparison of heterogeneous FRET and homogeneous FRET. (A) Jablonski diagram of heteroFRET, showing transfer from D to A and its subsequent emission. (B) Spectral overlap of Cy3-Cy3.5 D–A heteroFRET pair resulting in a J of 9.4 × 10¹⁵ M−1 cm−1 nm4. (C) Fluorescence lifetime of a donor molecule. As heteroFRET increases the average fluorescence lifetime, τ, decreases. (D) Jablonski diagram of homoFRET, the identical molecules can function as both D and A now. (E) Spectral overlap of Cy3-Cy3 D–A homoFRET pair resulting in a relatively smaller J of 4.0 × 10¹⁵ M−1 cm−1 nm4, though this is still reasonably good value for efficient FRET. (F) Fluorescence lifetime anisotropy of emitting molecules. See eqn (20) and (21) for how fitting values were derived. Fluorescence lifetimes are unchanged in the presence of homoFRET and, as such, the fluorescence lifetime anisotropy is necessary.
Fig. 33
Fig. 33. HomoFRET incorporating MPWs. (A) Schematic of dsDNA based MPW with a 3 TAMRA homoFRET relay. (B) Fluorescence spectra of homoFRET MPW and corresponding controls. (C) Cy5 fluorescence of spectra in panel B. Reproduced with permission from ref. Copyright 2004 American Chemical Society. (D) Schematic of DX tile-based DNA MPW with a 6 Cy3.5 homoFRET relay. (E) Fluorescence spectra of MPW as the number of relay steps increased, R1–R6, signifies 1 Cy3.5 to 6 Cy3.5 respectively. (F) Eee values as a function of the length of the MPW. Reproduced with permission from ref. Copyright, 2016, John Wiley & Sons.
Fig. 34
Fig. 34. HomoFRET on an origami breadboard. (A) Schematic of DNA origami breadboard containing triangular homoFRET relay. (B) Single particle FRET of the Cy3 relay dye to the final Cy5 accepter. (C) Fluorescence lifetime of Cy3 relay positions, it is notable that the lifetimes are similar but not indistinct as might be expected. (D) Fluorescence lifetime anisotropy of the same Cy3 configurations seen in C where localized influences on individual dyes were noted. Reproduced with permission from ref. Copyright 2017 American Chemical Society.
Fig. 35
Fig. 35. Extending homoFRET in a DNA bundle. (A) Schematic of six helix bundle origami MPW highlighting how different variants with different densities of homoFRET relay dyes can be assembled. (B) Solution based fluorescence spectroscopy of varying dye configurations within the MPW. (C) Random forest machine learning predicted wire transfer efficiency in comparison to experimental results. The trend highlights the general capability of models to describe the systems yet the deviations show that empirical confirmation is still optimal. Reproduced with permission from ref. Copyright 2020 American Chemical Society.
Fig. 36
Fig. 36. Exploiting intercalating dyes with homoFRET. (A) Schematic of the self-assembled YO relay in a dsDNA MPW. (B) Fluorescence spectra of MPW and controls at varying YO/bp ratios. (C) Simulated and experimental Eee values as a function of YO/bp ratio for short and long MPWs. Reproduced with permission from ref. Copyright 2008 American Chemical Society. (D) Schematic of the dual output DNA based photonic network. (E) The emission ratio of the acceptor dyes depends on the amount of YO/bp added to the system. (F) Modeling the fraction of excitation energy arriving at Cy3 as a function of time following the initial D excitation as a function of YO/bp. Reproduced with permission from ref. Copyright, 2011, John Wiley & Sons.
Fig. 37
Fig. 37. DNA nanotags. (A) Schematic of DNA nanotags and their formation based on intercalation of YOYO-1 dye into dsDNA assemblies. (B) Fluorescent DNA nanotags: linear (1-D), 3-way junction (2-D), and tetrahedron (3-D) Scale bar = 8.5 nm. (C) Fluorescence intensity of YOYO-1 as a function of the nanotag shape and the dye/bp ratio. (D) Photostability of the DNA nanotags. Interesting to note that not only is the tetrahedron structure more stable against enzyme and medium degradation but the YOYO-1 is also more photostable in the tetrahedron. Reproduced with permission from ref. Copyright 2009 American Chemical Society.
Fig. 38
Fig. 38. Different homoFRET repeats as antennae in a DNA dendrimer. (A) Schematic of the DNA dendrimer with extendable homoFRET arms to increase LH. R1-R6 correlates with the number of Cy3 homoFRET dyes. (B) Fluorescence spectra of R1–R6. (C) Eee and Eea of varying LH structures as a function of the number of Cy3 homoFRET steps (i.e. R1–R6). As expected, the larger/longer structures have lower values. (D) Fluorescence spectral deconstruction of the R6 dendrimer showing the emission from the final Cy5.5 acceptor. (E) Predicted (line plot) and experimental (bar plot) AG of varying LH structures as a function of the number of Cy3 homoFRET steps (i.e., R1–R6). Here it is demonstrated how initial homoFRET additions increase the AG but subsequent additions are either neutral or impair LH. Reproduced with permission from ref. Copyright, 2018, John Wiley & Sons.
Fig. 39
Fig. 39. HeteroFRET for homoFRET quantitation. (A) Schematic of dsDNA with pyrene homoFRET dyes separated by 2-13 bp. A single anthraquinone quencher is also integrated and the change in heteroFRET is correlated to the homoFRET of the pyrene dyes. (B) The homoFRET of the pyrene is best fit by the cylindrical dsDNA model, demonstrating that orientation is crucial for homoFRET transfer. (C) Fluorescence spectra of dsDNA containing variations of the pyrene/anthraquinone positions. (D) Fluorescence lifetime of dsDNA containing variations of the pyrene/anthraquinone positions. Reproduced from ref. with permission from Springer Nature, copyright 2021.
Fig. 40
Fig. 40. Proximity-induced h-aggregation of cyanine dyes on DNA-duplexes. Absorption spectra of the dye-DNA constructs. (A) Normalized absorption of the ssDNA and (B) dsDNA constructs. The light blue curves correspond to the Cy3 monomer, while the green and orange curves correspond to the Cy3 dimer with 1 base and 0 base distance, respectively. Reproduced with permission from ref. Copyright 2016 American Chemical Society.
Fig. 41
Fig. 41. Varying H- and J-aggregate structure with salt in DNA Holliday junctions (see Fig. 56 for HJ structure). Observed UV-vis absorbance spectra with varied (A) salt (DNA concentration held constant at 1.5 μM) and (B) DNA (added MgCl2 concentration held constant at 15 mM) concentrations. Changes in J-dimer (black squares and ordinate axes) and H-tetramer (blue circles and ordinate axes) fractions (based on their respective absorbance peaks) as a function of (C) salt (i.e., MgCl2) and (D) DNA concentrations. The dashed lines connecting the points in panel C are for visual aid only, while the curves in panel D were obtained by fitting the data. Each spectrum was acquired at room temperature. Reproduced with permission from ref. Copyright 2017 American Chemical Society.
Fig. 42
Fig. 42. KRM (KRM) Frenkel-Holstein Hamiltonian Model Simulation Tool fits and data. Absorbance (A), (D), (G), and (J) and CD (B, E, H, and K) spectral fits with corresponding structures (C), (F), (I) and (L) of the adjacent dimer, transverse dimer, trimer, and tetramer aggregates, respectively. Experimental data sets are shown as black open circles, while KRM theoretical fits are given as red curves. Fluorescence measurements were obtained by exciting the samples at their respective absorption maxima. Reproduced with permission from ref. Copyright 2018 American Chemical Society.
Fig. 43
Fig. 43. Optical Reporter Functionality (A) Schematic illustration and (B) experimental demonstration of the 4AJ tetramer undergoing strand-invasion using fluorescence detection (λfl = 666 nm). (C) Schematic illustration and (D) experimental demonstration of the 4AJ tetramer formation via DNA hybridization using UV-vis−NIR absorbance, or colorimetric, detection (λabs = 666 nm). Reproduced with permission from ref. Copyright 2018 American Chemical Society.
Fig. 44
Fig. 44. Bridged nucleotide-substituted, DNA duplex-templated cyanine aggregate structures. Examples of dimer configurations determined from KRM Model Simulation Tool outputs along with predicted Jm,n values. Reproduced with permission from ref. Copyright 2018 American Chemical Society.
Fig. 45
Fig. 45. Indolenine SQ aggregates templated by DNA HJ scaffolds. Molecular models of the Square 660 core region adjacent dimer SQ-BC and transverse dimer SQ-AC (see Fig. 46B). The side view shows a J1,2 parameter, in meV, a center-to-center distance r, in Å, and a slip angle θs, in degree. The oblique view shows oblique angle α, in degree, as an angle between vectors 1 and 2 if their centers are superimposed. Note that the fitting procedure determines the position and orientation of the long axes of the Square 660 dyes but not the rotation of the dye core around its long axis. As such, the dye core rotations were arbitrarily chosen. Reproduced with permission from ref. Copyright 2020 American Chemical Society.
Fig. 46
Fig. 46. Hydrophobicity and excitonic coupling in DNA-templated indolenine SQ dye aggregates (A) Chemical structures of indolenine SQ (bold) attached to C6 thymine sequence modifier T*(gray). (B) Schematic representation of immobile DNA HJs templating DQ monomer SQ-A, adjacent dimer SQ-BC, transverse dimer SQ-AC, and a tetramer SQ-ABCD. The strands comprising DNA HJ are labeled A, B, C and D. This publication represents a partnership between Boise State University and SETA BioMedicals to address this topic area by designing custom synthesized SQ dyes to permit the necessary tuning of the side substituents. Reproduced with permission from ref. Copyright 2022 American Chemical Society.
Fig. 47
Fig. 47. Exciton chirality inversion and delocalization in DNA-templated organic semiconductor dimer assemblies. (A) Structures of the two pairs of dimers of bis(chloroindolenine) SQ dye that enabled strongly coupled molecular excitons of opposite chirality in solution as seen in the CD spectra. Reproduced with permission from ref. Copyright 2022 American Chemical Society. (B) Octaniline-DNA compositional monomer spontaneously assembled into the chiral dimer by adding triggering DNA strand. (C) Absorbance and CD spectral theoretical fits. Experimental data sets are shown as black lines, while theoretical fits are given as red curves. Reproduced with permission from ref. Copyright 2022 American Chemical Society.
Fig. 48
Fig. 48. Exciton delocalization in DNA-templated pyrene stacks. (A) Schematics of DNA organized pyrene stacks. The central image presents the chemical structure for the constructs which consist of two complementary DNA strands into each of which has been inserted a pyrene oligomer consisting of n pyrene units. The upper image depicts the case of a pyrene aggregate, consisting of a stack of 14 pyrene units exhibiting a right-handed helical pitch, sandwiched between two duplex-DNA strands. The lower image depicts the case when dsDNA is absent at one end of the pyrene stack. (B) CD spectrum for various constructs consisting of pyrene stacks imbedded in a DNA duplex. A pyrene stack is absent in structure 1*2 hence, the CD spectrum exhibits the spectral features of duplex DNA alone. For structures 9*10, 11*12, and 13*14, the number of pyrenes in the stack are 8, 10, and 12, respectively. The CD spectrum of structure 9*10 exhibits no CD features at wavelengths longer than 300 nm, whereas features in this region appear for structures 11*12 and 12*14, indicating that the transition to helical ordering occurs when the number of pyrene units becomes greater than 10. Reproduced with permission from ref. Copyright, 2009, John Wiley & Sons.
Fig. 49
Fig. 49. Exciton delocalization in a DNA three way junction. (A) Energy minimized modeling of the 3WJ-7 aggregate from the structure judged most consistent with observation. The three way junction is assembled from oligomers possessing chromophores or other modifications at their centers in order to bring these modifications in close proximity, as indicated by the colored chevrons. The structure formula for the alkynylpyrene modification is labeled X (green). The structure formula for the perylenediimide modification is labeled E (red). (B) CD spectra of the two homo-chromophoric 3WJs. 3WJ-5 (three alkynylpyrenes) and 3WJ-8 (three perylenediimides). (C) Normalized temperature-dependent UV-vis spectra of the 3WJ-7 structure. Reproduced with permission from ref. Copyright 2012, the Royal Society of Chemistry.
Fig. 50
Fig. 50. Modular LH complex built on the DNA three-way junction. (A) Schematic illustration of the LH 3WJ with the chromophores used and highlighting how the modularity of the structure provides for wide access to different configurations. Phenanthrene (P), pyrene (S and X), perylenediimide (E), and the commercially available cyanine (Cy5). (B) UV-vis spectra of the investigated three-way junctions; acceptors are given in brackets. (C) Build-up of 3WJ-5: fluorescence spectra after stepwise addition of strands. Reproduced with permission from ref. Copyright 2014, the Royal Society of Chemistry.
Fig. 51
Fig. 51. Exciton delocalization and comparison of theory to experiment. (A) A diagram showing the energy levels of an H-pentamer (middle) arising as a result of exciton delocalization over an array of five dyes. The magnitude of the total transition dipole for each state is given along with a schematic of the expected asymmetric absorbance spectrum. (B) Schematic illustration of the design of an H-aggregate (ladder-like assembly) prepared from methyl red on d-threoninol. (C) The UV–vis spectra as a function of the number of the dyes in the aggregate. Reproduced with permission from ref. Copyright 2012, Elsevier.
Fig. 52
Fig. 52. Heterodimer aggregates and comparison of theory to experiment. (A) Structure diagrams for the dyes and their linkage to the D-threoninol scaffold. The DNA constructs incorporating the dyes are also shown. (B)–(D) Absorbance spectra of the dye pair monomers (red) and (blue), the sum spectrum (green), and the dimer spectrum (black) for the dimers containing azobenzene, thio-azobenzene and nitro red, respectively. The methyl red monomer spectra are red. Reproduced with permission from ref. Copyright 2012, Elsevier.
Fig. 53
Fig. 53. Use of insulator pairs. The use of an artificial base that is optically neutral to investigate exciton delocalization between a dye and natural bases in a DNA duplex. (A) The structure P of the dye (pyrene), the artificial base H (trans-isopropylcyclohexane), and schematics of the DNA constructs. (B) The UV-vis absorbance spectrum of the DNA constructs with and without the neutral base pairs. Note the shift to longer wavelength and lower absorbance of the construct without the neutral base pairs. This shift indicates delocalization into the natural DNA bases of the exciton associated with the dye. Reproduced with permission from ref. Copyright 2012, Elsevier.
Fig. 54
Fig. 54. Exciton delocalization in a highly sensitive molecular beacon. (A) Energy diagram of the heterodimer of fluorophore and quencher depicted on the basis of the exciton model. Each arrow, outlined by an ellipse or an oblong, designates the transition dipole moment. (B) Depiction of how excitonic interaction can be utilized to design a highly sensitive in-stem molecular beacon (ISMB) in which both a fluorophore and a quencher on D-threoninols are incorporated as a pseudo base pair (as shown with the optimized combination with Cy3-green and modified Methyl Red-red). Minimization of the difference between λmax of the fluorophore and quencher maximized quenching efficiency. Reproduced with permission from ref. Copyright, 2010, John Wiley & Sons.
Fig. 55
Fig. 55. Exciton delocalization in hybridization-sensitive on–off DNA probe. (A) Structure of the TO homodimer TOTO. (B) Structure of the newly synthesized fluorescent nucleotide, 1(n) where n refers to the length of the carboxyl linker utilized. (C) Absorption, excitation, and emission spectra of n = 4 containing oligodeoxynucleotides or ODN. Absorption spectra are shown in the left-hand panel and excitation and emission spectra are shown in the right-hand panel. Black trace: single-stranded ODN (ss); gray trace: ODN hybridized with the corresponding complementary DNA (ds). Reproduced with permission from ref. Copyright, 2008, John Wiley & Sons.
Fig. 56
Fig. 56. Schematics of DNA-templated cyanine (Cy) aggregates and associated optical spectra. (A) Type 1 DNA–dye constructs formed by mixing two complementary Cy5-labeled oligonucleotide strands in an aqueous buffer solution in the absence (left) and presence (right) of added MgCl2. Duplex DNA is the primary nanostructure in the absence of added MgCl2, whereas DNA HJs are formed when MgCl2 is added. There is one Cy5 dye per strand, and therefore, the duplex and HJ template the aggregation of a Cy5 dimer and tetramer, respectively. (B) Normalized absorption spectra of the duplex dimer and “mobile” HJ tetramer. The lower part of panel (B) depicts schematic illustrations of the duplex dimer and HJ tetramer, where cyan circles indicate the approximate location of Cy5 dyes. (C) Type 2 DNA–dye constructs formed by mixing four mutually complementary oligonucleotide strands in an aqueous buffer solution with MgCl2 added. The solutions primarily consist of “immobile” HJs. Cy5 dyes are covalently tethered to two, three, or four positions within the HJ. (D) Normalized absorption spectra of the two dimer species (adjacent and transverse), trimer, and tetramer formed via “immobile” Hjs. The lower part of panel (D) depicts schematic illustrations of the dimer, trimer, and tetramer structures, where cyan circles indicate the approximate location of Cy5 dyes. The schematic depictions of the dye-labeled duplex and HJ structures are not meant to imply specific geometric configurations of the dye or DNA backbone. Reproduced with permission from ref. Copyright 2021 American Chemical Society.
Fig. 57
Fig. 57. Tunable excitonic coupling in DNA-templated SQ:rotaxane dimer aggregates. (A) SQ:rotaxane dyes 1, 2, and 3 covalently attached to a DNA oligonucleotide using a thymine base modified with a six-carbon linker (C6dT). To help visualize the different parts of the rotaxane, the SQ and macrocycle are drawn in gray and blue, respectively. To facilitate comparison between structures, sulfonic acid, fluorine, and alkyl phenyl substituents are drawn in orange, red, and green, respectively. (B) Spectra at selected time delays for dimer 3 pumped at 695 nm. Black arrows are plotted alongside the transient absorption spectra pointing in the direction of increasing time delay. (C) Kinetic traces for each SQ:rotaxane dimer taken at the maximum amplitude of each respective GSB feature. Additionally, the corresponding kinetics for monomer 3 are shown; only monomer 3 was plotted because all monomers had a similar lifetime of ca. 2.4–2.6 ns. Reproduced with permission from ref. Copyright, 2022, John Wiley & Sons.
Fig. 58
Fig. 58. Electronic transitions of Cy3 dimers upon the addition or removal of central crossover strand bases. (A) Chemical structure of the Cy3 dimer. (B) Schematic of the Cy3 dimer that is covalently bridged within a DX tile. The tunable central crossover strand and long strand are shown in gray. (C) Schematic and sequences for Cy3-DX tiles upon the addition (left, “pull”-type) and removal (right, “push”-type) of central crossover and long strand bases. Modified strands are highlighted in light red and light blue for the “pull”-type and “push”-type DX tiles, respectively. Absorption (solid) and emission (dashed) spectra of (D) “pull”-type and (E) “push”-type dimers. Emission spectra are normalized by relative quantum yield for 530 nm excitation. Circular dichroism spectra of (F) “pull”-type and (G) “push”-type dimers. Fluorescence decay traces with 520 nm excitation for dimers formed with the (H) addition, or “push”-type, and (I) removal, or “pull”-type, of central crossover strand bases. Emission was detected at 580 nm. Reproduced with permission from ref. Copyright 2022 American Chemical Society.
Fig. 59
Fig. 59. Tuning between quenching and energy transfer in DNA-templated heterodimer aggregates. Transient visible absorption of (A) Cy5 monomer, (B) Cy5.5 monomer, and (C) transverse heterodimer solutions pumped at 650, 690, and 615 nm, respectively, corresponding to each solution's absorption maximum. Surface plots are on the top, selected spectra are (at 5 ps) in the middle, and selected kinetics are plotted at the bottom. In the surface plots, vertical lines are included at the probe wavelength corresponding to the selected kinetics at the bottom. Selected spectra in the middle row show spectrally distinct ground-state bleach, stimulated emission, and excited-state absorption features for all samples. In the selected kinetics plots corresponding to the ground-state bleach maxima, fits from a global target analysis overlay the kinetics traces. The global target analysis derives lifetimes of 1.7 ns, 930 ps, and 31 ps for Cy5 monomer, Cy5.5 monomer, and transverse heterodimer, respectively. Reproduced with permission from ref. Copyright 2022 American Chemical Society.
Fig. 60
Fig. 60. Temperature-dependent conformations of cyanine dimer labeled ss–ds DNA junctions. Experimental and simulated spectroscopic measurements performed at room temperature for (iCy3)2 dimer ss–dsDNA constructs as a function of probe labeling position. (A) iCy3 monomer +15 ss-dsDNA construct, (B) (iCy3)2 dimer +15 ss–dsDNA construct, (C) iCy3 monomer −1 ss–dsDNA construct, and (D) (iCy3)2 dimer −1 ss-dsDNA construct. The experimental CD (top row) and absorbance spectra (second row) are shown (in green) overlaid with vibronic spectral features (black dashed curves) obtained from optimized fits to the Holstein–Frenkel model. The symmetric (+) and anti-symmetric (−) excitons are shown in blue and red, respectively. Values of the optimized parameters are shown in the insets of the corresponding panels. The laser spectrum (in gray) is shown overlaid with the absorbance spectrum. Experimental rephasing spectra (third row) are compared to the optimized simulated rephasing spectra (fourth row). Reproduced with permission from ref. Copyright 2022, the Royal Society of Chemistry.
Fig. 61
Fig. 61. Global target analysis of transient absorption of DNA-templated cyanine dimer, trimer, and tetramer aggregates. (A) Five-component kinetic scheme used to model the high-salt type 1 solution. Four subpopulations—duplex dimers, type 1 tetramers, adjacent dimers, and monomers—decay in parallel in the model. The duplex dimers additionally exhibit a sequential decay in the model. (B) “Pure” species-associated spectra (SAS) derived for the duplex dimer from the no-salt type-1 solution pumped at 675 nm (solid lines) and SAS from the heterogeneous data set, i.e., the high-salt type-1 solution pumped at 660 nm, attributed to the duplex dimer (dotted lines). SAS1 are plotted in black, and SAS2 are plotted in orange. (C) “Pure” SAS derived for the type 1 tetramer from the high-salt type-1 solution pumped at 555 nm (solid line) and the SAS from the heterogeneous data set pumped at 660 nm, attributed to the type 1 tetramer (dotted line). (D) SAS from the heterogeneous data set attributed to the fourth component, which we assign to a small subpopulation of adjacent dimer-like structures present in the high-salt type-1 solution. Reproduced with permission from ref. Copyright 2021 American Chemical Society.
Fig. 62
Fig. 62. DNA-FRET lasers. (A) Schematic concept of OFRR FRET lasers using DNA scaffolds. (B) Cy5 D lasing could be accomplished via 1 : 1 (top) and 2 : 1 (bottom) D:A DNA constructs, which resulted in decreased lasing thresholds (2.3 μJ mm−2 for 2 : 1 vs. 4.2 μJ mm−2 for 1 : 1 for the emission centered at 720 nm). (C) Lasing emission spectrum of a DNA-based cascade-FRET (Cy3–Cy5-Cy5.5) OFRR laser. (D) Lasing emission (integrated between 720 nm and 760 nm) of the cascade-FRET laser was accomplished with a lasing threshold of 6 μJ mm−2 pump energy density per pulse. Reproduced with permission from ref. Copyright 2010 National Academy of Sciences.
Fig. 63
Fig. 63. Single-molecule FRET DNA barcoding. (A) Schematic presentation of the different stem, barcode, and probe DNAs (top) and the hybrid DNA complexes with six (Barcodes A, B, C, D, E, and F) FRET barcodes. (B) FRET efficiency distribution peaks (using one, two, three, or six barcode DNAs) collected from a single field of view. Solid red lines are Gaussian fits to each subpopulation. Dashed red lines present the position of each subpopulation. The peaks around 0.1 FRET efficiency correspond to the D only (no FRET) subpopulation. Reproduced with permission from ref. Copyright 2021 American Chemical Society.
Fig. 64
Fig. 64. Environmental sensing with DNA origami FRET constructs. (A) FRET-DNA force sensor containing two large DNA barrels connected by one fluctuating (orange) and five unconstrained (green) or constrained (blue) scaffold linkers to control the conformational space. (B) Closed (left) and open (right) conformations of the C0 construct (without constrained linkers) result in a D–A (green and red stars) distance change. (C) The DNA-FRET sensor could quantify depletion forces induced by molecular crowding using different PEG35 concentrations. Reproduced with permission from ref. Copyright 2017 American Chemical Society.
Fig. 65
Fig. 65. FRET pH sensor. (A) FRET-DNA pH sensor using different D–A arrangements with 12 possible D and A positions. (B) Different FRET arrangements (pH-inert C343 D in green and pH-sensitive FAM A in red) on triangular DNA origami were used for ratiometric pH sensing. (C) A 3 × 4 checkerboard arrangement resulted in the best pH sensing performance. Reproduced with permission from ref. Copyright 2018 American Chemical Society.
Fig. 66
Fig. 66. DNA-FRET voltage sensor including various functionalities on a single DNA origami platform. (A) Schematic of the sensor interface with the liposome membrane. (B) Voltage-sensing unit consisting of dsDNA with ATTO532 D and ATTO647N A dyes. (C) Probable working principle of the voltage-sensor, for which ATTO647N remains anchored in the hydrophobic core of the membrane, whereas the anionic ATTO532-DNA is influenced by the charge inside the liposome, which results in D–A distance changes. (D) The FRET distance changes can be used to distinguish transmembrane potentials with different sensor constructs (red: C12 linker on ATTO647N; green: C12 + C6 linker on ATTO647N). Reproduced with permission from ref. Copyright 2021 American Chemical Society.
Fig. 67
Fig. 67. Biomarker sensing with multi-FRET DNA networks. (A) 3D model of a DNA origami beacon with a multi-dye FRET pair consisting of up to 60 Cy3 Ds (green spheres) and 60 Cy5 As (orange spheres). (B) Schematic of the attachment of the DNA origami beacon to a microscopy coverslip and beacon opening upon target binding to the sensor modules, which results in a color change (from FRET-sensitized red Cy5 to direct green Cy3 emission) in single-beacon imaging (right). (C) Image analysis with different target concentrations (red and green histograms represent FRET efficiency distributions before and after addition of DNA) resulted in a detection limit of ∼100 pM. Reproduced with permission from ref. Copyright 2018 American Chemical Society.
Fig. 68
Fig. 68. Multistep FRET network. (A) Assembly consisting of a central QD and biotin–streptavidin assembled DNA tetrahedrons with three different dyes. Excitation of the QD can excite all three dyes via direct QD-dye FRET or QD-dye-dye-dye FRET cascades. (B) The tetrahedron DNAs contain biotin and dye functionalities as well as specific cleavage sites for three endonucleases, which will specifically release the different dyes from the tetrahedron. (C) Fluorescence images of the 525QD-Cy3-Texas Red-Cy5 tetrahedral DNA in the (1) absence of any endonucleases and presence of (2) HaeIII and (3) HaeIII + EcoRV + PvuII. (a)–(c) Fuorescence images of the same field in the 525QD channel (500–550 nm) and the Cy3/Texas Red channel I (573–617 nm) are acquired simultaneously by using dual-view optics at an excitation wavelength of 405 nm. Then (d–f) fluorescence images in the Cy3/Texas Red channel II (565–605 nm) and Cy5 channel (672–712 nm) are acquired simultaneously. Fluorescence spots shown in the Cy3/Texas Red channel I/II (b, d, green color) result from FRET from the 525QD to Cy3/Texas Red (yellow arrows); fluorescence spots shown in the Cy5 channel (e, red color) result from FRET from the 525QD to Cy5 (white arrows). Fluorescence images with blended colors in (c) cyan indicate the colocalization of 525QD and Cy3/Texas Red; fluorescence images with blended colors in (f) yellow indicate the colocalization of Cy3/Texas Red and Cy5. The scale bar is 2 μm. Reproduced with permission from ref. Copyright 2019 American Chemical Society.
Fig. 69
Fig. 69. RCA-FRET DNA-scaffold biosensor. (A) Biosensor combining one Tb D with two different dye As (Cy3.5 and Cy5.5). Hybridizing the DNA probes at different distances (bps) inside the target-specific RCA products provides four distinguishable signals (two distinct TG detection windows for each of the two emission colors). (B) Multiplexed quantification of four different DNA targets at different subpicomolar concentrations in 10 different samples. Reproduced with permission from ref. Copyright 2018 American Chemical Society.
Fig. 70
Fig. 70. Determining the cytosolic stability of small DNA nanostructures in cellula. (A) Surface-adherent mammalian cells were individually injected with DNA structures into the cytosol. The fluorescence intensity and FRET between the three dyes was measured using confocal microscopy over the course of 60 min (B) DNA nanocrosshair with four copies of the 3-dye FRET network arranged linearly on each arm. Steady-state fluorescence spectra of the nanocrosshair with all dyes present versus individual dyes only (excitation wavelength 466 nm). (C) DNA tetrahedron with one copy of the three-dye FRET network arranged with one dye per edge. Steady-state fluorescence spectra of the tetrahedron with all dyes present versus individual dyes only (excitation wavelength 466 nm). Colored arrows in the schematics indicate D → Relay (R) and R → A FRET steps. Representative four-channel confocal image of COS-1 cells injected with (D) the nanocrosshair and (E) the tetrahedron after t = 60 min. Reproduced with permission from ref. Copyright 2022 American Chemical Society.
Fig. 71
Fig. 71. Examining theoretical dye structures. (A) Structure diagram for dye 17 and 28 from the work of Jacquemin. Light grey – hydrogen, dark grey – carbon, dark blue – nitrogen, green – chlorine, red – oxygen. Calculations on these structures were performed to obtain the magnitude and direction of Δdm and μm. (B) Signal amplitude schematic of a dimer with hopping time, τh (“beat time” between the two exciton states) & dephasing time τd. Jm,n of 98 meV (790 cm−1) gives ωh ∼ 47 THz (eqn (23)) or τh of 21 fs. A τd ∼ 54 fs is obtain from the reduction of homogeneous broadening of ΔEhomog ∼ 18 THz observed in a DNA template rotaxane SQ dimer. Assuming 5% of measurable original signal amplitude (i.e., e(−t/[3×τd])) gives 3τd or 162 fs (time to be able to perform measureable calculations) & n > 7 measurable gate operations. T = 295 K.

References

    1. Fang X. Kalathil S. Reisner E. Chem. Soc. Rev. 2020;49:4926–4952. doi: 10.1039/C9CS00496C. - DOI - PubMed
    1. Li H. Wang X. Huang D. X. Chen G. Y. Nanotechnology. 2020;31:072001. doi: 10.1088/1361-6528/ab4f36. - DOI - PubMed
    1. Wolfbeis O. S. Chem. Soc. Rev. 2015;44:4743–4768. doi: 10.1039/C4CS00392F. - DOI - PubMed
    1. Oh E. Huston A. L. Shabaev A. Efros A. Currie M. Susumu K. Bussmann K. Goswami R. Fatemi F. K. Medintz I. L. Sci. Rep. 2016;6:35538. doi: 10.1038/srep35538. - DOI - PMC - PubMed
    1. Oh E. Fatemi F. K. Currie M. Delehanty J. B. Pons T. Fragola A. Leveque-Fort S. Goswami R. Susumu K. Huston A. L. Medintz I. L. Part. Part. Syst. Charact. 2013;30:453–466. doi: 10.1002/ppsc.201200140. - DOI