. 2023 Nov;27(22):3565-3577.
doi: 10.1111/jcmm.18001. Epub 2023 Oct 23.

Cell-type-specific gene expression and regulation in the cerebral cortex and kidney of atypical Setbp1S858R Schinzel Giedion Syndrome mice

Affiliations

Cell-type-specific gene expression and regulation in the cerebral cortex and kidney of atypical Setbp1S858R Schinzel Giedion Syndrome mice

Jordan H Whitlock et al. J Cell Mol Med. 2023 Nov.

Abstract

Schinzel Giedion Syndrome (SGS) is an ultra-rare autosomal dominant Mendelian disease presenting with abnormalities spanning multiple organ systems. The most notable phenotypes involve severe developmental delay, progressive brain atrophy, and drug-resistant seizures. SGS is caused by spontaneous variants in SETBP1, which encodes for the epigenetic hub SETBP1 transcription factor (TF). SETBP1 variants causing classical SGS cluster at the degron, disrupting SETBP1 protein degradation and resulting in toxic accumulation, while those located outside cause milder atypical SGS. Due to the multisystem phenotype, we evaluated gene expression and regulatory programs altered in atypical SGS by snRNA-seq of the cerebral cortex and kidney of Setbp1S858R heterozygous mice (corresponds to the human likely pathogenic SETBP1S867R variant) compared to matched wild-type mice by constructing cell-type-specific regulatory networks. Setbp1 was differentially expressed in excitatory neurons, but known SETBP1 targets were differentially expressed and regulated in many cell types. Our findings suggest molecular drivers underlying neurodevelopmental phenotypes in classical SGS also drive atypical SGS, persist after birth, and are present in the kidney. Our results indicate SETBP1's role as an epigenetic hub leads to cell-type-specific differences in TF activity, gene targeting, and regulatory rewiring. This research provides a framework for investigating cell-type-specific variant impact on gene expression and regulation.

Keywords: SETBP1; Schinzel Giedion Syndrome; gene regulatory networks; genomics; rare disease; single-cell.


Conflict of interest statement

The authors have declared no conflicts of interest.

Figures

FIGURE 1
FIGURE 1
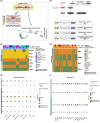
Schematic overview of our approach (A) We generated single‐nuclei RNA‐seq (snRNA‐seq) from male C57BL/6J (WT) and Setbp1 S858R cerebral cortex and kidney tissues. (B) We processed and aggregated our data across samples to create cell‐type‐specific count matrices. (C) Next, we assessed cell‐type‐specific expression for Setbp1 and genes SETBP1 is known to target. (D) With decoupleR, we measured cell‐type‐specific TF activity. (E) We acquired protein–protein interaction data (PPI; green) from STRING and Transcription Factor‐motif data (TF‐motif; yellow) from CIS‐BP enriched for SETBP1 targets. We then built cell‐type‐specific TF‐gene regulatory networks with the data we generated by using the message‐passing algorithm PANDA to identify regulatory relationships between TFs (circles), genes (rectangles), and proteins (triangles) for each S858R and WT cell type in both tissues and investigated differential communities using differential community detection with ALPACA, differential gene targeting, cooperativity analysis, and functional enrichment analysis.
FIGURE 2
FIGURE 2
Differential expression of SETBP1 targets reveals cell‐type‐specific signatures of apoptosis resistance, oncogene disruption, and altered cell cycling in NPC‐derived cells: Expression of Setbp1 in S858R and WT (A) cerebral cortex and (B) kidney cells. Differentially expressed known SETBP1 target genes (average log2FC threshold of 0.1 and p‐adjusted value <0.05) in S858R and WT (C) cerebral cortex and (D) kidney cells. Teal and brown denote up and downregulated genes, respectively. (E) Split violin plot of the expression of Sox2 (a marker of proliferative NPCs) in S858R and WT cerebral cortex cell types.
FIGURE 3
FIGURE 3
SETBP1 TF activity is altered in pericytes and microglia and multiple kidney cell types of S858R mice: Heatmap of decoupleR TF activity scores of SETBP1 and its target genes that displayed the largest percent change in activity in the cerebral cortex (A) and kidney (B). Teal and brown correspond to TFs acting as activators or repressors, respectively.
FIGURE 4
FIGURE 4
Increased differential gene targeting in S858R cerebral cortex and kidney cells indicates increased gene regulation and altered cell‐type‐specific mechanisms associated with SGS: Dot plot of the normalized total differential gene targeting by (A) cerebral cortex and (B) kidney cell types (teal for increased gene targeting in S858R compared to WT and brown for decreased gene targeting in S858R compared to WT; dot size corresponds to gene number). Functional Enrichment Analysis (FEA) of differentially targeted SETBP1 gene set in (C) cerebral cortex and (D) kidney cell types.
FIGURE 5
FIGURE 5
Differential community analysis of SETBP1 communities reveals groups of cell types with more similar SETBP1 differential communities: Jaccard Similarity Index (JI) between all SETBP1 differential communities in (A) cerebral cortex and (B) kidney.
FIGURE 6
FIGURE 6
S858R pericytes and microglia and multiple kidney cell types exhibit altered cooperation and regulation in proposed cell cycle and DNA damage mechanisms in SGS: Visualization of changes in regulation and cooperation of cell types in S858R cerebral cortex and kidney. (A) Schematic of proposed increased DNA damage and increased cell cycle mechanisms in the context of SGS. (B) Classification of altered regulation and cooperation through a change in network scores between TF SETBP1 (yellow) and its target genes from the gene set (light grey) associated with the corresponding target protein and proposed mechanisms of altered neurodevelopment in SGS mediated through Apex1 or Trp53 (dark grey). Heatmap showing the sign change in regulation and cooperation between conditions in the cerebral cortex (C) and kidney (D). Dot plot showing the magnitude of regulatory (direction and size of triangle) and cooperativity (teal to brown) network scores in the cerebral cortex (E) and kidney (F).

References

    1. Schinzel A, Giedion A. A syndrome of severe midface retraction, multiple skull anomalies, clubfeet, and cardiac and renal malformations in sibs. Am J Med Genet. 1978;1:361‐375. - PubMed
    1. Schinzel Giedion Syndrome—NORD (National Organization for Rare Disorders). 2015.
    1. Liu W‐L, He Z‐X, Li F, Ai R, Ma HW. Schinzel–Giedion syndrome: a novel case, review and revised diagnostic criteria. J Genet. 2018;97:35‐46. - PubMed
    1. Zaghi M, Banfi F, Massimino L, et al. Balanced SET levels favor the correct enhancer repertoire during cell fate acquisition. Nat Commun. 2023;14:3212. - PMC - PubMed
    1. Piazza R, Magistroni V, Redaelli S, et al. SETBP1 induces transcription of a network of development genes by acting as an epigenetic hub. Nat Commun. 2018;9:2192. - PMC - PubMed

Publication types

Supplementary concepts