

Graphical Abstract in Scientific Research
- PMID: 37872939
- PMCID: PMC10590498
- DOI: 10.7759/cureus.45762
Graphical Abstract in Scientific Research
Abstract
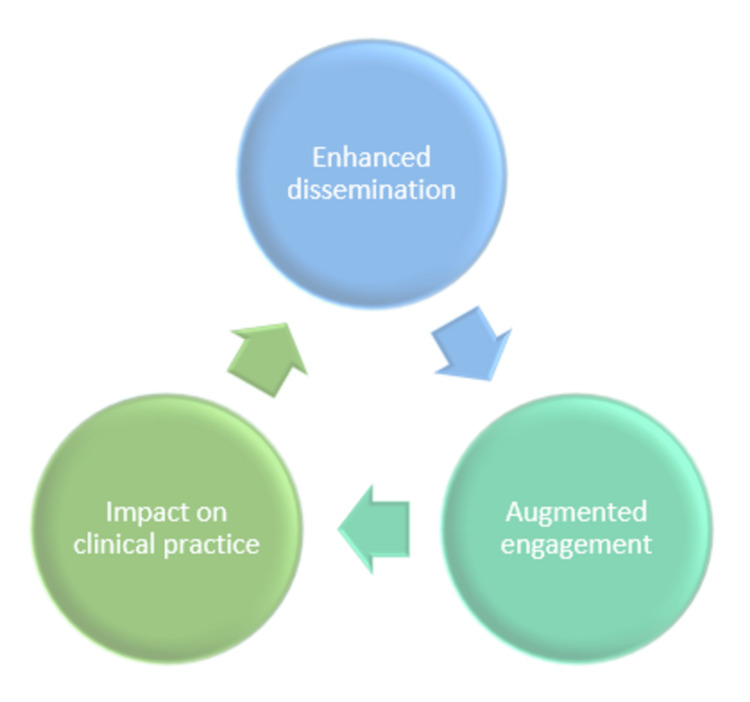
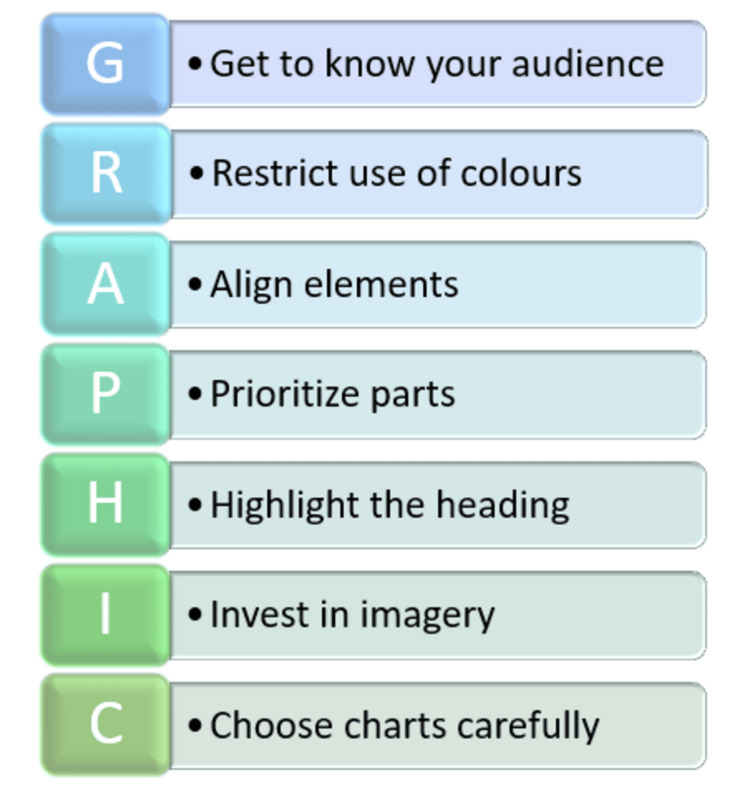
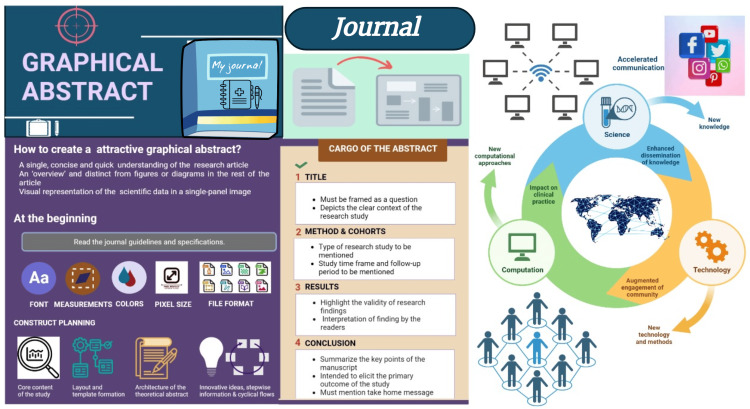
A graphical abstract (GA) summarizes the key and important findings of an article graphically, potentially stimulating researchers to view the published manuscript. A GA should enhance dissemination, augment engagement, and impact clinical practice. Infographics play a key role in a quicker understanding of the significant findings of a manuscript. Few level 1 studies reported that GAs enhanced the engagement of readers on social media when compared to plain text abstracts. With the evolution of Industry 4.0, 5.0, and 6.0, GA plays a major role in understanding the technical aspects of various technologies. This article outlines tips to prepare an effective GA and reports the impact of GAs on research and clinical translation.
Keywords: graphical abstract; graphics; research; social media; visual abstract.
Copyright © 2023, Jeyaraman et al.
Conflict of interest statement
The authors have declared that no competing interests exist.
Figures
References
-
- Seeing is believing: using visual abstracts to disseminate scientific research. Ibrahim AM. Am J Gastroenterol. 2018;113:459–461. - PubMed
-
- Smiciklas M. Que; [ Sep; 2023 ]. 2023. The Power of Infographics: Using Pictures to Communicate and Connect With Your Audiences.
-
- Visual abstracts to disseminate research on social media: a prospective, case-control crossover study. Ibrahim AM, Lillemoe KD, Klingensmith ME, Dimick JB. Ann Surg. 2017;266:0–8. - PubMed
-
- Speed of processing in the human visual system. Thorpe S, Fize D, Marlot C. Nature. 1996;381:520–522. - PubMed
Publication types
LinkOut - more resources
Full Text Sources