[Preprint]. 2023 Oct 3:2023.10.02.560573.
doi: 10.1101/2023.10.02.560573.

APOLLO: A genome-scale metabolic reconstruction resource of 247,092 diverse human microbes spanning multiple continents, age groups, and body sites

Affiliations

APOLLO: A genome-scale metabolic reconstruction resource of 247,092 diverse human microbes spanning multiple continents, age groups, and body sites

Almut Heinken et al. bioRxiv. .

Update in

Abstract

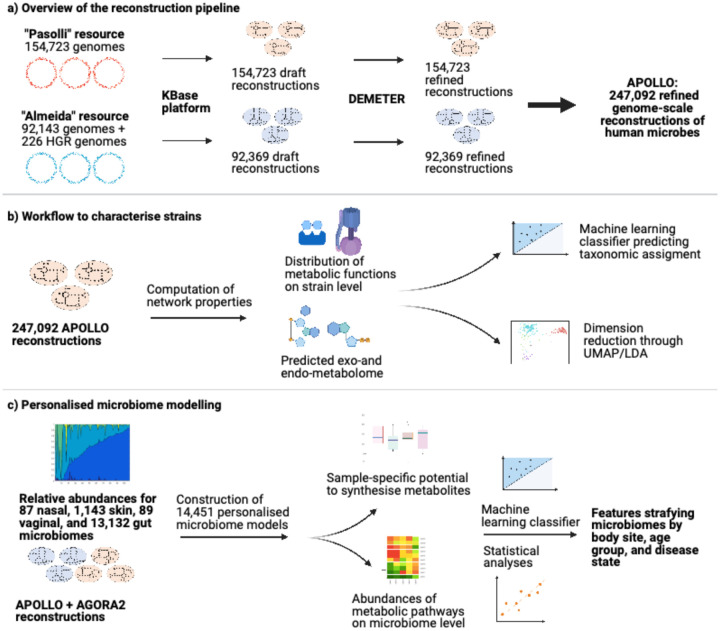
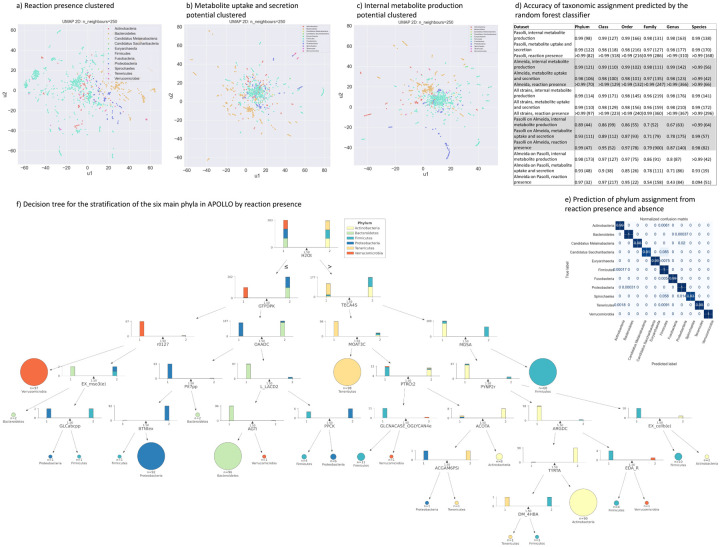
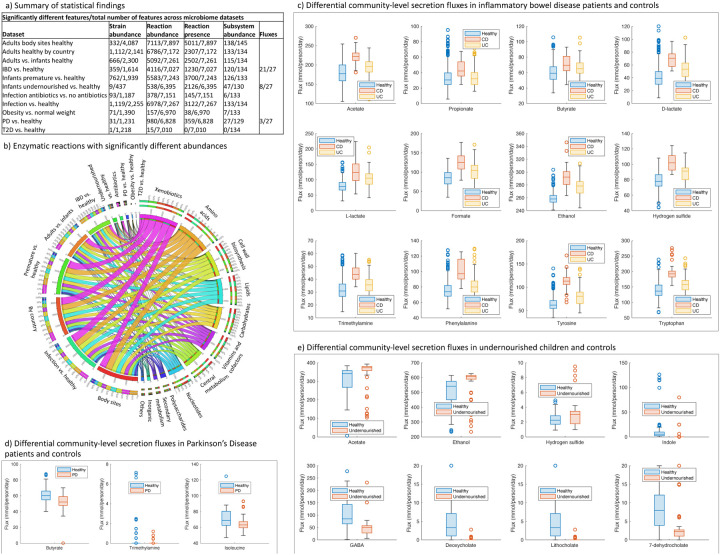
Computational modelling of microbiome metabolism has proved instrumental to catalyse our understanding of diet-host-microbiome-disease interactions through the interrogation of mechanistic, strain- and molecule-resolved metabolic models. We present APOLLO, a resource of 247,092 human microbial genome-scale metabolic reconstructions spanning 19 phyla and accounting for microbial genomes from 34 countries, all age groups, and five body sites. We explored the metabolic potential of the reconstructed strains and developed a machine learning classifier able to predict with high accuracy the taxonomic strain assignments. We also built 14,451 sample-specific microbial community models, which could be stratified by body site, age, and disease states. Finally, we predicted faecal metabolites enriched or depleted in gut microbiomes of people with Crohn's disease, Parkinson disease, and undernourished children. APOLLO is compatible with the human whole-body models, and thus, provide unprecedented opportunities for systems-level modelling of personalised host-microbiome co-metabolism. APOLLO will be freely available under https://www.vmh.life/.


Conflict of interest statement

Declaration of interests The authors declare no conflict of interest.

Figures

Figure 1:
Figure 1:
Overview of the reconstruction and analysis pipeline to construct and interrogate APOLLO. a) Overview of the pipeline to reconstruct the “Pasolli” and “Almeida” MAG resources, consisting of generation of draft reconstructions through KBase, and refinement, testing, and debugging of draft reconstructions through DEMETER. b) Overview of the workflow to systematically characterise the distribution of features across taxa. For all APOLLO strains, metabolic functions were systematically computed. Through a machine learning classifier, taxonomic assignment of strains was predicted based on the computed features. Strains were clustered based on metabolic similarities using UMAP/LDA. c) Creation and interrogation of personalised microbiome models. Mapped relative abundances were used to construct models for 14,451 microbiomes from four body sites. Reaction abundance and presence on microbiome level were determined, and metabolite production potential was computed for a subset of samples. Key differences between groups were identified through machine learning and statistical analyses. Created with BioRender.com.
Figure 2:
Figure 2:
Overview of characteristics of APOLLO. a) Comparison of reconstruction features between Pasolli reconstructions, Almeida reconstructions, APOLLO, and AGORA2. b) Numbers of reactions, metabolites, and genes across Pasolli reconstructions, Almeida reconstructions, APOLLO, and AGORA2. c) Taxonomic assignment in APOLLO and AGORA2 plotted as fractions of total contained strains. d) Number of unique taxa from phylum to species and fraction of unclassified strains on the species level in Pasolli reconstructions, Almeida reconstructions, APOLLO, and AGORA2. e) Number of strains in phyla in APOLLO, rank ordered. f) Overlap in reaction and unique metabolite content between all APOLLO and AGORA2 reconstructions. g-h) Taxon-specific computed features for strains contained in APOLLO. g) Number of reactions, h) predicted growth rate (hr−1) on aerobic complex medium.
Figure 3:
Figure 3:
Analysis of strain-level reconstruction features in APOLLO through dimension reduction and the random forests classifier. a-c) Clustering of strain-level predicted model properties through UMAP on the class level. a) Reaction presence, b) metabolite uptake and secretion potential, c) internal metabolite production potential. UMAP analyses on order level for the same data are shown in Figure S8–10. d) Overview of taxonomic assignment for the three datasets and from phylum to species predicted by the random forest classifier. Shown is the accuracy of the predicted taxonomic assignment against the assignment reported by the original authors (where classification was possible). The number of features that were sufficient to achieve the reported accuracy is shown in brackets. The list of classifying features for each prediction is available in Table S6. e) Normalised confusion matrix for the prediction of phylum assignment based on reaction presence and absence for phyla with more than 125 representatives in APOLLO. f) Decision tree showing the minimal set of reactions leading to strain classification by phylum by their presence or absence. Shown are results generated from 100 randomly selected strains for each phylum. 1 = Absence of the reaction, 2 = presence of the reaction. Reactions are shown by VMH ID (https://www.vmh.life) (Noronha et al., 2019).
Figure 4:
Figure 4:
Analysis of personalised microbiome models constructed from APOLLO through dimension reduction and the random forests classifier. a) Overview of the 11 modelled microbiome datasets and accuracies obtained through random forests analyses. For the sample inclusion criteria, see Methods. Shown are the accuracies for the correct prediction of stratification groups by the random forests classifier for each dataset based on strain-level relative abundance as well as reaction abundance, reaction presence, and subsystem abundance summarised for each sample-specific model. The number of features that were sufficient to achieve the reported accuracy is shown in brackets. The list of classifying features for each prediction is shown in Table S10. b-g) Clustering of microbiome model datasets defined in this study by body site through UMAP by relative reaction abundance. b) Healthy microbiomes by body site, c) healthy adult and infant gut microbiomes, d) healthy and premature infant gut microbiomes, e) gut microbiomes of healthy and undernourished children, f) gut microbiomes of PD patients and healthy controls, g) gut microbiomes of healthy adults and those with infection. h-k) Subsets of reactions that predicted stratification group by random forests analysis. Shown are the VMH reaction IDs (https://www.vmh.life/) (Noronha et al., 2019). h) Healthy microbiomes by body site, i) gut microbiomes of CD patients and healthy controls, j) gut microbiomes of healthy and undernourished children, k) gut microbiomes of PD patients and healthy controls. UMAP = uniform manifold approximation and projection, CD = Crohn’s disease, IBD = inflammatory bowel disease, PD = Parkinson disease, T2D = type 2 diabetes, UC = ulcerative colitis.
Figure 5:
Figure 5:
Analysis of personalised microbiome models constructed from APOLLO through statistical analyses. a) Overview of features that were statistically significant out of the total features between groups in the 11 datasets. Details are shown in Table S11a-d. b) Enzymatic reactions that were statistically significant between groups in the 11 datasets by relative abundance shown by corresponding reaction subsystems. c) Community-wide metabolite secretion fluxes that were significantly different between IBD patients and healthy controls. Shown are the 12 metabolites with the highest total production potential. d) Community-wide metabolite secretion fluxes that were significantly different between PD patients and healthy controls. e) Community-wide metabolite secretion fluxes that were significantly different between undernourished children and healthy controls. IBD = inflammatory bowel disease, CD = Crohn’s Disease, UC = ulcerative colitis, PD = Parkinson disease, T2D = type 2 Diabetes.

References

    1. Aden K., Rehman A., Waschina S., Pan W.H., Walker A., Lucio M., Nunez A.M., Bharti R., Zimmerman J., Bethge J., et al. (2019). Metabolic Functions of Gut Microbes Associate With Efficacy of Tumor Necrosis Factor Antagonists in Patients With Inflammatory Bowel Diseases. Gastroenterology 157, 1279–1292 e1211. - PubMed
    1. Agren R., Liu L., Shoaie S., Vongsangnak W., Nookaew I., and Nielsen J. (2013). The RAVEN toolbox and its use for generating a genome-scale metabolic model for Penicillium chrysogenum. PLoS Comput Biol 9, e1002980. - PMC - PubMed
    1. Alexander M., and Turnbaugh P.J. (2020). Deconstructing Mechanisms of Diet-MicrobiomeImmune Interactions. Immunity 53, 264–276. - PMC - PubMed
    1. Almeida A., Mitchell A.L., Boland M., Forster S.C., Gloor G.B., Tarkowska A., Lawley T.D., and Finn R.D. (2019). A new genomic blueprint of the human gut microbiota. Nature 568, 499–504. - PMC - PubMed
    1. Arkin A.P., Cottingham R.W., Henry C.S., Harris N.L., Stevens R.L., Maslov S., Dehal P., Ware D., Perez F., Canon S., et al. (2018). KBase: The United States Department of Energy Systems Biology Knowledgebase. Nat Biotechnol 36, 566–569. - PMC - PubMed

Publication types