[Preprint]. 2024 Sep 24:2023.10.03.560731.
doi: 10.1101/2023.10.03.560731.

A dual-pathway architecture enables chronic stress to disrupt agency and promote habit formation

Affiliations

A dual-pathway architecture enables chronic stress to disrupt agency and promote habit formation

Jacqueline R Giovanniello et al. bioRxiv. .

Update in

  • A dual-pathway architecture for stress to disrupt agency and promote habit.
    Giovanniello JR, Paredes N, Wiener A, Ramírez-Armenta K, Oragwam C, Uwadia HO, Yu AL, Lim K, Pimenta JS, Vilchez GE, Nnamdi G, Wang A, Sehgal M, Reis FM, Sias AC, Silva AJ, Adhikari A, Malvaez M, Wassum KM. Giovanniello JR, et al. Nature. 2025 Apr;640(8059):722-731. doi: 10.1038/s41586-024-08580-w. Epub 2025 Feb 19. Nature. 2025. PMID: 39972126 Free PMC article.

Abstract

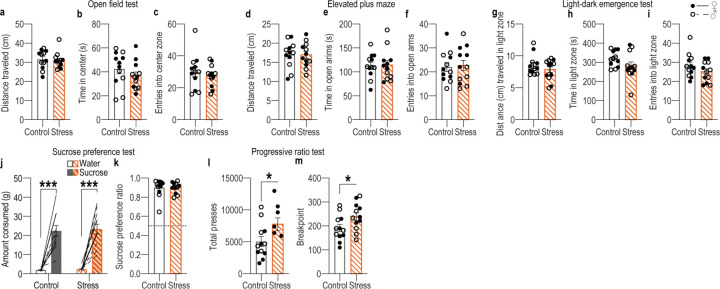
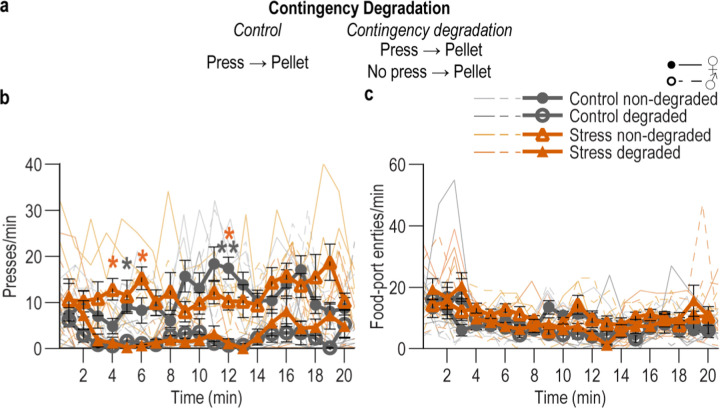
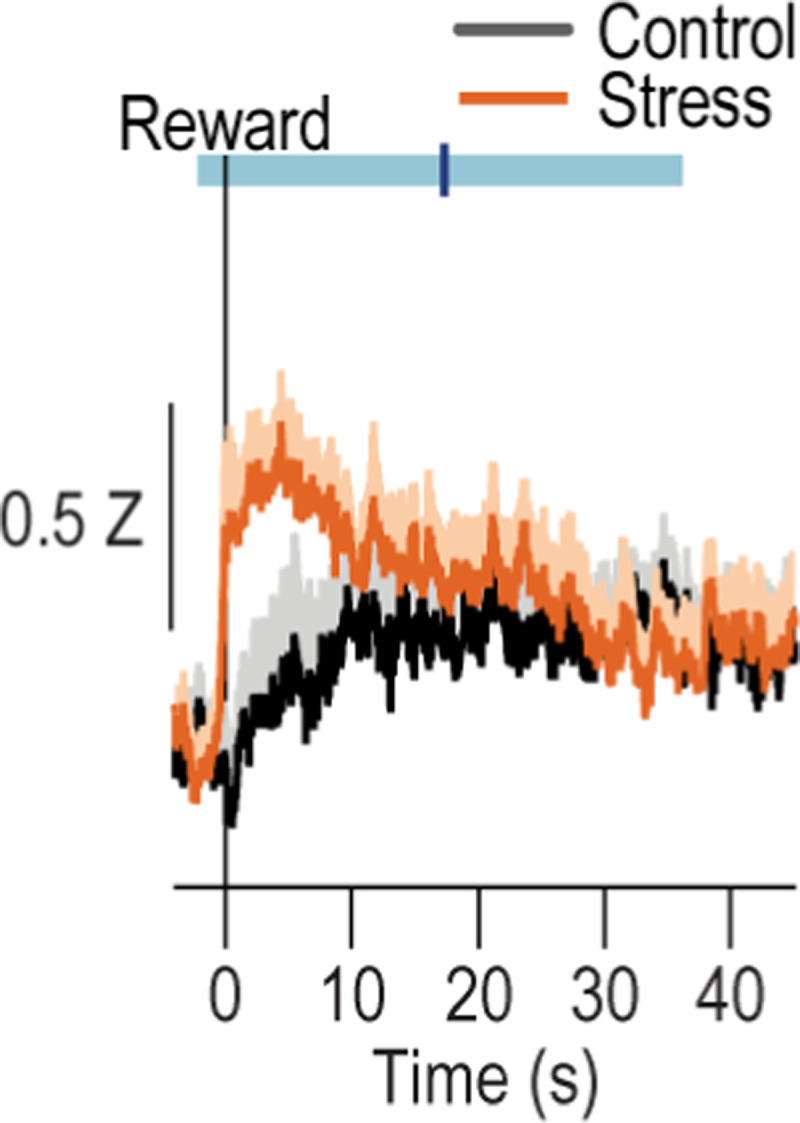
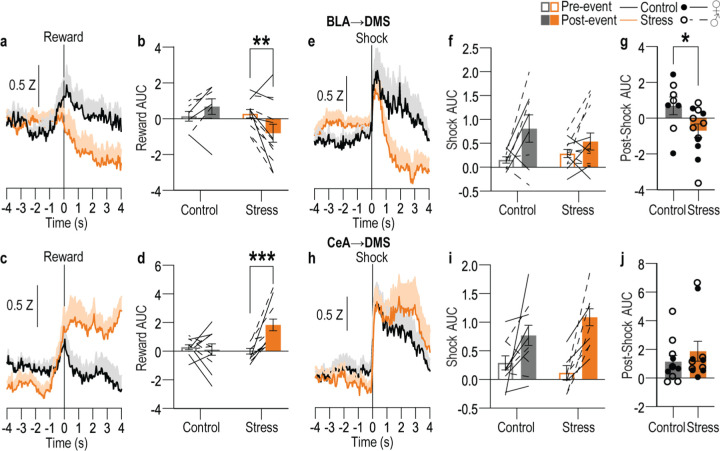
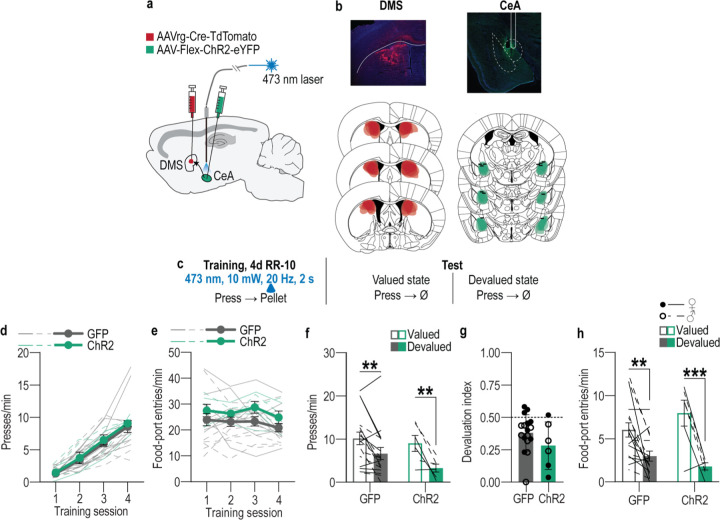
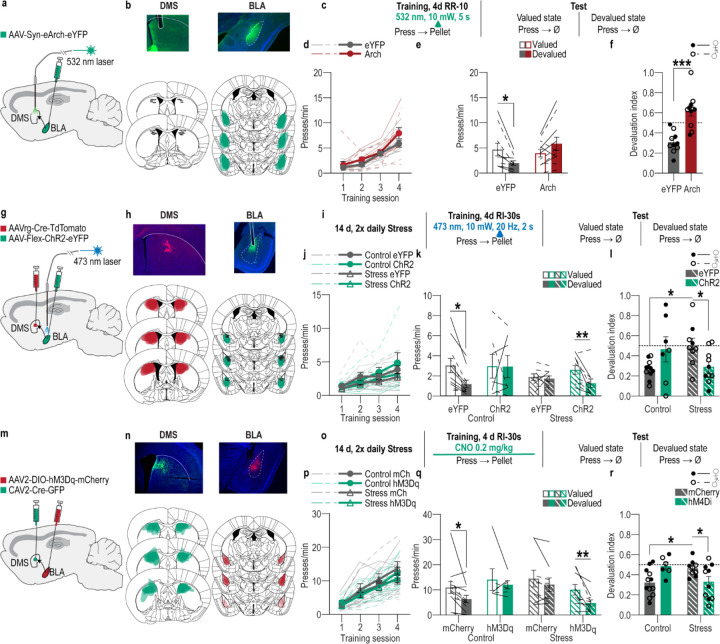
Chronic stress can change how we learn and, thus, how we make decisions. Here we investigated the neuronal circuit mechanisms that enable this. Using a multifaceted systems neuroscience approach in male and female mice, we reveal a dual pathway, amygdala-striatal neuronal circuit architecture by which a recent history of chronic stress disrupts the action-outcome learning underlying adaptive agency and promotes the formation of inflexible habits. We found that the basolateral amygdala projection to the dorsomedial striatum is activated by rewarding events to support the action-outcome learning needed for flexible, goal-directed decision making. Chronic stress attenuates this to disrupt action-outcome learning and, therefore, agency. Conversely, the central amygdala projection to the dorsomedial striatum mediates habit formation. Following stress this pathway is progressively recruited to learning to promote the premature formation of inflexible habits. Thus, stress exerts opposing effects on two amygdala-striatal pathways to disrupt agency and promote habit. These data provide neuronal circuit insights into how chronic stress shapes learning and decision making, and help understand how stress can lead to the disrupted decision making and pathological habits that characterize substance use disorders and mental health conditions.

Keywords: basolateral amygdala; central amygdala; decision making; instrumental conditioning; learning; reward; striatum.


Conflict of interest statement

COMPETING FINANCIAL INTERESTS The authors have no biomedical financial interests or potential conflicts of interest to declare.

Figures

Extended data Figure 1-1:
Extended data Figure 1-1:. Chronic mild unpredictable stress does not cause classic anxiety- and depression-like phenotypes.
Mice received 14 consecutive d of chronic mild unpredictable stress (stress) including twice daily exposure to 1 of 6 mild stressors at pseudorandom times and orders: damp bedding (16 hr), tilted cage (16 hr), white noise (80 db; 2 hr), continuous illumination (8 hr), physical restraint (2 hr), footshock (0.7-mA, 1-s, 5 shocks/10 min) prior to subsequent testing in a battery of behavioral assays classically used to assess anxiety- and depression-like behavior. (a-c) Open field test. Distance traveled (a; t(22) = 0.32, P = 0.75), time spent in center zone (b; t(22) = 1.10, P = 0.28), and entries into center zone (c; t(22) = 0.63, P = 0.54). (d-f) Elevated plus maze. Distance traveled (d; t(22) = 0.08, P = 0.94), time spent in open arms (e; t(22) = 0.01, P = 0.92), and entries into open arms (f; t(22) = 0.23, P = 0.82). (g-i) Light-dark emergence test. Distance traveled in light zone (g; t(22) = 0.97, P = 0.34), time spent in light zone (h; t(22) = 1.57, P = 0.13), and entries into light zone (I; t(22) = 1.37, P = 0.19). (j-k) Sucrose preference test. Average amount consumed of water and 10% sucrose over 24 hr (j; Solution: F(1, 22) = 113.20, P < 0.0001; Stress: F(1, 22) = 0.14, P = 0.71, Solution x Stress: F(1, 22) = 0.02, P = 0.89) and ratio of sucrose:water consumed (k; t(22) = 0.03, P = 0.98). (l-m) Progressive ratio Tests. Total presses (l; t(22) = 2.13, P = 0.04) and breakpoint (k; Final ratio completed; t(22) = 2.12, P = 0.46). Control N = 12 (6 male), Stress N = 12 (6 male). Males = closed circles, Females = open circles. *P <0.05, ***P <0.001. Our stress procedure does not affect general locomotor activity or avoidance of anxiogenic spaces or create an anhedonia phenotype. Rather this stress procedure appears to cause elevated motivation to exert effort to obtain reward. This contrasts with more severe, longer-lasting stress procedures, which do produce anxiety- and depression-like phenotypes in these tasks,,. Thus, our stress procedure models chronic, low-level stress.
Extended data Figure 1-2:
Extended data Figure 1-2:. Food-port entries during training and probe tests following handling control or chronic stress.
(a) Food-port entry rate across training for subjects in the devaluation experiment. Training: F(2.42, 108.90) = 3.17, P = 0.04; Stress: F(1, 45) = 0.07, P = 0.79; Training x Stress: F(3, 135) = 0.57, P = 0.64. (b) Food-port entries during the devaluation probe tests. Value: F(1, 45) = 6.77, P = 0.01, Stress: F(1, 45) = 0.29, P = 0.60; Stress x Value: F(1, 45) = 2.42, P = 0.13. Control N = 22 (13 male), Stress N = 25 (12 male). (c) Food-port entry rate across training for subjects in the contingency degradation experiment. Training: F(2.84, 62.10) = 6.44, P = 0.001; Stress: F(1, 25) = 0.01, P = 0.91; Future Contingency Degradation group: F(1, 25) = 1.27, P = 0.27; Training x Stress: F(3, 75) = 1.62, P = 0.19; Training x Group: F(3, 75) = 0.24, P = 0.87; Stress x Group: F(1, 25) = 0.004, P = 0.95; Training x Stress x Group: F(3, 75) = 1.49, P = 0.23. (d) Food-port entries during the probe test 24 hr following contingency degradation or non-degraded control. Stress x Contingency Degradation Group: F(1, 25) = 18.88, P = 0.0002; Contingency Degradation: F(1, 25) = 4.29, P = 0.05; Stress: F(1, 25) = 1.41, P = 0.25. Control, Non-degraded N = 7 (3 male), Control, Degraded N = 7 (3 male), Stress Non-degraded N = 7 (3 male) Stress Degraded N = 8 (4 male). Males = solid lines, Females = dashed lines. *P < 0.05, **P < 0.01.
Extended data Figure 1-3:
Extended data Figure 1-3:. Lever presses and food-port entries during contingency degradation.
(a) Contingency degradation procedure schematic. Following stress and training, half the subjects in each group received a 20-min contingency degradation session during which lever pressing continued to earn reward with a probability of 0.1, but reward was also delivered non-contingently with the same probability. This session was identical for non-degraded controls, except they did not receive free rewards. (b) Press rate in 1-min bins during the contingency degradation session. Time x Contingency Degradation Group: F(19, 475) = 2.03, P = 0.0063; Time x Stress: F(19, 475) = 2.43, P = 0.0007; Stress x Group: F(1, 25) = 0.0001, P = 0.99; Time: F(9.17, 229.20) = 2.13, P = 0.03; Stress: F(1, 25) = 1.36, P = 0.26; Degradation Group: F(1, 25) = 68.23, P < 0.0001; Time x Stress x Degradation Group: F(19, 475) = 1.30, P = 0.19. Contingency degradation cause lower press rates across the session in both control (Time x Contingency Degradation Group: F(12, 228) = 2.47, P = 0.0009; Time: F(6.62, 79.39) = 2.47, P = 0.03; Degradation Group: F(1, 12) = 45.16, P < 0.0001) and stressed (Contingency Degradation Group: F(1, 13) = 28.22, P = 0.0001; Time: F(6.01, 78.16) = 2.19, P = 0.05; Time x Contingency Degradation Group: F(19, 247) = 1.10, P = 0.35) mice. (c) Rate of entry into the food-delivery port in 1-min bins during the contingency degradation session. Time x Contingency Degradation Group: F(19, 475) = 3.80, P < 0.0001; Time x Stress: F(19, 475) = 1.20, P = 0.26; Stress x Group: F(1, 25) = 0.006, P = 0.94; Time: F(6.26, 156.60) = 7.53, P < 0.0001; Stress: F(1, 25) = 2.51, P = 0.13; Degradation Group: F(1, 25) = 1.37, P = 0.5; Time x Stress x Degradation Group: F(19, 475) = 0.86, P = 0.63. Control, Non-degraded N = 7 (3 male), Control, Degraded N = 7 (3 male), Stress Non-degraded N = 7 (3 male) Stress Degraded N = 8 (4 male). Males = closed circles/solid lines, Females = open circles/dashed lines. *P <0.05, **P < 0.01.
Extended Data Figure 2-1:
Extended Data Figure 2-1:. BLA and CeA directly project to DMS.
(a) Top: Anterograde tracing approach. Infusion of an AAV expressing mCherry into the CeA. Bottom: mCherry labeling at infusion site in CeA (left) and mCherry-labeled fibers in the DMS (right). N = 4 (2 male). We observed mCherry-expressing putative fibers in the DMS but not dorsolateral striatum. Expression was also detected in other well-known CeA projection targets such as the bed nucleus of the stria terminalis. (b) Top: Retrograde tracing approach. We infused the fluorescently labeled retrograde tracer Fluorogold into the DMS. Bottom: Fluorogold labeling at infusion site in DMS (left) and fluorogold-labeled, DMS-projecting cell bodies in BLA and CeA (middle), with CeA magnified (right). Labeled cells was detected in both BLA and CeA, indicating that both BLA and CeA directly project to DMS. Labeling was greater in BLA than CeA, indicating the BLA→DMS pathway is denser than the CeA→DMS pathway. N = 4 (2 male). (c) Top: Approach for rabies trans-synaptic retrograde tracing of DMS Drd1+ striatal neurons. We used rabies tracing to confirm monosynaptic amygdala projections onto DMS neurons. We infused a starter virus expressing cre-dependent TVA-oG-GFP into the DMS of mice expressing cre-recombinase under the control of dopamine receptor 1 (D1-Cre) or adenosine 2a receptor (A2A-Cre) genes,, followed by ΔG-deleted rabies-mCherry to retrogradely label cells that synapse onto DMS D1 or A2A neurons. Bottom: Starter oG virus (green) and ΔG-deleted rabies-mCherry (red) expression in DMS Drd1+ neurons (left) and rabies-labeled, DMS D1-projecting cell bodies in the BLA and CeA (right), consistent with prior reports,. Representative example from N = 4 (3 males). (d) Top: Approach for rabies trans-synaptic retrograde tracing of DMS Adora2a+ neurons. Bottom: Starter ΔG virus (green) and rabies-mCherry (red) expression in DMS Adora2a+ neurons (left) and rabies-labeled, DMS A2A-projecting cell bodies in the BLA and CeA (right). Representative example N = 4 (3 males). Combined, these data confirm that both BLA and CeA directly project to the DMS and are, thus, poised to influence the learning that supports goal-directed decision making and habit formation.
Extended Data Figure 2-2:
Extended Data Figure 2-2:. Food-port entries during training with fiber photometry recording of BLA→DMS or CeA→DMS calcium activity following handling control or chronic stress.
(a) Food-port entry rates across training for BLA→DMS GCaMP8s mice. Training: F(2.47, 46.99) = 0.65, P = 0.56; Stress: F(1, 19) = 0.05, P = 0.82; Training x Stress: F(3, 57) = 0.24, P = 0.87. BLA Control N = 9 (4 male), BLA Stress N = 12 (5 male). (b) Food-port entry rates across training for CeA→DMS GCaMP8s mice. Training: F(2.36, 47.19) = 0.89, P = 0.43; Stress: F(1, 20) = 2.71, P = 0.12; Training x Stress: F(3, 60) = 0.09, P = 0.96. CeA Control N = 11 (6 male), CeA Stress N = 11 (4 male). Males = solid lines, Females = dashed lines.
Extended Data Figure 2-3:
Extended Data Figure 2-3:. CeA→DMS pathway activity following reward collection.
Trial-averaged Z-scored Δf/F CeA→DMS GCaMP8s fluorescence changes aligned to reward collection, with 40-s post-collection window. Shading reflects between-subject s.e.m. Blue line is the average time of the next lever press (light blue bar = s.e.m.). In stressed mice, CeA→DMS neurons respond to earned reward and this activity takes ~30 s on average to come back to baseline. Control N = 11 (6 male), Stress N = 11 (4 male).
Extended Data Figure 2-4:
Extended Data Figure 2-4:. BLA→DMS and CeA→DMS pathway responses to unpredicted rewarding and aversive events in control and stressed mice.
Following instrumental training (Figure 2), we used fiber photometry to record GCaMP8s fluorescent changes in either BLA (top) or CeA (bottom) neurons that project to the DMS in response to unpredicted food-pellet reward deliveries or unpredicted 2-s, 0.7 mA footshocks in control and stressed mice. (a) Trial-averaged Z-scored Δf/F BLA→DMS GCaMP8s fluorescence changes around unpredicted food-pellet reward delivery. (b) Trial-averaged quantification of area under the BLA→DMS GCaMP8s Z-scored ∆f/F curve (AUC) during the 3-s period prior to (baseline) and following reward collection. Stress x Reward: F(1, 18) = 10.88, P = 0.004; Reward: F(1, 18) = 1.19; P = 0.03; Stress: F(1, 18) = 1.77, P = 0.20. (c) Trial-averaged Z-scored Δf/F CeA→DMS GCaMP8s fluorescence changes around unpredicted food-pellet reward delivery. (d) Trial-averaged quantification CeA→DMS GCaMP8s Z-scored ∆f/F AUC during the 3-s period prior to and following reward collection. Stress x Reward: F(1, 20) = 11.79, P = 0.02; Reward: F(1, 20) = 8.14, P = 0.01; Stress F(1, 20) = 4.49, P = 0.05. (e) Trial-averaged Z-scored Δf/F BLA→DMS GCaMP8s fluorescence changes around unpredicted footshock. (f) Trial-averaged quantification of BLA→DMS GCaMP8s Z-scored ∆f/F AUC during the 1-s acute shock response compared to a 1-s pre-shock baseline. Shock: F(1, 18) = 8.533, P = 0.01; Stress: F(1, 18) = 0.1433, P = 0.71; Stress x Shock F(1, 18) = 1.725, P = 0.21 (g) Trial-averaged quantification of BLA→DMS GCaMP8s Z-scored ∆f/F AUC during 2-s post-shock period. t(18) = 2.26, P = 0.04. (h) Trial-averaged Z-scored Δf/F CeA→DMS GCaMP8s fluorescence changes around unpredicted footshock. (i) Trial-averaged quantification of CeA→DMS GCaMP8s Z-scored ∆f/F AUC during the 1-s acute shock response, compared to baseline. Shock: F(1, 20) = 28.24, P < 0.0001; Stress: F(1, 20) = 0.22, P = 0.64; Stress x Shock: F(1, 20) = 3.201, P = 0.09. (j) Trial-averaged quantification of CeA→DMS GCaMP8s Z-scored ∆f/F AUC during 2-s post-shock period. t(20) = 0.8798, P = 0.39. BLA Control N = 8 (4 male), BLA Stress N = 12 (5 male). CeA Control N = 11 (6 male), CeA Stress N = 11 (4 male). Males = solid lines, Females = dashed lines. BLA→DMS projections are activated by unpredicted rewards and this is attenuated by prior chronic stress. Conversely, CeA→DMS projections are not normally robustly activated by unpredicted rewards, but are activated by unpredicted rewards following chronic stress. Interestingly, unpredicted rewards robustly activated CeA→DMS projections here, but rewards did not evoke such a response early in instrumental training (Figure 2m). Rather rewards responses developed with training. This indicates that stress-induced engagement of the CeA→DMS pathway may require repeated reward experience, which may reflect engagement of this pathway with repeated reinforcement and/or opportunity to learn the value or salience of the reward. We speculate this CeA→DMS engagement could be a compensatory mechanism triggered in response to the lack of engagement of the BLA→DMS pathway. Both BLA→DMS and CeA→DMS pathways are acutely activated by unpredicted footshock regardless of prior stress. Though chronic stress reduces post-shock activity in the BLA→DMS pathway.
Extended Data Figure 2-5:
Extended Data Figure 2-5:. Chronic stress does not affect spontaneous calcium activity in BLA→DMS or CeA→DMS projections.
(a-b) Frequency (a; Training: F(2.41, 45.69) = 0.17, P = 0.88; Stress: F(1, 19) = 0.08, P = 0.78; Training x Stress: F(3, 57) = 0.85, P = 0.47) and amplitude (b; Training: F(2.48, 47.10) = 0.86, P = 0.45; Stress: F(1, 19) = 0.034, P = 0.85; Training x Stress: F(3, 57) = 1.37, P = 0.26) of Z-scored Δf/F spontaneous calcium activity of BLA→DMS projections during the 3-min baseline period prior to each training session in handled control and stressed mice. (c-d) Frequency (c; Training: F(2.70, 53.97) = 0.21, P = 0.88; Stress F(1, 20) = 3.03, P = 0.10; Training x Stress: F(3, 60) = 0.55, P = 0.65) and amplitude (d; Training: F(2.59, 51.83) = 0.32, P = 0.78; Stress: F(1, 20) = 3.70, P = 0.07; Training x Stress: F(3, 60) = 0.75, P = 0.52) of Z-scored Δf/F spontaneous calcium activity of CeA→DMS projections during the 3-min baseline period prior to each training session handled control and stressed mice. Males = solid lines, Females = dashed lines. Chronic stress did not alter baseline spontaneous calcium activity in either pathway.
Extended Data Figure 3-1:
Extended Data Figure 3-1:. Food-port entries during training with BLA→DMS manipulations and devaluation probe tests.
(a-b) Optogenetic inactivation of BLA→DMS projections at reward during instrumental learning. (a) Food-port entries across training. Training: F(2.03, 38.55) = 3.30, P = 0.05; Virus: F(1, 19) = 0.14, P = 0.71; Training x Virus: F(3, 57) = 0.43, P = 0.73. (b) Food-port entry rates during devaluation probe tests. Stress x Value: F(1, 19) = 4.38, P = 0.05; Stress: F(1, 19) = 0.47, P = 0.50; Value: F(1, 19) = 0.39, P = 0.54. eYFP N = 10 (5 males), Arch N = 11 (5 male). (c-d) Optogenetic activation of BLA→DMS projections during post-stress instrumental learning. (c) Food-port entry rate across training. Training: F(2.5, 82.82) = 6.47, P = 0.001; Stress: F(1, 33) = 3.78, P = 0.06; Virus: F(1, 33) = 0.02, P = 0.89; Training x Stress: F(3, 99) = 0.67, P = 0.57; Training x Virus: F(3, 99) = 0.45, P = 0.72; Stress x Virus: F(1, 33) = 2.18, P = 0.15; Training x Stress x Virus: F(3, 99) = 0.26, P = 0.86. (d) Food-port entry rate during the devaluation probe tests. Value: F(1, 33) = 15.65, P = 0.0004; Stress: F(1, 33) = 0.23, P = 0.63; Virus: F(1, 33) = 0.20, P = 0.65; Value x Stress: F(1, 33) = 2.75, P = 0.11; Value x Virus: F(1, 33) = 0.09, P = 0.76; Virus x Stress: F(1, 33) = 0.17, P = 0.68; Value x Stress x Virus: F(1, 33) = 1.73, P = 0.20. Control, Value: F(1, 16) = 12.42, P = 0.003; Virus: F(1, 16) = 0.0007, P = 0.98; Value x Virus: F(1, 16) = 0.40, P = 0.53. Stress, Value: F(1, 17) = 3.46, P = 0.08; Virus: F(1, 17) = 0.45, P = 0.51; Value x Virus: F(1, 17) = 1.71, P = 0.21. Control eYFP N = 11 (7 male), Control ChR2 N = 7 (4 males), Stress eYFP N = 9 (2 male), Stress ChR2 N = 10 Stress (3 male). (e-f) Chemogenetic activation of BLA→DMS projections during post-stress instrumental learning. (e) Food-port entry rate across training. Training: F(2.55, 84.12) = 1.64, P = 0.19; Stress: F(1, 33) = 0.05, P = 0.95; Virus: F(1, 33) = 0.08, P = 0.78; Training x Stress: F(3, 99) = 0.16, P = 0.92; Training x Virus: F(3, 99) = 0.21, P = 0.89; Stress x Virus: F(1, 33) = 0.02, P = 0.89; Training x Stress x Virus: F(3, 99) = 3.07, P = 0.03. (f) Food-port entry rate during the devaluation probe test. Planned comparisons valued v. devalued, Control mCherry: t(20) = 1.88, P = 0.07; Control hM3Dq: t(10) = 1.32, P = 0.20; Stress mCherry: t(16) = 0.75, P = 0.46; Stress hM3Dq: t(18) = 3.36, P = 0.002. Control mCherry N = 12 (7 male), Stress mCherry N = 9 (5 male), Stress hM3Dq N = 10 Stress (5 male). Males = solid lines, Females = dashed lines. **P < 0.01.
Extended Data Figure 3-2:
Extended Data Figure 3-2:. Inhibition of BLA terminals in DMS is not rewarding or aversive.
Following training and testing (Figure 3h–n) mice receive a real-time place preference test in which 1 side of a 2-chamber apparatus was paired with optogenetic inhibition of BLA axons and terminals in the DMS. Average percent time spent in light-paired chamber across 2, 10-minute sessions (one with light paired with each side). t(19) = 0.65, P = 0.5. eYFP N = 10 (5 male), Arch N = 11 (5 male). Males = closed circles, Females = open circles.
Extended data Figure 4-1:
Extended data Figure 4-1:. Food-port entries during training with CeA→DMS manipulations and devaluation probe tests.
(a-b) Optogenetic inhibition of CeA→DMS projections during instrumental overtraining. (a) Food-port entry rates across training. Training: F(2.29, 45.82) = 1.81, P = 0.17; Virus: F(1, 20) = 0.67, P = 0.42; Training x Virus: F(8, 160) = 0.60, P = 0.77. (b) Food-port entry rates during the devaluation probe tests. Virus x Value: F(1, 20) = 4.51, P = 0.046; Value: F(1, 20) = 1.47, P = 0.24; Virus: F(1, 20) = 0.41, P = 0.53;. eYFP N = 11 (3 male), Arch N = 11 (7 male). (c-d) Optogenetic inactivation of CeA→DMS projections at reward during post-stress learning. (c) Food-port entry rates across training. Training: F(2.63, 84.18) = 3.21, P = 0.03; Stress: F(1, 32) = 0.60, P = 0.44; Virus: F(1, 32) = 4.75, P = 0.04; Training x Stress: F(3, 96) = 1.55, P = 0.21; Training x Virus: F(3, 96) = 2.42, P = 0.07; Stress x Virus: F(1, 32) = 0.04, P = 0.84; Training x Stress x Virus: F(3, 96) = 1.14, P = 0.34. (k) Food-port entry rate during the devaluation probe test. Value x Stress x Virus: F(1, 32) = 0.03, P = 0.86; Value: F(1, 32) = 6.44, P = 0.02; Stress: F(1, 32) = 2.02, P = 0.16; Virus: F(1, 32) = 1.09, P = 0.30; Value x Stress: F(1, 3) = 0.99, P = 0.33; Value x Virus: F(1, 32) = 0.02, P = 0.89; Virus x Stress: F(1, 32) = 0.24, P = 0.63. Control groups, Value x Virus: F(1, 18) = 0.09, P = 0.77; Value: F(1, 18) = 1.99, P = 0.17; Virus: F(1, 18) = 0.21, P = 0.65. Stress groups, Value x Virus: F(1, 14) = 0.0005, P = 0.98; Value: F(1, 14) = 3.94, P = 0.06; Virus: F(1, 14) = 0.85, P = 0.87. Control eYFP N = 9 (5 male), Control Arch N = 11 (4 male), Stress eYFP N = 7 (6 male), Stress Arch N = 9 (5 male). (e-f) Chemogenetic inhibition of CeA→DMS projections during post-stress instrumental learning. (e) Food-port entry rates across training. Training: F(1.85, 75.67) = 2.02, P = 0.14; Stress: F(1, 41) = 4.42, P = 0.04; Virus: F(1, 41) = 0.41, P = 0.53; Training x Stress: F(3, 123) = 3.08, P = 0.03; Training x Virus: F(3, 123) = 0.64, P = 0.59; Stress x Virus: F(1, 41) = 0.20, P = 0.66; Training x Stress x Virus: F(3, 123) = 3.23, P = 0.02. (f) Food-port entry rates during the devaluation probe tests. Planned comparisons valued v. devalued, Control mCherry: t(11) = 1.94, P = 0.06; Control hM3Dq: t(12) = 0.38, P = 0.71; Stress mCherry: t(10) = 0.05, P = 0.96; Stress hM3Dq: t(8) = 0.47, P = 0.64. Control mCherry N = 12 (5 male), Control hM4Di N = 13 (8 male), Stress mCherry N = 11 (5 male), Stress hM4Di N = 9 (4 male). (g-h) Optogenetic stimulation of CeA→DMS projections at reward during learning following subthreshold once daily stress (SubStress). (g) Food-port entry rate across training. Training: F(1.73, 34.50) = 0.89, P = 0.41; Virus: F(1, 20) = 0.46, P = 0.51; Training x Virus: F(3, 60) = 0.39, P = 0.76. (g) Food-port entry rate during the devaluation probe test. Virus x Value: F(1, 20) = 1.37, P = 0.26; Virus: F(1, 20) = 0.005, P = 0.94; Value: F(1, 20) = 1.36, P = 0.26. eYFP N = 10 (4 male), ChR2 N = 12 (6 male). Males = solid lines, Females = dashed lines.
Extended data Figure 4-2:
Extended data Figure 4-2:. Optogenetic stimulation of CeA→DMS projections in control mice.
(a) We used an intersectional approach to express the excitatory opsin Channelrhodopsin 2 (ChR2), or a fluorophore control in DMS-projecting CeA neurons and implanted optic fibers above the CeA. (b) Representative images of retro-cre expression in DMS and immunofluorescent staining of cre-dependent ChR2 expression in CeA and schematic representation of retro-cre in DMS and cre-dependent ChR2 expression in CeA for all subjects. (c) Procedure schematic. Lever presses earned food pellet rewards on a random-ratio (RR) reinforcement schedule. We used blue light (473 nm, 10 mW, 20 Hz, 25-ms pulse width, 2 s) to stimulate CeA→DMS neurons during the collection of each earned reward in mice without a history of stress. Mice were then given a lever-pressing probe test in the Valued state, prefed on untrained food-pellet type to control for general satiety, and Devalued state prefed on trained food-pellet type to induce sensory-specific satiety devaluation (order counterbalanced). (d) Press rates across training. Training: F(1.85, 38.75) = 62.18, P < 0.0001; Virus: F(1, 21) = 0.23, P = 0.64; Training x Virus: F(3, 63) = 0.05, P = 0.98. (e) Food-port entries across training. Training: F(2.42, 50.77) = 2.00, P = 0.14; Virus: F(1, 21) = 1.85, P = 0.19; Training x Virus: F(3, 63) = 0.22, P = 0.88. (f) Press rate during the devaluation probe test. Value: F(1, 21) = 20.32, P = 0.0002; Virus: F(1,21) = 0.92, P = 0.35; Virus x Value: F(1, 21) = 1.17, P = 0.29. (g) Devaluation index. t(21) = 1.37, P = 0.19. (h) Food-port entries during the devaluation probe tests. Value: F(1, 21) = 30.07, P < 0.0001; Virus: F(1, 21) = 0.12, P = 0.73; Virus x Value: F(1, 21) = 3.45, P = 0.08. eYFP N = 17 (9 male), ChR2 N = 6 (3 male). ** P < 0.01, *** P < 0.001. Optogenetic activation of CeA→DMS projections at reward during learning neither affects affect acquisition of the lever-press behavior, nor the action-outcome learning needed to support flexible goal-directed decision making during the devaluation test.
Extended data Figure 4-3:
Extended data Figure 4-3:. Activation of CeA→DMS projections is neither rewarding or aversive.
Following training and testing mice receive a real-time place preference test in which 1 side of a 2-chamber apparatus was paired with optogenetic stimulation of DMS-projecting CeA neurons. (a) Average percent time spent in light paired chamber across 2, 10-minute sessions (one with light paired with each side) in handled control subjects. t(21) = 1.75, P = 0.10. eYFP N = 17 (9 male), ChR2 N = 6 (3 male). (b) Average percent time spent in light paired chamber across 2, 10-minute sessions (one with light paired with each side) in subjects with a prior once/daily stress for 14 d. t(16) = 0.52, P = 0.61. eYFP N = 8 (4 male), ChR2 N = 10 (6 male). Males = closed circles, Females = open circles.
Figure 1:
Figure 1:. A recent history of chronic stress disrupts action-outcome learning and potentiates habit formation.
(a) Procedure schematic. Stress, chronic unpredictable mild stress. Lever presses earn food pellet rewards on a random-ratio (RR) reinforcement schedule, prior to lever-pressing probe test in the Valued state, prefed on untrained food-pellet type to control for general satiety, and Devalued state prefed on trained food-pellet type to induce sensory-specific satiety devaluation (order counterbalanced). (b) Blood serum corticosterone 24 hr after 14 d of 1 stressor/d, 2 stressors/d, or daily handling (Control). Stress: F(2, 20) = 17.35, P < 0.0001. Control N = 8 (4 male), 1x stress N = 7 (3 male), 2x stress N = 8 (4 male). (c) Percent change (Δ) in body weight averaged across the first 10 d of stress on ad libitum food. t14 = 4.50, P = 0.0005. N = 8/group (4 male). (d) Press rate across training (beginning with the last day of fixed-ratio 1 training). Training: F(2.12, 95.32) = 168.20, P < 0.0001. (e) Press rate during the devaluation probe test. Stress x Value: F(1, 45) = 4.43, P = 0.04. (f) Devaluation index [(Devalued condition presses)/(Valued condition presses + Devalued presses)]. t(45) = 2.99, P = 0.005. Control N = 22 (13 male), Stress N = 25 (12 male). (g) Procedure schematic. After stress, lever pressing earned pellets with a probability of 0.1. A lever-pressing probe test was conducted following contingency degradation during which presses earned pellets but pellets were also delivered non-contingency absent a press with the same probability or non-degraded control. (h) Press rate across training. Training: F(1.66, 41.39) = 211.10, P < 0.0001. (i) Press rate during the lever-pressing probe test. Stress x Contingency Degradation Group: F(1, 25) = 12.75, P = 0.002. Control, Non-degraded N = 7 (3 male), Control, Degraded N = 7 (3 male), Stress Non-degraded N = 7 (3 male) Stress Degraded N = 8 (4 male). Males = closed circles/solid lines, Females = open circles/dashed lines. **P <0.01, ***P < 0.001.
Figure 2:
Figure 2:. The BLA→DMS pathway is typically activated by rewards during action-outcome learning, chronic stress attenuates this and instead progressively recruits CeA→DMS pathway activity to learning.
(a) Intersectional approach for fiber photometry calcium imaging of DMS-projecting BLA or CeA neurons. (b) Schematic representation of retrograde AAV-cre in DMS and cre-dependent GCaMP8s expression and optical fiber tips in BLA or CeA for all subjects. (c) Procedure schematic. Stress, chronic unpredictable stress. Lever presses earned food pellet rewards on a random-ratio (RR) reinforcement schedule. (d-i) Fiber photometry recordings of GCaMP8s in BLA→DMS neurons during instrumental lever press – food-pellet reward learning. (d) Representative images of retro-cre expression in DMS and immunofluorescent staining of cre-dependent GCaMP8s expression and fiber placement in BLA. (e) Press rate across training. Training: F(1.72, 32.66) = 81.40, P < 0.0001. (f-g) Z-scored Δf/F BLA→DMS GCaMP8s fluorescence changes aligned to bout-initiating presses (f) and reward collection (g) averaged across trials for each subject (shading reflects between-subject s.e.m.) across each training session. (h-i) Quantification of area under the BLA→DMS GCaMP8s Z-scored ∆f/F curve (AUC) during the 3-s period prior to initiating presses (h; Training: F(2.49, 47.38) = 0.91, P = 0.43) or following reward collection (i; Stress: F(1, 19) = 24.13, P < 0.0001). Control N = 9 (4 male), Stress N = 12 (5 male). (j-o) Fiber photometry recordings of GCaMP8s in CeA→DMS neurons during instrumental lever press – food-pellet reward learning. (j) Representative immunofluorescent image of retro-cre expression in DMS and cre-dependent GCaMP8s expression and fiber placement in CeA. (k) Press rate across training. Training: F(1.51, 30.23) = 65.61, P < 0.0001. (l-m) Z-scored Δf/F CeA→DMS GCaMP8s fluorescence changes aligned to bout-initiating presses (l) and reward collection (m) averaged across trials for each subject across each training session. (n-o) Quantification of CeA→DMS GCaMP8s Z-scored ∆f/F AUC during the 3-s period prior to initiating presses (n; P = 0.58; Stress: F(1, 20) = 0.74, P = 0.40) or following reward collection (o; Training x Stress: F(3, 60) = 4.51, P = 0.006). Control N = 11 (6 male), Stress N = 11 (4 male). Males = closed circles/solid lines, Females = open circles/dashed lines. *P <0.05, **P <0.01, ***P < 0.001.
Figure 3:
Figure 3:. The BLA→DMS pathway mediates action-outcome learning and is suppressed by chronic stress to disrupt agency and promote habit formation.
(a-f) Optogenetic BLA→DMS inactivation at reward during instrumental learning. (a) Approach for optogenetic inhibition of BLA terminals in DMS. (b) Top, representative immunofluorescent images of Arch expression in BLA and optical fiber tip in the vicinity of Arch-expressing BLA terminals in DMS. Bottom, schematic representation of Arch expression in BLA and approximate location of optical fiber tips in DMS for all subjects. (c) Procedure schematic. Lever presses earned food-pellet rewards on a random-ratio (RR) reinforcement schedule. BLA→DMS projections were optogenetically inhibited at the time of reward during training. Mice were then given a lever-pressing probe test in the Valued state, prefed on untrained food-pellet type and Devalued state prefed on trained food-pellet type to induce sensory-specific satiety devaluation (order counterbalanced). (d) Press rate across training. Training: F(1.70, 32.34) = 41.26, P < 0.0001. (e) Press rate during the devaluation probe test. Stress x Value: F(1, 19) = 14.35, P = 0.001. (f) Devaluation index [(Devalued condition presses)/(Valued condition presses + Devalued presses)]. t(19) = 5.03, P < 0.0001. eYFP N = 10 (5 male), Arch N = 11 (5 male). (g-l) Optogenetic BLA→DMS activation at reward during post-stress learning. (g) Intersectional approach for optogenetic activation of DMS-projecting BLA neurons. (h) Top, representative immunofluorescent images of retro-cre expression in DMS and cre-dependent ChR2 expression in BLA. Bottom, schematic representation of retro-cre in DMS and cre-dependent hM3Dq expression in BLA for all subjects. (i) Procedure schematic. Stress, chronic unpredictable stress. After stress, lever presses earned reward on a random-interval (RI) reinforcement schedule. BLA→DMS projections were optogenetically stimulated at the time of reward during training prior to devaluation tests. (j) Press rate across training. Training: F(1.95, 64.18) = 30.17, P < 0.0001. (k) Press rate during the devaluation probe test. Value x Stress x Virus: F(1, 33) = 6.74, P = 0.01. Control groups, Value x Virus: F(1, 16) = 0.3.13, P = 0.10. Stress groups, Value x Virus: F(1, 17) = 4.23, P = 0.05. (l) Devaluation index. Stress x Virus: F(1, 33) = 9.64, P = 0.004. Control eYFP N = 11 (7 male), Control ChR2 N = 7 (4 males), Stress eYFP N = 9 (2 male), Stress ChR2 N = 10 Stress (3 male). (m-r) Chemogenetic BLA→DMS activation during post-stress learning. (m) Intersectional approach for chemogenetic activation of DMS-projecting BLA neurons. (n) Top, representative immunofluorescent images of retro-cre expression in DMS and cre-dependent hM3Dq expression in BLA. Bottom, schematic representation of retro-cre in DMS and cre-dependent hM3Dq expression in BLA for all subjects. (o) Procedure schematic. After stress, lever presses earned reward on a RI reinforcement schedule. BLA→DMS projections were chemogenetically activated (CNO, clozapine-N-oxide) during training prior to devaluation tests. (p) Press rate across training. Training: F(2.04, 67.36) = 73.32, P < 0.0001. (q) Press rate during the devaluation probe test. Planned comparisons valued v. devalued, Control mCherry: t(11) = 2.76, P = 0.01; Control hM3Dq: t(5) = 0.89, P = 0.38; Stress mCherry: t(8) = 1.25, P = 0.22; Stress hM3Dq: t(9) = 2.9, P = 0.007. (r) Devaluation index. Stress x Virus: F(1, 33) = 11.60, P = 0.002. Control mCherry N = 12 (7 male), Control hm3Dq N = 6 (3 male), Stress mCherry N = 9 (5 male), Stress hM3Dq N = 10 (5 male). Males = closed circles/solid lines, Females = open circles/dashed lines. *P < 0.05, **P < 0.01, ***P < 0.001.
Figure 4:
Figure 4:. The CeA→DMS pathway mediates habit formation and is recruited by chronic stress to promote premature habits.
(a-f) Optogenetic inactivation of CeA→DMS projections at reward during natural habit formation. (a) Approach for optogenetic inhibition of CeA terminals in DMS. (b) Top, representative immunofluorescent images of Arch expression in CeA and optical fiber tip in the vicinity of Arch-expressing CeA terminals in the DMS. Bottom, schematic representation of Arch expression in BLA and approximate location of optical fiber tips in DMS for all subjects. (c) Procedure schematic. Lever presses earned food pellet rewards on a random-interval (RI) reinforcement schedule. Mice were overtrained to promote habit formation. CeA→DMS projections were optogenetically inactivated during each training session prior to lever-pressing probe tests in the Valued state, prefed on untrained food-pellet type, and Devalued state prefed on trained food-pellet type to induce sensory-specific satiety devaluation (order counterbalanced). (d) Press rate across training. Training: F(1.46, 29.09) = 15.69, P = 0.0001. (e) Press rate during the devaluation probe test. Virus x Value: F(1, 20) = 4.72, P = 0.04. (f) Devaluation index [(Devalued condition presses)/(Valued condition presses + Devalued presses)]. t(20) = 2.80, P = 0.01. eYFP N = 11 (3 male), Arch N = 11 (7 male). (g-l) Optogenetic CeA→DMS inactivation at reward during post-stress learning. (g) Approach for optogenetic inhibition of CeA terminals in DMS. (h) Top, representative immunofluorescent images of Arch expression in CeA and optical fiber tip in the vicinity of Arch-expressing CeA terminals in the DMS. Bottom, schematic representation of Arch expression in BLA and approximate location of optical fiber tips in DMS for all subjects. (i) Procedure schematic. Stress, 2x daily chronic unpredictable stress. Lever presses earned food-pellet rewards on a RI reinforcement schedule. CeA→DMS projections were optogenetically inactivated at reward during training, prior to devaluation tests. (j) Press rate across training. Training: F(2.15, 68.91) = 31.05, P < 0.0001. (k) Press rate during the devaluation probe test. Value x Stress x Virus: F(1, 32) = 4.14, P = 0.05. Control groups, Value x Virus: F(1, 18) = 0.15, P = 0.70. Stress groups, Value x Virus: F(1, 14) = 12.88, P = 0.003. (l) Devaluation index. Stress x Virus: F(1, 32) = 4.47, P = 0.04. Control eYFP N = 9 (5 male), Control Arch N = 11 (4 male), Stress eYFP N = 7 (6 male), Stress Arch N = 9 (5 male). (m-r) Chemogenetic CeA→DMS inhibition during post-stress learning. (m) Intersectional approach for chemogenetic inhibition of DMS-projecting CeA neurons. (n) Top, representative immunofluorescent images of retro-cre expression in DMS. Bottom, cre-dependent hM4Di expression in CeA and schematic representation of retro-cre in DMS and cre-dependent hM4Di expression in CeA for all subjects. (o) Procedure schematic. After stress, lever presses earned food-pellet rewards on a RI reinforcement schedule. CeA→DMS projections were chemogenetically inactivated (CNO, clozapine-N-oxide) during training, prior to devaluation tests. (p) Press rate across training. Training: F(1.54, 63.31) = 21.12, P < 0.0001. (q) Press rate during the devaluation probe test. Planned comparisons valued v. devalued, Control mCherry: t(11) = 4.59, P < 0.0001; Control hM3Dq: t(12) = 0.73, P = 0.46; Stress mCherry: t(10) = 0.47, P = 0.64; Stress hM3Dq: t(8) = 2.41, P = 0.02. (r) Devaluation index. Stress x Virus: F(1, 41) = 5.99, P = 0.02. Control mCherry N = 12 (5 male), Control hM4Di N = 13 (8 male), Stress mCherry N = 11 (5 male), Stress hM4Di N = 9 (4 male). (s-x) Optogenetic CeA→DMS stimulation at reward during learning following subthreshold chronic stress. (s) Intersectional approach for optogenetic stimulation of DMS-projecting CeA neurons. (t) Top, representative images of retro-cre expression in DMS and immunofluorescent staining of cre-dependent ChR2 expression in CeA. Bottom, schematic representation of retro-cre in DMS and cre-dependent ChR2 expression in CeA for all subjects. (u) Procedure schematic. Subthresold stress, 1x daily chronic unpredictable stress. Lever presses earned food pellet rewards on a random-ratio (RR) reinforcement schedule. CeA→DMS projections were optogenetically activated at the time of reward during training, prior to devaluation tests. (v) Press rate across training. Training: F(2.30, 45.90) = 71.93, P < 0.0001. (w) Press rate during the devaluation probe test. Virus x Value: F(1, 20) = 7.40, P = 0.01. (x) Devaluation index. t(20) = 3.29, P = 0.0004. eYFP N = 10 (4 male), ChR2 N = 12 (6 male). Males = closed circles/solid lines, Females = open circles/dashed lines. ns = not significant. ^P = 0.069, *P < 0.05, **P < 0.01, ***P <0.001.

References

    1. Wassum K. M. Amygdala-cortical collaboration in reward learning and decision making. Elife 11 (2022). 10.7554/eLife.80926 - DOI - PMC - PubMed
    1. Balleine B. W. The Meaning of Behavior: Discriminating Reflex and Volition in the Brain. Neuron 104, 47–62 (2019). 10.1016/j.neuron.2019.09.024 - DOI - PubMed
    1. Balleine B. W. & Dickinson A. Goal-directed instrumental action: contingency and incentive learning and their cortical substrates. Neuropharmacology 37, 407–419 (1998). - PubMed
    1. Malvaez M. & Wassum K. Regulation of habit formation in the dorsal striatum. Current Opinion in Behavioral Sciences 20, 67–74 (2018). - PMC - PubMed
    1. Graybiel A. M. Habits, rituals, and the evaluative brain. Annu Rev Neurosci 31, 359–387 (2008). 10.1146/annurev.neuro.29.051605.112851 - DOI - PubMed

Publication types