[Preprint]. 2023 Oct 2:2023.10.02.560024.
doi: 10.1101/2023.10.02.560024.

MAP1B Regulates Cortical Neuron Interstitial Axon Branching Through the Tubulin Tyrosination Cycle

Affiliations

MAP1B Regulates Cortical Neuron Interstitial Axon Branching Through the Tubulin Tyrosination Cycle

Jakub Ziak et al. bioRxiv. .

Update in

Abstract

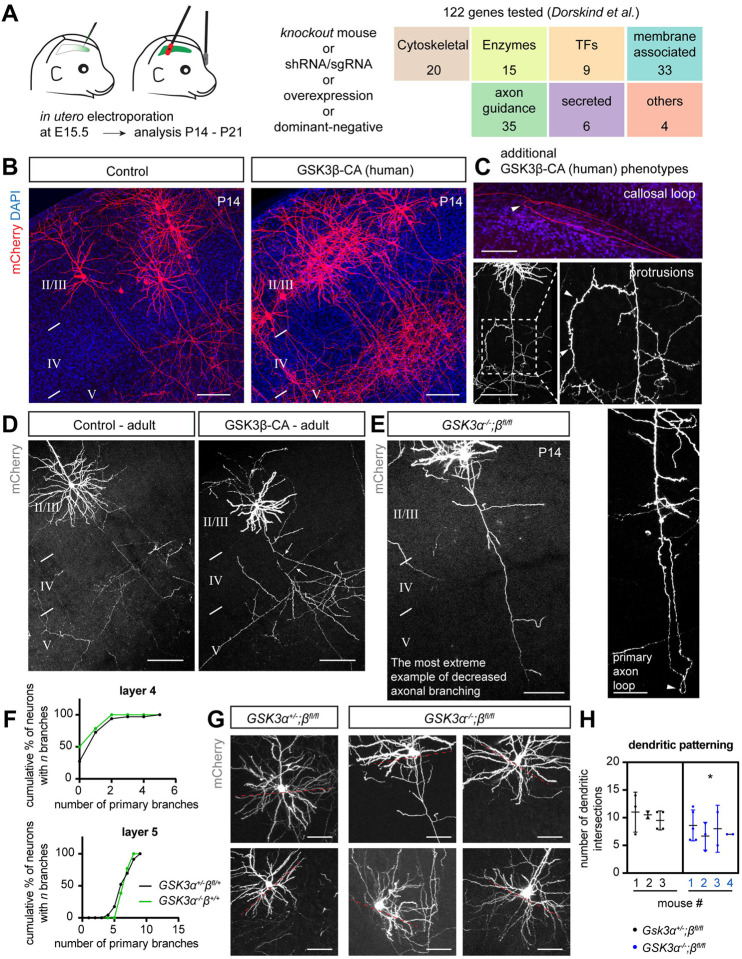
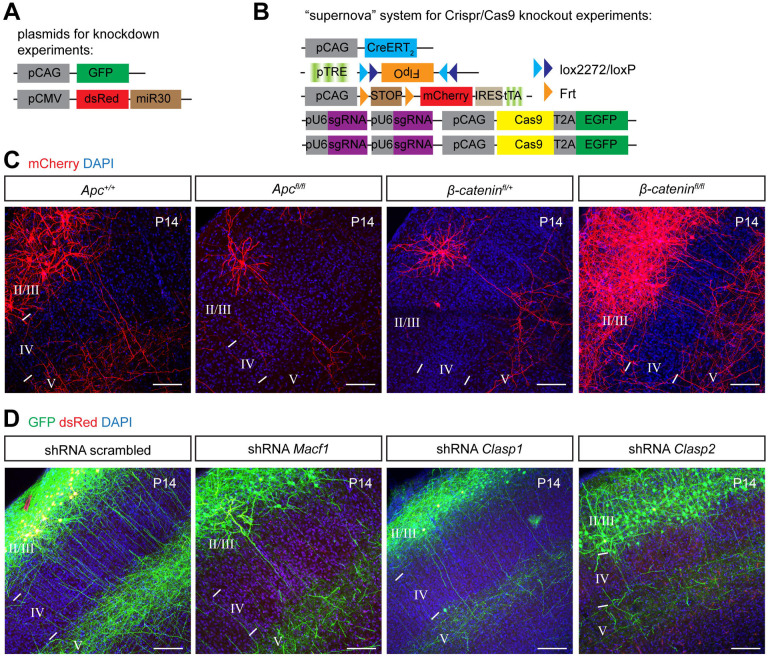
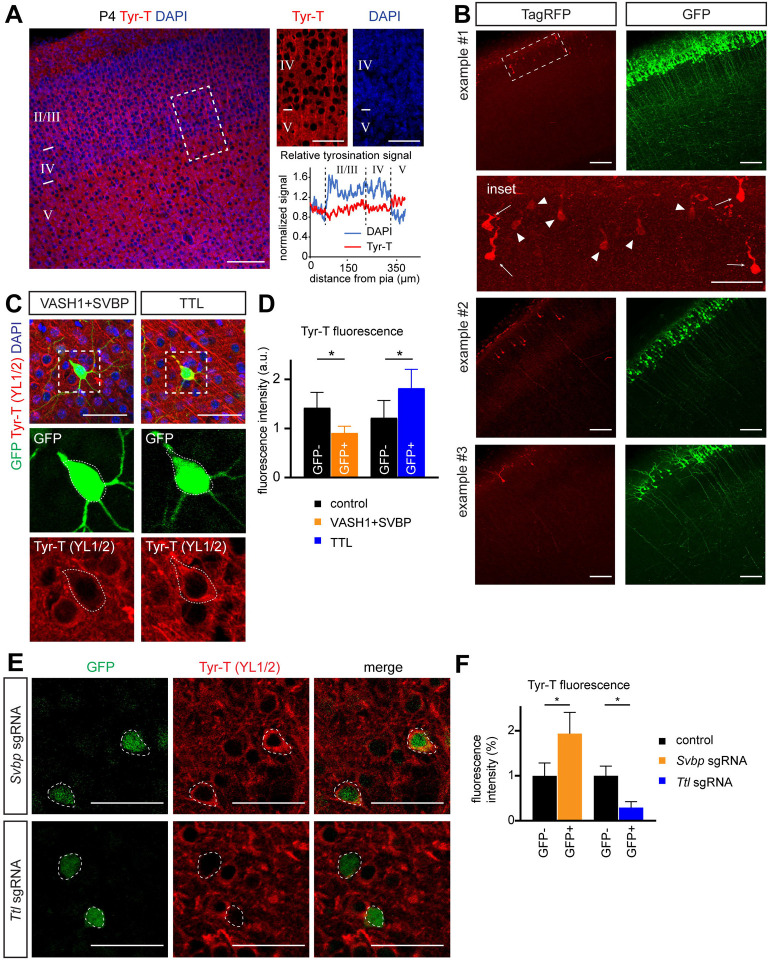
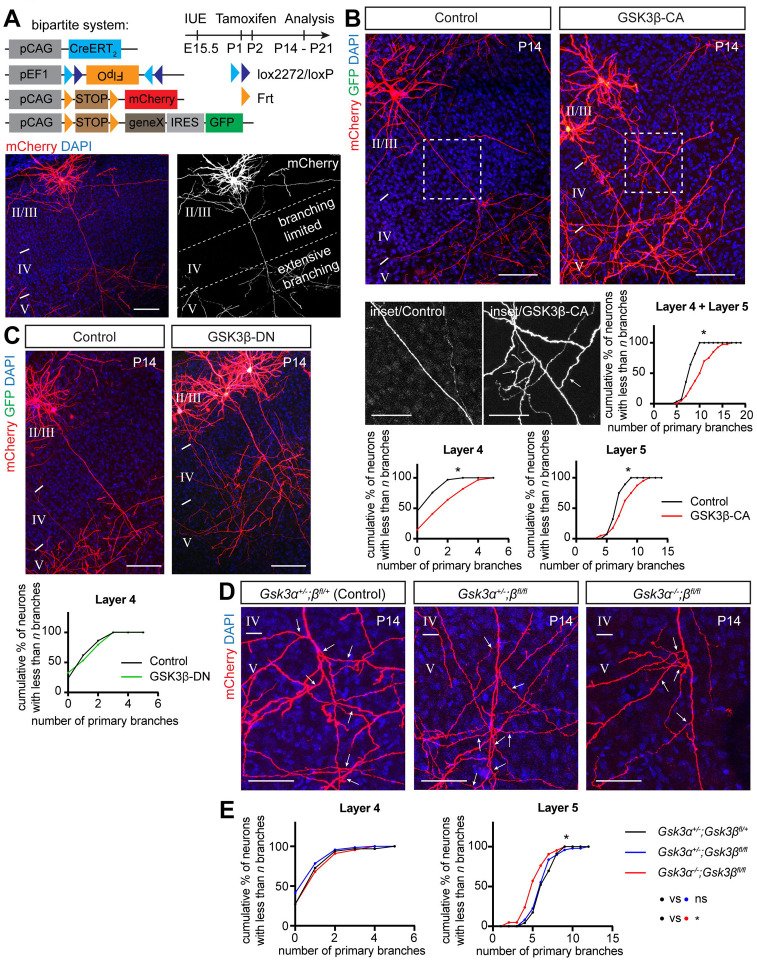
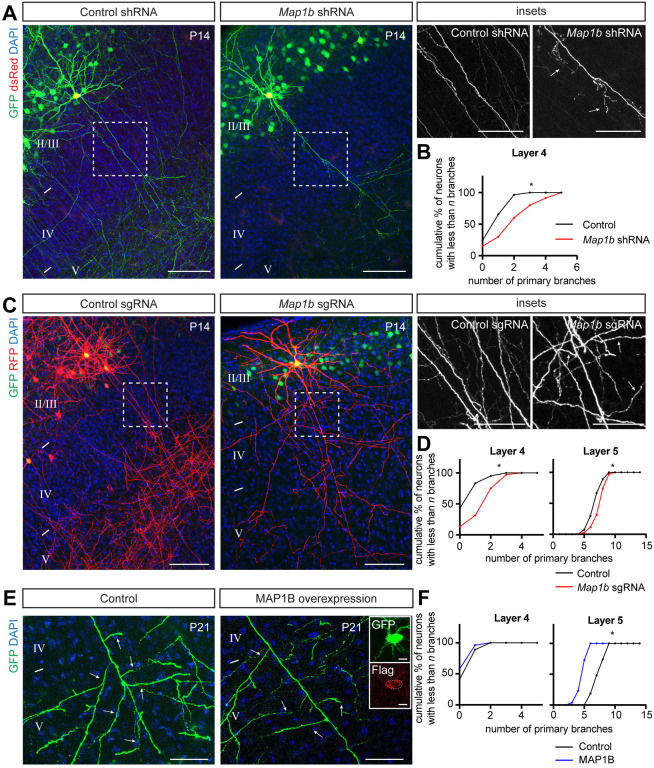
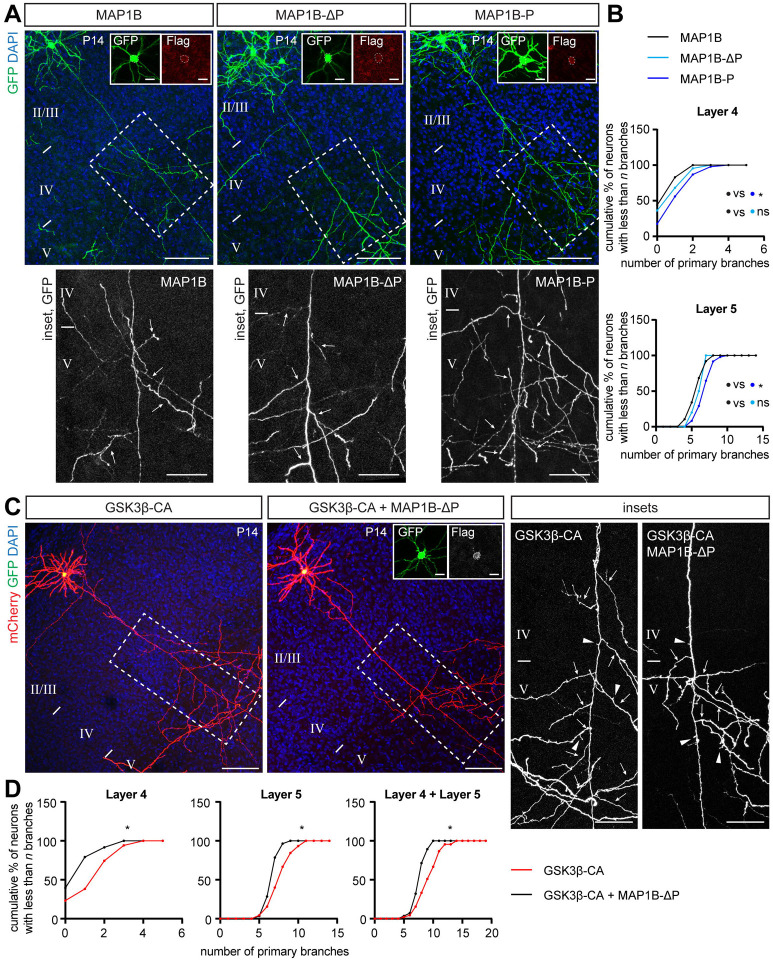
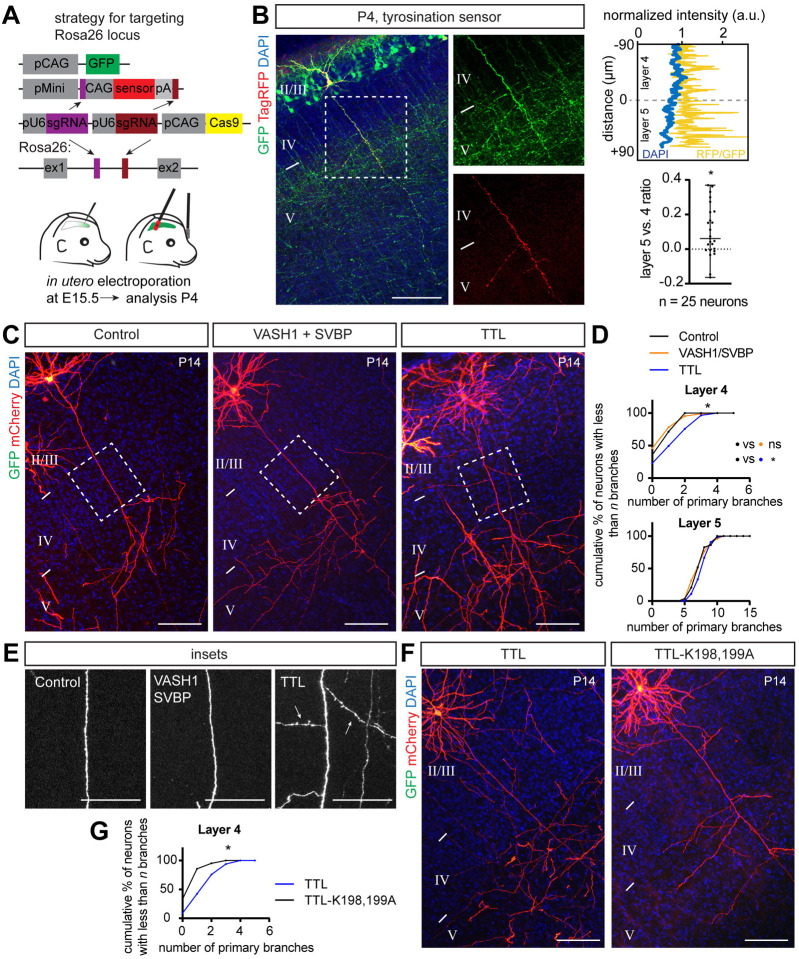
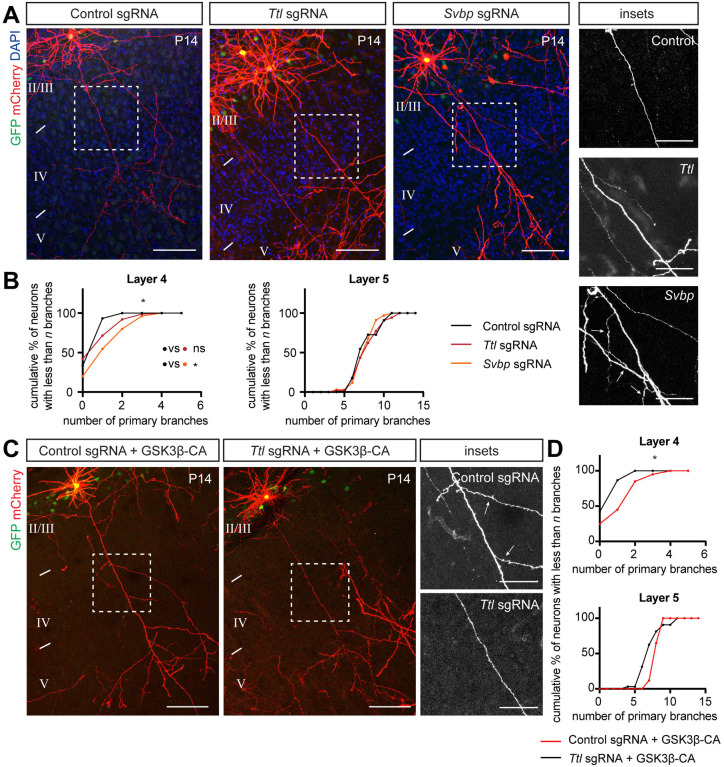
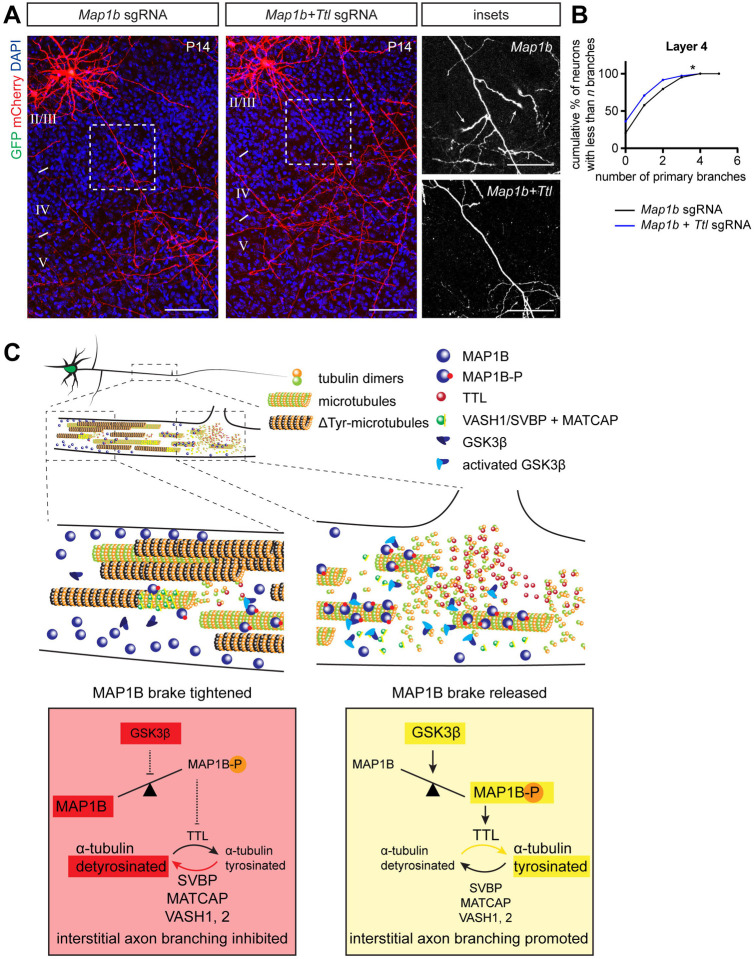
Regulation of directed axon guidance and branching during development is essential for the generation of neuronal networks. However, the molecular mechanisms that underlie interstitial axon branching in the mammalian brain remain unresolved. Here, we investigate interstitial axon branching in vivo using an approach for precise labeling of layer 2/3 callosal projection neurons (CPNs), allowing for quantitative analysis of axonal morphology at high acuity and also manipulation of gene expression in well-defined temporal windows. We find that the GSK3β serine/threonine kinase promotes interstitial axon branching in layer 2/3 CPNs by releasing MAP1B-mediated inhibition of axon branching. Further, we find that the tubulin tyrosination cycle is a key downstream component of GSK3β/MAP1B signaling. We propose that MAP1B functions as a brake on axon branching that can be released by GSK3β activation, regulating the tubulin code and thereby playing an integral role in sculpting cortical neuron axon morphology.

Keywords: Interstitial axon branching; cortical neuron development; intracellular signaling; microtubules.


Conflict of interest statement

DECLARATION OF INTERESTS The authors declare no competing interests. RH currently serves as a Director of Neuroscience at Prilenia Therapeutics. JD currently works at Novartis.

Figures

Figure EV1:
Figure EV1:. GSK3βregulates neuronal morphology in layer 2/3 CPNs. (related to Figure 1)
(A) Overview of original candidate molecule screen for identification of CPN interstitial axon branching regulators. (B) Overexpression of human constitutively active GSK3β (GSK3β-CA) induces ectopic interstitial axon branching in layer 2/3 CPNs. Scale bars: 100 μm. (C) Additional changes in axonal morphology induced by human GSK3β-CA include axonal loops and spiny protrusions along axons (arrowheads). Scale bars: 100 μm (including callosal loop and protrusions, right), 50 μm (primary axon loop, bottom right). (D) GSK3β-CA-induced interstitial axon branching (arrows) in layer 2/3 CPNs persist until adulthood. Scale bars: 100 μm. (E) Example of a severe loss of interstitial axon branches following removal of both Gsk3α and Gsk3β isoforms in the mouse (related to Fig 1D). Scale bars: 100 μm. (F) Quantification of axon interstitial branching in GSK3α−/−+/+ mutant mice. Controls are the same as those shown in Fig 1D. (G) Basal dendrite patterning in layer 2/3 CPNs is regulated by GSK3 isoforms. Red dotted line (placed at right angle to the apicobasal orientation of a neuron) highlights the region where dendritic intersections were calculated. Scale bars: 50 μm. (H) Quantification of dendritic intersections from (G). * p<0.05, t-test.
Figure EV2:
Figure EV2:. Candidate survey for GSK3β targets that regulate interstitial axon branching. (related to Figure 2)
(A) Experimental approach for shRNA-mediated knockdown experiments. (B) Experimental approach for CRISPR/Cas9-mediated knockout experiments. (C) Removal of Apc or β-catenin using conditional knockout mice does not influence interstitial axon branching in layer 4. Scale bars: 100 μm. (D) Knockdown of Macf1, Clasp1 or Clasp2 does not influence interstitial axon branching in layer 4. Scale bars: 100 μm.
Figure EV3:
Figure EV3:. Analysis of the GSK3β target MAP1B subcellular localization in cortical neurons using CRISPR/Cas9 endogenous tagging. (related to Figure 2 and Figure 3)
(A) Experimental design for endogenous tagging experiments using CRISPR/Cas9 knockin approach. (B) Example of endogenous GFP-β-actin tagging. Note accumulation of GFP in actin-rich dendritic spines (dendritic spines, right). Scale bars: 100 μm (left), 10 μm (dendritic spines). (C–D) Representative images showing endogenous tagging of Map1b and Gsk3β at P4 or P14 cortices. Note strong expression of MAP1B, which fills entire neuron, including the most distal axonal compartments in the corpus callosum (panel C, bottom). Insets in C and D show axonal expression. Scale bars: 100 μm. (E) Overexpression of MAP1B-P leads to ectopic interstitial axon branching in layer 4. For this analysis, control neurons from Fig 2E were used.
Figure EV4:
Figure EV4:. Tyrosination of α-tubulin in S1 neocortex under normal and experimental conditions. (related to Figure 4)
(A) Immunostaining of P4 cortex with an antibody directed against tyrosinated tubulin (Tyr-T, YL1/2 clone). Note sharp increase in the Tyr-T signal between layer 4 and 5. The tyrosination signal in layers 2 – 5 was normalized to the signal in cortical layer 1. Scale bar: 100 μm, 50 μm (insets). (B) Examples of a fluorescence intensity distributions after targeting Rosa26 locus via the TKIT approach (see main text). In the detail for the example #1, note that a small population of neurons expresses high levels of TagRFP (arrows), while a larger population of neurons expresses lower levels of TagRFP (arrowheads). Scale bar: 100 μm, 50 μm (inset). (C, D) Immunostaining of Tyr-T after TTL and VASH1/SVBP overexpression experiments. Note lack of a tyrosination signal following VASH1/SVBP overexpression and an increase in the tyrosination signal after TTL overexpression. Data are presented as mean ± st.d. * p<0.05, t-test. Scale bar: 50 μm. (E) Immunostaining of Tyr-T following CRISPR knockdown. Note decrease of the tyrosination signal after TTL deletion and an increase in the signal after SVBP deletion. GFP labels electroporated cells that harbor the pX458 plasmid (cells with a dashed contour). Scale bar: 50 μm. (F) Quantification of the tyrosination signal in targeted (GFP+) cells, normalized to GFP- cells from the same slices. Data are presented as mean ± st.d. * p<0.05, t-test.
Figure EV5:
Figure EV5:. Disrupting the tubulin/tyrosination cycle causes aberrant interstitial axon branching.(related to Figure 5)
(A, B) Simultaneous removal of Svbp and Matcap promotes interstitial axon branching to the same extent as Svbp deletion alone. Data analysis and presentation are as in Figure 1. * p<0.05, t-test. Scale bars: 100 μm. (C) Comparison of Svbp knockdown with combined Svbp+Matcap knockdown. t-test. Scale bars: 100 μm.
Figure 1.
Figure 1.. Activation of GSK3β in layer 2/3 callosal projection neurons promotes interstitial axon branching.
(A)Bipartite system for sparse gene expression and neuronal labeling in the layer 2/3 CPNs. Plasmids (pCAG-CreERT2, pEF1-Flex-FlpO, pCAG-Frt-STOP-Frt-mCherry, optionally pCAG-Frt-STOP-Frt-geneX-IRES-GFP) were in utero electroporated at E15.5 and tamoxifen was administered into the milk spot of the P1 and P2 pups. Brains were analyzed at P14 or P21 (note a time stamp in all images). An example of an individual sparsely labeled layer 2/3 neuron is shown in lower panels. The DAPI signal was used to identify individual cortical layers (II/III, IV and V) in all experiments. See Table EV1 for detailed information about plasmids used in all experiments. Scale bars: 100 μm. (B) Overexpression of constitutively active GSK3β induces interstitial axon branching in layer 2/3 CPNs. Confocal images of representative neurons are shown, with insets from axonal segments passing through layer 4 (arrows, ectopic interstitial branches). Primary interstitial axon branches were quantified in layers 4 and 5. Data are presented as a relative cumulative distribution of neurons with the indicated number of axonal branches. A curve shifted to the right represents increased branching and vice versa. The same graphical representation is used throughout all following figures. See Source Data for detailed branching quantification for every sample in the form of scatter dot plots. For the description of statistics, see Materials/Methods. Data were fitted into the Mixed Effects Model and analyzed with either a t-test or a one-way ANOVA. Table EV1 contains absolute p values for all comparisons. * p<0.05, t-test. Scale bars: 100 μm, 50 μm (inset). (C) Overexpression of dominant-negative GSK3β does not lead to changes in interstitial axon branching. Branches were quantified in layer 4, and data analysis is the same as in panel B. Scale bars: 100 μm. (D, E) GSK3α and GSK3β are necessary for the generation of interstitial axon branches. Cell-autonomous deletion of Gsk3β (using pCAG-CreERT2, pEF1-Flex-FlpO, pCAG-Frt-STOP-Frt-mCherry plasmids) does not influence axonal branching, however removal of both Gsk3α and Gsk3β leads to a decrease in the number of primary interstitial axon branches in cortical layer 5. The insets show axonal segments passing through layer 5 (arrows, interstitial branches). Data analysis and presentation is the same as in panel A. * p<0.05, ANOVA with post hoc Dunnet’s test. Scale bars: 50 μm.
Figure 2.
Figure 2.. MAP1B restricts layer 2/3 CPN axon interstitial branching.
(A, B) Knockdown of Map1b using shRNA IUE leads to the generation of aberrant interstitial axon branches in layer 4 (arrows, right insets). Data analysis and presentation as in Figure 1. * p<0.05, t-test. Scale bars: 100 μm, 50 μm (insets). (C, D) Knockout of Map1b using CRISPR/Cas9 IUE leads to the generation of aberrant interstitial axon branches in cortical layers 4 and 5 (arrows, insets on right). Data analysis and presentation is the same as in Figure 1. * p<0.05, t-test. Scale bars: 100 μm, 50 μm (insets). (E, F) Gain-of-function (GOF) experiments with a full-length Flag-tagged MAP1B leads to reduction of interstitial branching in layer 5 (arrows). Inset on the right shows GFP and Flag signals in the cell body of analyzed neurons. Data analysis and presentation as in Figure 1. * p<0.05, t-test. Scale bars: 50 μm, 10 μm (inset on right).
Figure 3.
Figure 3.. Branch-restrictive properties of MAP1B are released following GSK3β phosphorylation.
(A, B) Overexpression of Flag-tagged MAP1B, dephosphomimetic MAP1B mutant (MAP1B S1260A, T1265A, S1391A, referred to here as MAP1B-ΔP) and phosphomimetic MAP1B mutant (MAP1B S1260D, T1265D, S1391D, referred as MAP1B-P) in layer 2/3 CPNs. Insets show details of neuronal cell bodies with GFP and Flag signals. Insets at bottom show interstitial axon branches forming in layer 5 (arrows). MAP1B-ΔP has a similar effect on branching as wild-type MAP1B, while MAP1B-P increases the number of axonal branches in comparison with wild-type MAP1B. Data analysis and presentation as in Figure 1. * p<0.05, ANOVA with post hoc Dunnet’s test. Scale bars: 100 μm, 50 μm (insets at bottom), 10 μm (cell body insets). (C, D) MAP1B-ΔP rescues the GSK3β-CA phenotype. Overexpression of GSK3β-CA together with dephosphomimetic MAP1B-ΔP reduces the overall number of interstitial axon branches compared to GSK3β-CA alone. Inset shows GFP and Flag signals in the neuronal cell body. Insets on right show segments of layer 4 and 5 with arrows marking interstitial axon branches. Note that short protrusions (axon segments shorter than 30 μm) are formed under both conditions (arrowheads). Data analysis and presentation as in Figure 1. * p<0.05, t-test. Scale bars: 100 μm, 50 μm (insets), 10 μm (cell body insets).
Figure 4.
Figure 4.. α-tubulin tyrosination promotes collateral axon branching.
(A) Strategy for analysis of tyrosinated α-tubulin distribution using a Tag-RFP sensor that recognizes tyrosinated tubulin and a CRISPR/Cas9 knockin approach (see main text for sensor details). Plasmids were delivered at E15.5 via in utero electroporation, the sensor was expressed from the Rosa26 locus following targeted insertion, and the tyrosination signal was analyzed at P4. (B) An example of tyrosinated tubulin sensor distribution along layer 2/3 CPN axons. The Tag-RFP signal in layer 4 and layer 5 was normalized to co-electroporated GFP and is presented as a normalized intensity. A sample trace is shown at the top right, where the blue line denotes the DAPI signal and the yellow line denotes normalized RFP/GFP intensity. Bottom right: RFP/GFP intensity in axons passing through layer 4 and layer 5 was compared using a Wilcoxon Matched-pairs test and is presented as a layer 5/layer 4 ratio (individual values together with mean ± min/max are plotted). * p<0.05. Scale bar: 100 μm. (C) Gain of function experiments with VASH1 and SVBP (to promote detyrosination) and TTL (to promote tyrosination) show that TTL overexpression is sufficient to promote interstitial axon branching. Promoting detyrosination did not influence interstitial axon branch formation. Scale bars: 100 μm. (D) Quantification of the effect of VASH1/SVBP and TTL overexpression on interstitial axon branching. Data analysis and presentation as in Figure 1. * p<0.05, ANOVA with post hoc Dunnet’s test. (E) Insets from (C) highlight axon segments within layer 4. Note ectopic branches formed in layer 4 following TTL overexpression (arrows). Scale bars: 50 μm. (F, G) Overexpression of a dominant-negative TTL (TTL-K198,199A) does not lead to the formation of ectopic interstitial axon branches in layer 2/3 CPNs, indicating that enzymatic activity of TTL is necessary to for this process. Data analysis and presentation as in Figure 1. * p<0.05, t-test. Scale bars: 100 μm.
Figure 5.
Figure 5.. Disrupting the tubulin tyrosination cycle causes aberrant interstitial axon branching.
(A, B) Loss-of-function of enzymes regulating tyrosination/detyrosination cycle using a CRISPR/Cas9 approach. Svbp deletion increased the number of primary axon branches in layer 4. Ttl deletion did not affect interstitial axon branching. Insets on right show ectopic axon branches in axons passing through layer 4 following removal of Svbp (arrows). Data analysis and presentation as in Figure 1. * p<0.05, ANOVA with post hoc Dunnet’s test. Scale bars: 100 μm, 50 μm (insets). (C, D) TTL acts downstream from GSK3β. Removal of Ttl via CRISPR/Cas9 in neurons overexpressing GSK3β-CA rescues GSK3β-CA-induced ectopic branching (arrows in insets on right). Data analysis and presentation as in Figure 1. * p<0.05, t-test. Scale bars: 100 μm, 50 μm (insets).
Figure 6.
Figure 6.. GSK3β/MAP1B regulates interstitial axon branching through modification of tubulin tyrosination.
(A, B) TTL acts downstream from MAP1B. Removal of Ttl via CRISPR/Cas9 in neurons overexpressing GSK3β-CA rescues ectopic interstitial axon branching induced by Map1b deletion (arrows in insets on right). Data analysis and presentation as in Figure 1. * p<0.05, t-test. Scale bars: 100 μm, 50 μm (insets). (C) The intracellular signaling pathway that regulates the formation of interstitial axon branches in cortical neurons. Our results suggest the following model: MAP1B functions a brake on branching (left, red panel), which can be released following GSK3β-mediated phosphorylation (right, yellow panel). Subsequently, the ratio of tyrosinated/detyrosinated tubulin shifts towards the tyrosinated form, promoting the formation of interstitial axon branches.

References

    1. Winnubst J., Bas E., Ferreira T.A., Wu Z., Economo M.N., Edson P., Arthur B.J., Bruns C., Rokicki K., Schauder D., et al. (2019). Reconstruction of 1,000 Projection Neurons Reveals New Cell Types and Organization of Long-Range Connectivity in the Mouse Brain. Cell 179, 268–281.e13. 10.1016/j.cell.2019.07.042. - DOI - PMC - PubMed
    1. Chédotal A., and Richards L.J. (2010). Wiring the brain: the biology of neuronal guidance. Cold Spring Harb. Perspect. Biol. 2, a001917. 10.1101/cshperspect.a001917. - DOI - PMC - PubMed
    1. Greig L.C., Woodworth M.B., Galazo M.J., Padmanabhan H., and Macklis J.D. (2013). Molecular logic of neocortical projection neuron specification, development and diversity. Nat. Rev. Neurosci. 14, 755–769. 10.1038/nrn3586. - DOI - PMC - PubMed
    1. Armijo-Weingart L., and Gallo G. (2017). It takes a village to raise a branch: Cellular mechanisms of the initiation of axon collateral branches. Mol. Cell. Neurosci. 84, 36–47. 10.1016/j.mcn.2017.03.007. - DOI - PMC - PubMed
    1. Gibson D.A., and Ma L. (2011). Developmental regulation of axon branching in the vertebrate nervous system. Development 138, 183–195. 10.1242/dev.046441. - DOI - PMC - PubMed

Publication types