[Preprint]. 2023 Oct 14:2023.10.14.562356.
doi: 10.1101/2023.10.14.562356.

The genetic basis of novel trait gain in walking fish

Affiliations

The genetic basis of novel trait gain in walking fish

Amy L Herbert et al. bioRxiv. .

Update in

  • Ancient developmental genes underlie evolutionary novelties in walking fish.
    Herbert AL, Allard CAH, McCoy MJ, Wucherpfennig JI, Krueger SP, Chen HI, Gourlay AN, Jackson KD, Abbo LA, Bennett SH, Sears JD, Rhyne AL, Bellono NW, Kingsley DM. Herbert AL, et al. Curr Biol. 2024 Oct 7;34(19):4339-4348.e6. doi: 10.1016/j.cub.2024.08.042. Epub 2024 Sep 26. Curr Biol. 2024. PMID: 39332403 Free PMC article.

Abstract

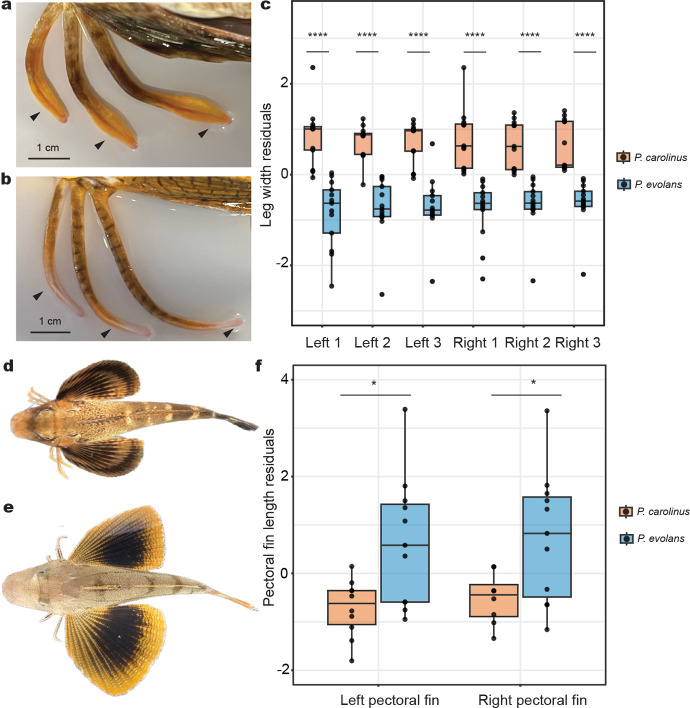
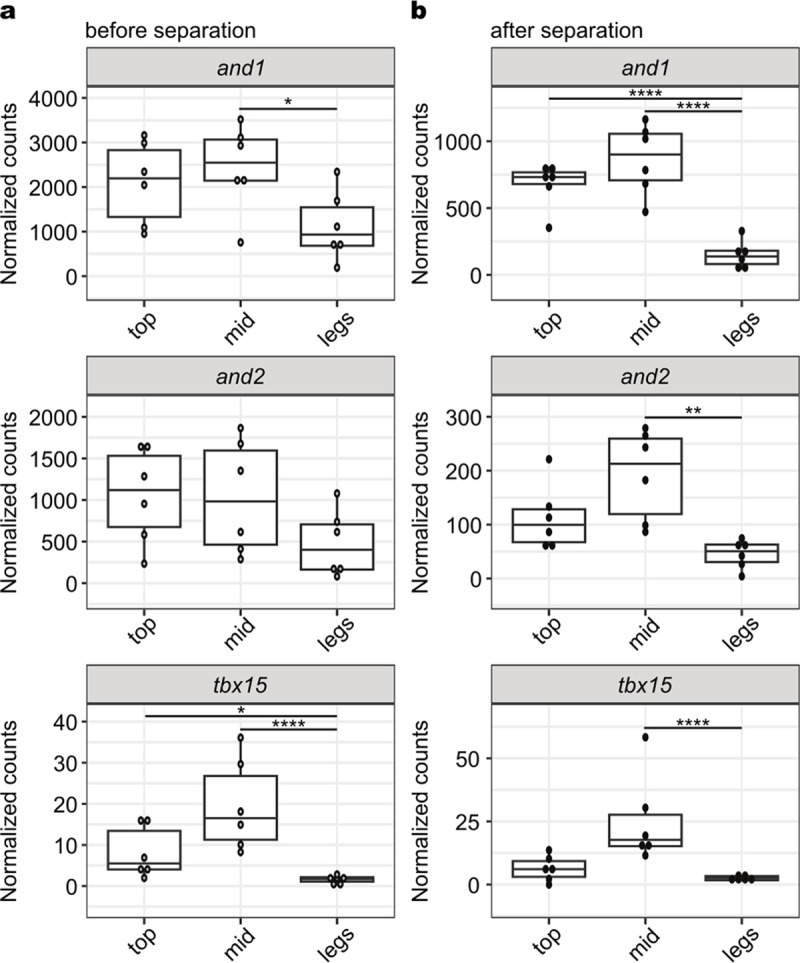
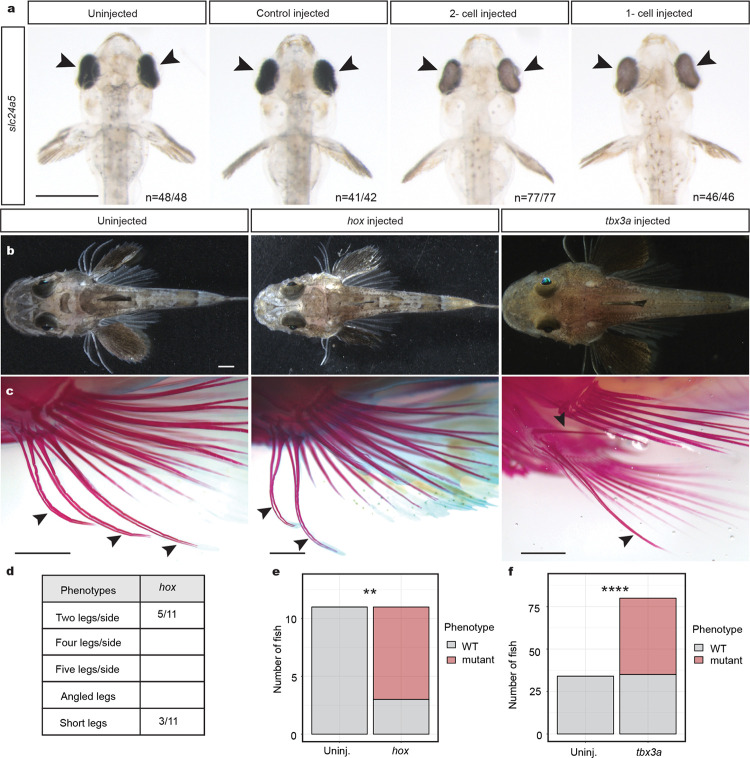
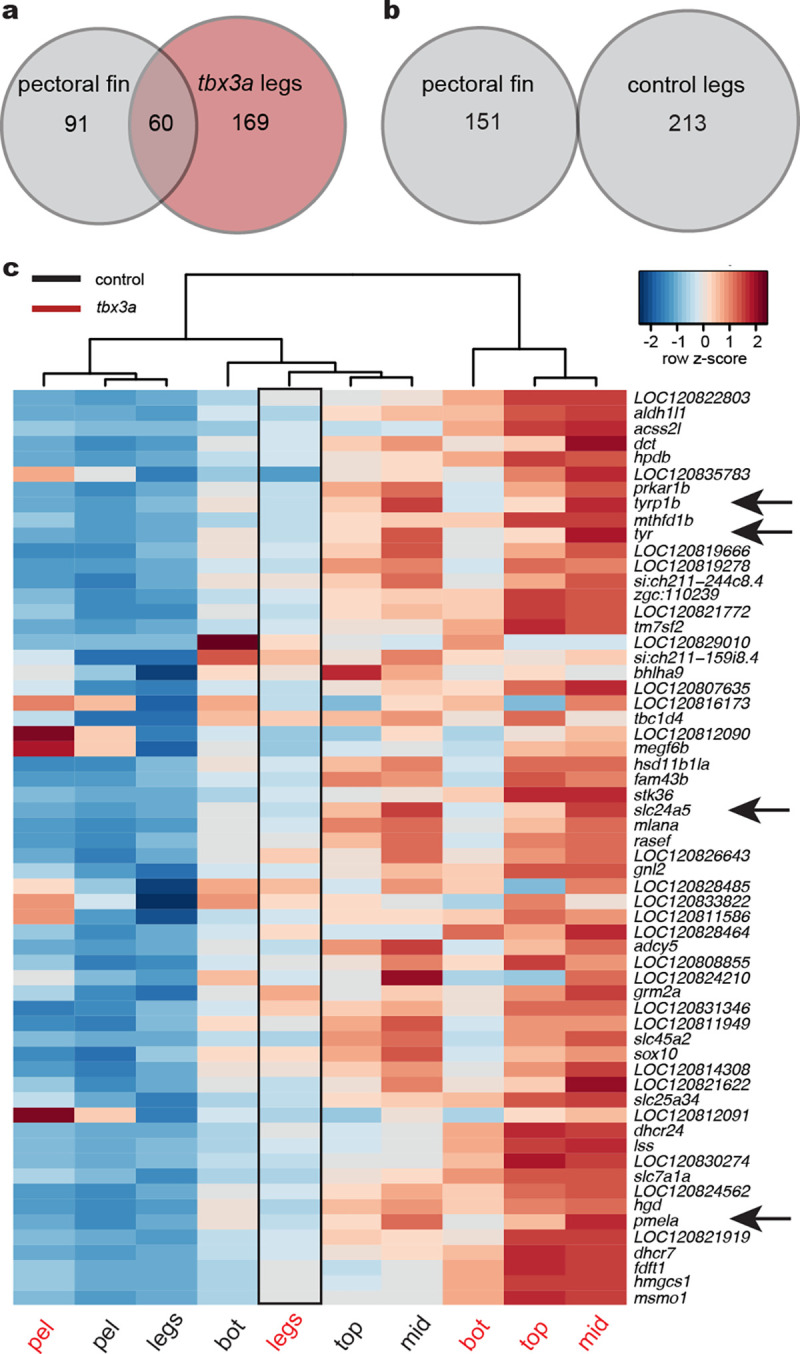
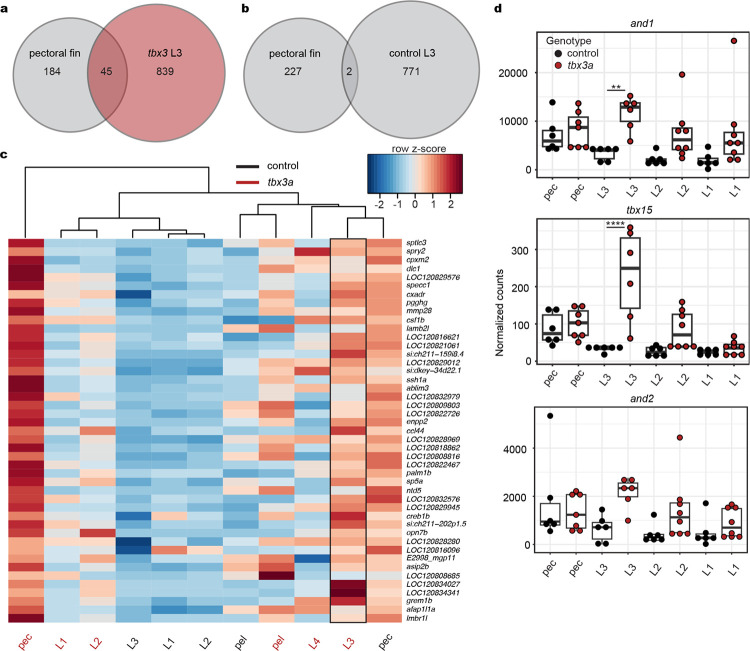
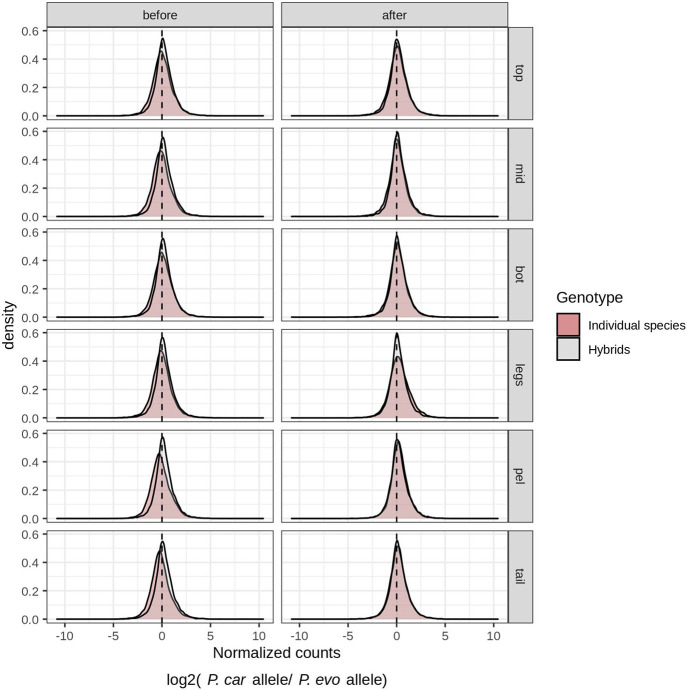
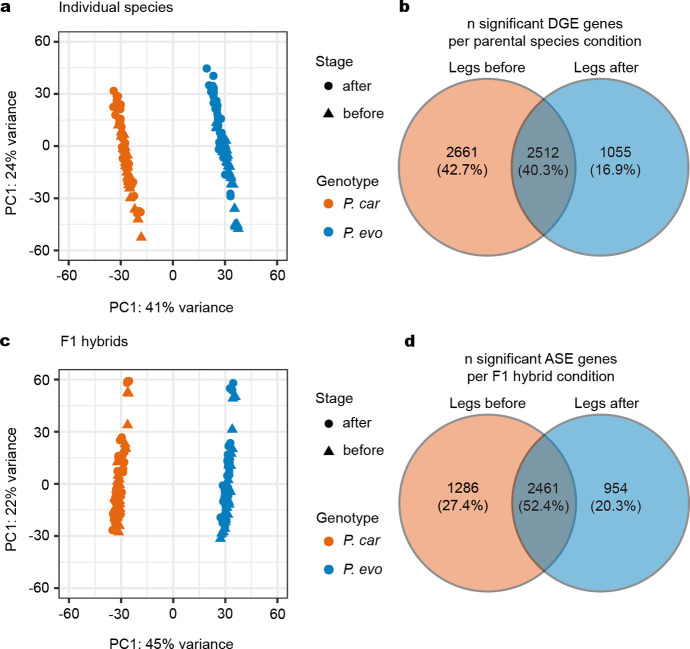
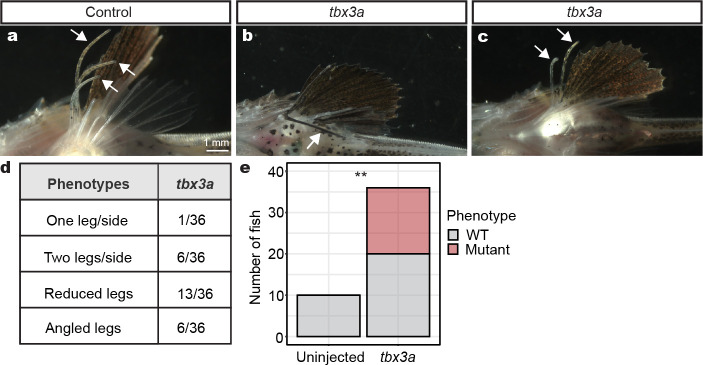
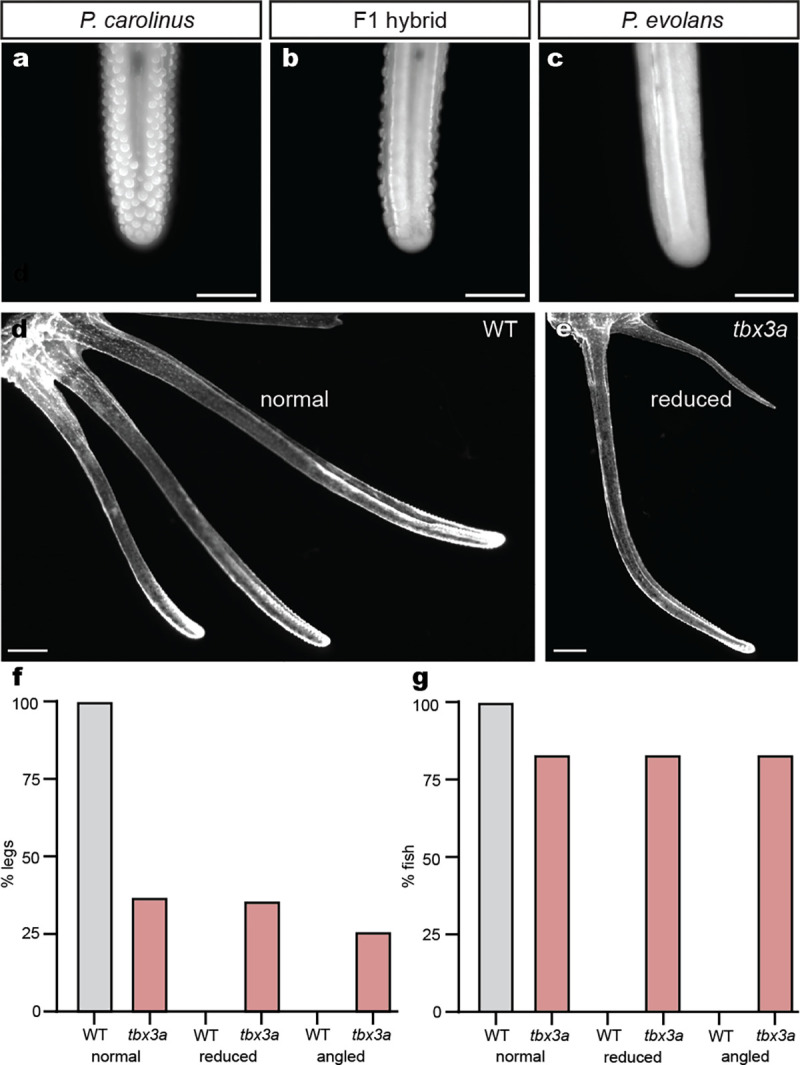
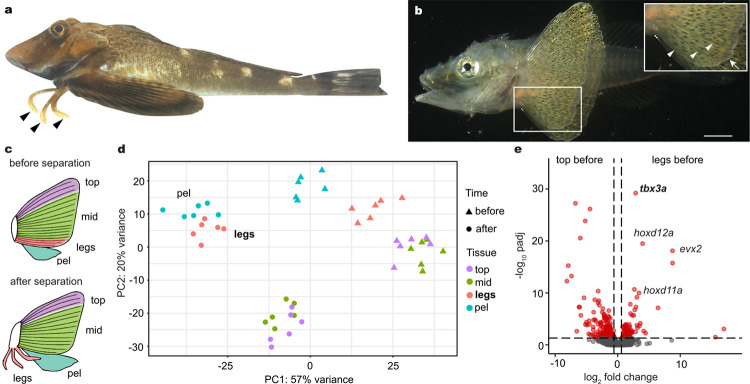
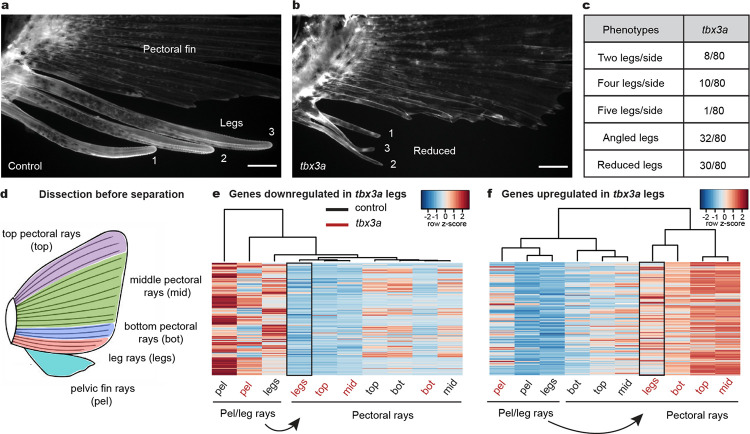
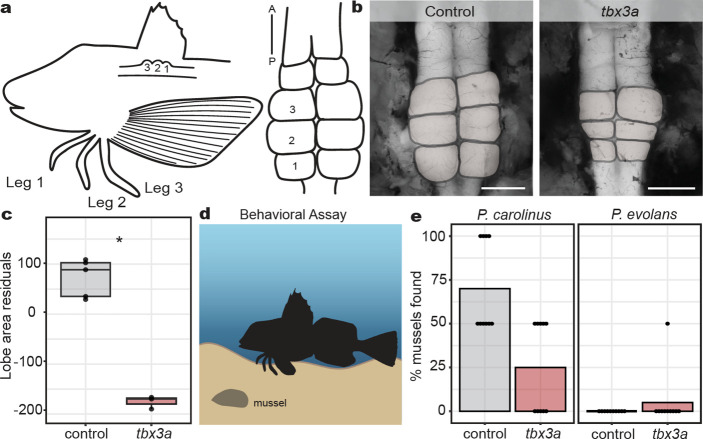
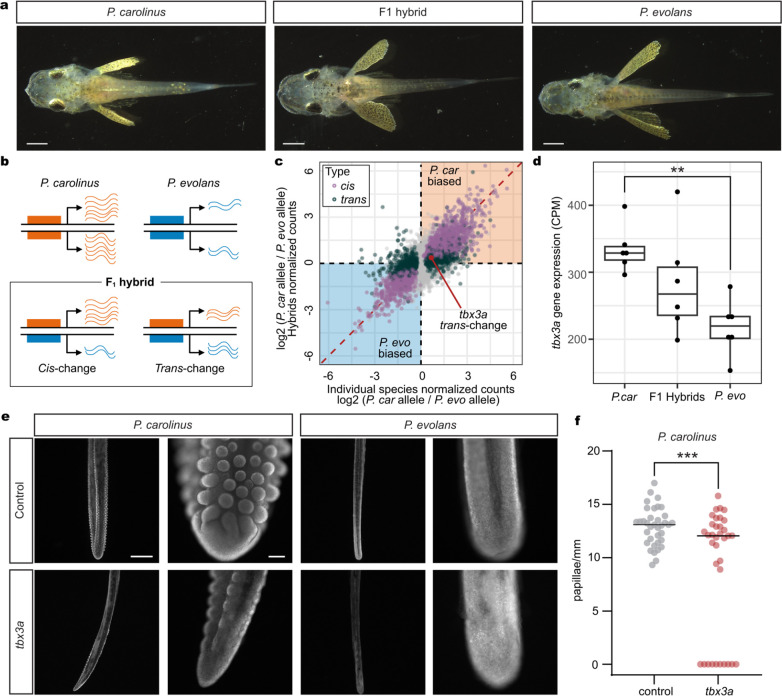
A major goal in biology is to understand how organisms evolve novel traits. Multiple studies have identified genes contributing to regressive evolution, the loss of structures that existed in a recent ancestor. However, fewer examples exist for genes underlying constructive evolution, the gain of novel structures and capabilities in lineages that previously lacked them. Sea robins are fish that have evolved enlarged pectoral fins, six mobile locomotory fin rays (legs) and six novel macroscopic lobes in the central nervous system (CNS) that innervate the corresponding legs. Here, we establish successful husbandry and use a combination of transcriptomics, CRISPR-Cas9 editing, and behavioral assays to identify key transcription factors that are required for leg formation and function in sea robins. We also generate hybrids between two sea robin species with distinct leg morphologies and use allele-specific expression analysis and gene editing to explore the genetic basis of species-specific trait diversity, including a novel sensory gain of function. Collectively, our study establishes sea robins as a new model for studying the genetic basis of novel organ formation, and demonstrates a crucial role for the conserved limb gene tbx3a in the evolution of chemosensory legs in walking fish.


Figures

Extended Data Fig. 1:
Extended Data Fig. 1:. Species-specific leg and fin differences.
a, P. carolinus exhibits thicker legs compared to the legs of P. evolans (b), including a shovel-like structure at the tip. c, Leg width regressed against the standard length (SL) of the fish. P. carolinus legs are significantly wider than P. evolans for every leg. d, Dorsal view of P. carolinus shows pectoral fin span compared to P. evolans (e). f, Left and right pectoral fin length residuals of P. evolans are significantly increased compared to P. carolinus. Box and whisker plots show the median at the center line and whiskers in the interquartile range (c, f). Significance determined by Wilcoxon rank sum test. In all graphs, *P < 0.05, ****P < 0.0001. N = 13 P. carolinus and N = 13 P. evolans (c, leg width measurements). N = 10 P. carolinus and N = 11 P. evolans (d, pectoral fin measurements).
Extended Data Fig. 2:
Extended Data Fig. 2:. Gene expression in developing fins.
a, Normalized gene counts from RNA-seq analysis of and1, and2, and tbx15 in developing legs and fins, including the top three fin rays (top), middle fin rays (mid) and the legs (leg) before leg separation. b, Normalized counts of genes after leg separation. Exact P-adjusted values: padj = 0.02 (a, and1), padj = 0.02 (a, tbx15 top vs. legs), padj = 3.36e-6 (a, tbx15 mid vs. legs), padj = 7.68e-12 (b, and1 top vs. legs), padj = 9.73e-15 (b, and1 mid vs. legs), padj = 0.0018 (b, and2), padj = 1.92e-16 (b, tbx15). N = 6 animals before separation and N = 6 animals after separation.
Extended Data Fig. 3:
Extended Data Fig. 3:. CRISPR-Cas9 genome editing of developmental genes.
a, Targeting of the pigment gene slc24a5 at the 1–2 cell stage reduced pigmentation in larval eyes (arrowheads) of injected animals compared to uninjected or control injected siblings. b, A dorsal view of uninjected, hox injected, and tbx3a injected sea robins shows normal gross morphology. Arrowheads point to legs in uninjected juveniles. c, Alizarin red staining shows fewer legs in the hox injected fish, as well as alteration to leg angle in the tbx3a fish. d, Quantification of crispant phenotypes in hox injected animals. e, f, Calculation of phenotype significance in hox crispants (e) and tbx3a crispants (f). Fisher’s exact test used for calculating significance. Exact P-values: P = 0.001 (e), P = 5.29e-10 (f). All scale bars = 1 mm.
Extended Data Fig. 4:
Extended Data Fig. 4:. Gene expression in tbx3a crispants before separation.
a, Venn diagram of overlapping genes upregulated in pectoral fins compared to control legs and tbx3a crispant legs compared to control legs (padj < 0.1). b, Venn diagram showing no overlap between genes upregulated in pectoral fins and genes upregulated in control legs compared to tbx3a crispant legs (padj < 0.1). c, Heatmap of the 60 intersecting genes identified in (a). Arrows point to pigment genes upregulated in tbx3a crispant legs compared to control legs. Exact P-adjusted values: padj = 0.03 (c, tyr, tbx3a crispant legs vs. control legs), padj = 0.03 (c, tyrp1b, tbx3a crispant legs vs. control legs), padj = 0.01 (c, slc24a5 tbx3a crispant legs vs. control legs), padj = 0.07 (c, pmela, tbx3a crispant legs vs. control legs).
Extended Data Fig. 5:
Extended Data Fig. 5:. Gene expression in tbx3a crispants after separation.
a, A diagram shows the tissues used in RNA-seq, including individual legs, the entire pectoral fin, and entire pelvic fin. b, Venn diagram of 45 overlapping genes upregulated in the pectoral fin compared to control leg 3 and tbx3a crispant leg 3 compared to control legs (cutoff set at padj < 0.1). c, Venn diagram showing two genes are upregulated in pectoral fins and in control legs compared to tbx3a crispant leg 3 (cut off set at padj < 0.1). d, Heatmap of the 45 intersecting genes identified in (b). e, Normalized gene counts of and1 and tbx15. And1 and tbx15 expression is upregulated in tbx3a crispant leg 3 compared to control leg 3. And2 counts show similar trends but do not rise to significance. Exact P-adjusted values: padj = 0.007 (e, and1, tbx3a crispant leg 3 vs. control leg 3), padj = 2.27e-9 (e, tbx15, tbx3a crispant leg 3 vs. control leg 3). N = 6 control animals and N = 8 tbx3a crispants (N = 7 tbx3a pec fins). N = 2/8 crispant animals had two legs.
Extended Data Fig. 6:
Extended Data Fig. 6:. Species-specific differential gene expression.
Density plots of normalized counts for P. carolinus versus P. evolans alleles in individual species (gray) and F1 hybrids (red) across different tissues (top, mid, bot, legs, pel, and tail) and developmental stages (before and after leg separation). The distribution of allele-specific expression in F1 hybrids is slightly biased toward P. carolinus alleles, which may reflect paternal allele bias or species-specific expression bias as has been noted in other studies, .
Extended Data Fig. 7:
Extended Data Fig. 7:. Gene expression in individual species and hybrids.
a, Principal component analysis of legs before and after separation in P. carolinus (P. car) and P. evolans (P. evo). b, Venn diagram of the number of genes with significant differential expression between P. car and P. evo legs before separation (orange) and after separation (blue) in parental species. c, Principal component analysis of legs before and after separation in F1 hybrids. d, Venn diagram of the number of genes with significant differential expression between P. car and P. evo alleles in legs before separation (orange) and after separation (blue) in F1 hybrids. Tissues include legs, bot, mid, top, pel, and tail.
Extended Data Fig. 8:
Extended Data Fig. 8:. P. evolans tbx3a crispant phenotypes.
a, Control legs in a P. evolans juvenile. b, An angled leg in a tbx3a crispant. c, A tbx3a crispant with two legs. d, Quantification of variable tbx3a P. evolans phenotypes. e, Calculation of phenotype significance in tbx3a crispants. Fisher’s exact test used for calculating significance. Exact P-value: P = 0.009. N = 10 controls and N = 36 tbx3a crispants.
Extended Data Fig. 9:
Extended Data Fig. 9:. Papillae and leg phenotypes across species, hybrids, and tbx3a crispants.
a, A juvenile P. carolinus leg exhibits robust papillae. b, An F1 hybrid shows intermediate papillae while a P. evolans animal lacks papillae (c). d, Control P. carolinus animals have three normal legs while legs in tbx3a crispants can appear normal or reduced in size (e). f, Quantification of different leg phenotypes in P. carolinus control and tbx3a crispants. g, Quantification of the percentage of fish exhibiting phenotypes. N = 36 control legs and N = 35 tbx3a legs analyzed (c) and N = 6 control and N = 6 tbx3a crispant fish analyzed (d). Papillae/mm were measured in the same animals and quantified in Fig. 4e. Scale bars, 500 μm (a, b, c); 1 mm (d, e).
Fig. 1:
Fig. 1:. Sea robin leg development and molecular profiling.
a, Sea robins are fish that exhibit novel leg-like structures (arrowheads). b, Legs develop from the bottom three fin rays initially connected to the rest of the pectoral fin. White arrowheads point to three connected fin rays and arrow points to fin webbing. c, Diagrams of fin tissues collected for RNA-seq at two time points, before and after leg separation. The pectoral fin was dissected into the top three fin rays (top), the middle part of the pectoral fin (mid) and the bottom three rays or legs (legs), depending on the time point. The pelvic fin (pel) was collected in its entirety. d, A PCA plot of all tissue samples shows legs beginning to cluster with the pelvic fin before separation. After separation, legs cluster with pelvic fins instead of the other pectoral fin components. e, Volcano plot showing upregulated expression of tbx3a, hoxd12a, evx2, and hoxd11a in future legs compared to the top portion of the pectoral fin before leg separation. Exact P-adjusted values: padj = 5.54e-31 (e, tbx3a), padj = 7.19e-20 (e, hoxd12a), padj = 1.26e-18 (e, evx2), padj = 1.68e-10 (e, hoxd11a). N = 6 animals before leg separation and N = 6 animals after leg separation. Scale bar, 1 mm (b).
Fig. 2:
Fig. 2:. Tbx3a disruption alters leg number and identity.
a, A lateral view of numbered WT legs in a control sea robin. b, Legs 1, 2, and 3 are reduced in a tbx3a crispant, and leg 1 is angled away from its usual position c, Quantification of crispant phenotypes in tbx3a injected animals (number of animals with phenotype/total number of animals phenotyped). d, Schematic of pectoral fin dissection into the top three pectoral rays (top), the middle pectoral rays (mid), the bottom three pectoral rays (bot) and the bottom three putative leg rays before separation (legs). The entire pelvic fin (pel) was collected in its entirety. e, A heatmap of genes downregulated in tbx3a crispant legs compared to control legs (padj < 0.1). f, A heatmap of genes upregulated in tbx3a crispant legs compared to control legs (padj < 0.1). N = 8 control animals and N = 10 tbx3a crispants. Scale bars, 1 mm (a, b).
Fig. 3:
Fig. 3:. Effects of tbx3a mutation on leg neural architecture and behavior.
a, Diagram of the 1:1 innervation relationship between sea robin legs and CNS lobes. b, Representative examples of control and tbx3a crispant lobes (lobes pseudo colored in gray). c, Lobe area was reduced in tbx3a crispants as measured by regressing against standard length (N = 5 control animals and N = 3 tbx3a crispants, P = 0.04 by Wilcoxon rank sum test). d, Schematic of behavioral assay used to test sensory behavior of sea robins (created with biorender). e, Digging behavior was reduced in tbx3a crispants versus control P. carolinus, closer to levels of non-digging P. evolans controls that were unaffected by tbx3a disruption. Two mussels were buried per trial. Discovery of both mussels resulted in a score of 100% while uncovering one mussel was scored as 50%. N = 10 trials across 6 animals per genotype used in analysis. Scale bars, 1 mm (b, both images).
Fig. 4:
Fig. 4:. Hybrids reveal species-specific gene regulation.
a, Dorsal views of P. carolinus, F1 hybrid, and P. evolans animals. b, A diagram shows how cis- and trans-regulation can be delineated by comparing gene expression differences in two separate species to allele-specific expression differences in F1 hybrid animals. c, Scatterplot showing gene expression differences between the two species (x-axis; N = 6 P. carolinus, N = 5 P. evolans) and the differences between the parental alleles in the F1 hybrid animals (y-axis; N = 6 F1 hybrids) in legs after separation. Genes are labeled as cis-regulated (purple; differential gene expression padj < 0.05 and allele-specific expression padj < 0.05) or trans-regulated (dark green; differential gene expression padj < 0.05 and allele-specific expression padj ≥ 0.05). Identity line is shown in red. d, RNA expression of tbx3a in counts per million (CPM) in P. evolans, F1 hybrids, and P. carolinus in legs after separation. Expression is higher in P. car compared to P. evo (log2 fold change = 0.67, padj = 0.0027). e, Control P. carolinus legs show abundant papillae (N = 5/5) that were reduced by tbx3a disruption (N = 2/3) while P. evolans legs lacked papillae in both control (N = 3/3) and tbx3a disrupted conditions (N = 3/3). f, Quantification of papillae density in P. carolinus controls (N = 6) and tbx3a crispants (N = 6). Exact P value: p = 0.0005, unpaired t-test with Welch’s correction. Scale bars, 1 mm (a); 1 mm, 100 μm (e).

Similar articles

References

    1. Stern D. L. & Orgogozo V. The loci of evolution: how predictable is genetic evolution? Evolution 62, 2155–2177 (2008). - PMC - PubMed
    1. Sucena E. & Stern D. L. Divergence of larval morphology between Drosophila sechellia and its sibling species caused by cis-regulatory evolution of ovo/shaven-baby. Proc. Natl. Acad. Sci. U.S.A 97, 4530–4534 (2000). - PMC - PubMed
    1. Gross J. B., Borowsky R. & Tabin C. J. A novel role for Mc1r in the parallel evolution of depigmentation in independent populations of the cavefish Astyanax mexicanus. PLoS Genet. 5, (2009). - PMC - PubMed
    1. Leal F. & Cohn M. J. Loss and re-emergence of legs in snakes by modular evolution of sonic hedgehog and HOXD enhancers. Curr. Biol. 26, 2966–2973 (2016). - PubMed
    1. Colosimo P. F., Hosemann K. E., Balabhadra S., Jr G. V., Dickson M., Grimwood J., Schmutz J., Myers R. M., Schluter D. & Kingsley D. M. Widespread parallel evolution in sticklebacks by repeated fixation of Ectodysplasin alleles. Science 307, 1928–1933 (2005). - PubMed

Publication types