[Preprint]. 2023 Oct 9:2023.10.06.561131.
doi: 10.1101/2023.10.06.561131.

G6PD Maintains Redox Homeostasis and Biosynthesis in LKB1-Deficient KRAS-Driven Lung Cancer

Affiliations

G6PD Maintains Redox Homeostasis and Biosynthesis in LKB1-Deficient KRAS-Driven Lung Cancer

Taijin Lan et al. bioRxiv. .

Update in

Abstract

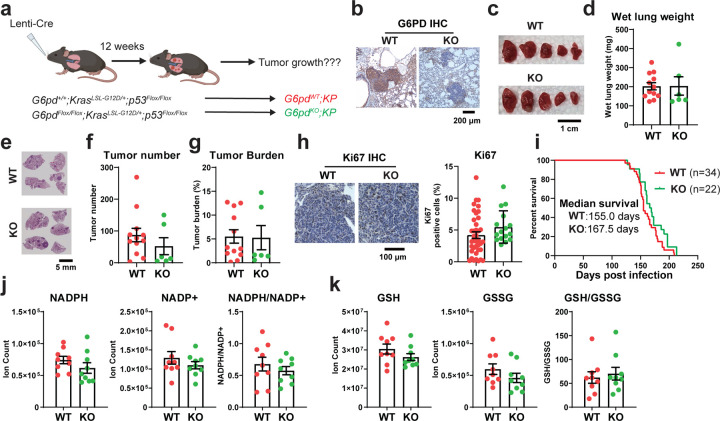
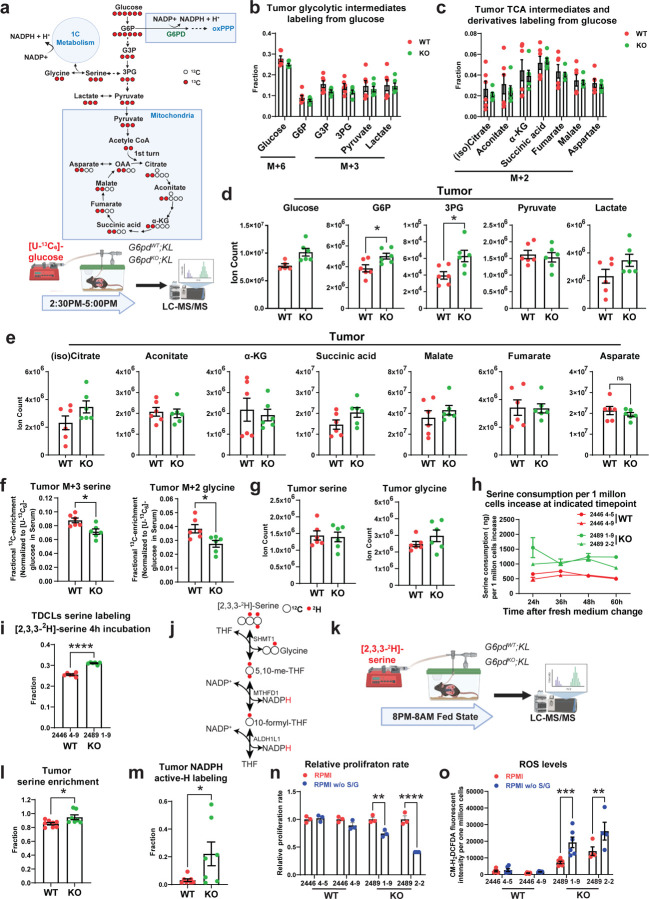
Cancer cells depend on nicotinamide adenine dinucleotide phosphate (NADPH) to combat oxidative stress and support reductive biosynthesis. One major NAPDH production route is the oxidative pentose phosphate pathway (committed step: glucose-6-phosphate dehydrogenase, G6PD). Alternatives exist and can compensate in some tumors. Here, using genetically-engineered lung cancer model, we show that ablation of G6PD significantly suppresses KrasG12D/+;Lkb1-/- (KL) but not KrasG12D/+;p53-/- (KP) lung tumorigenesis. In vivo isotope tracing and metabolomics revealed that G6PD ablation significantly impaired NADPH generation, redox balance and de novo lipogenesis in KL but not KP lung tumors. Mechanistically, in KL tumors, G6PD ablation caused p53 activation that suppressed tumor growth. As tumor progressed, G6PD-deficient KL tumors increased an alternative NADPH source, serine-driven one carbon metabolism, rendering associated tumor-derived cell lines sensitive to serine/glycine depletion. Thus, oncogenic driver mutations determine lung cancer dependence on G6PD, whose targeting is a potential therapeutic strategy for tumors harboring KRAS and LKB1 co-mutations.

Keywords: G6PD; KRAS; LKB1; NADPH; NSCLC; Redox; fatty acid synthesis; metabolic reprogramming; serine metabolism.


Conflict of interest statement

Potential Conflicts of Interest E. W. is a stockholder in a founder of Vescor Therapeutics. J. D. R. is an advisor and stockholder in Colorado Research Partners, L.E.A.F. Pharmaceuticals, Bantam Pharmaceuticals, Rafael Pharmaceuticals; a paid consultant of Third Rock Ventures; a founder, director and stockholder of Farber Partners, Serien Therapeutics and Sofro Pharmaceuticals; a founder and stockholder in Empress Therapeutics; and a director of the Princeton University–PKU Shenzhen collaboration. The Rabinowitz lab at Princeton University and the Princeton University-PKU Shenzhen collaboration have discovered and generated intellectual property regarding G6PD inhibitors. Other authors have no conflict of interest to declare.

Figures

Figure 1.
Figure 1.. High G6PD mRNA expression correlates with poor survival of lung cancer patients with KRAS/LKB1 co-mutations.
a. Overall survival comparison between low expression and high expression group of G6PD, IDH1, ME1 and MTHFD1 mRNA in lung cancer patients with KRAS wild type (WT), using data obtained from cBioPortal datasets. b. Overall survival comparison between low expression and high expression group of G6PD, IDH1, ME1 and MTHFD1 mRNA in lung cancer patients with KRAS mutations (MUT), using data obtained from cBioPortal datasets. c. Overall survival comparison between low expression and high expression group of G6PD, IDH1, ME1 and MTHFD1 mRNA in lung cancer patients with KRAS/LKB1 co-mutations (co-MUT), using data obtained from cBioPortal datasets. d. Overall survival comparison between low expression and high expression group of G6PD, IDH1, ME1 and MTHFD1 mRNA in lung cancer patients with KRAS/TP53 co-MUT, using data obtained from cBioPortal datasets. e. The mRNA expression levels of G6PD, ME1, IDH1, and MTHFD1 in lung cancer patients with KRAS/TP53 co-MUT and KRAS/LKB1 co-MUT, using data obtained from cBioPortal datasets. * P<0.05; ** P<0.01; *** P<0.005; **** P<0.001, ns: not significant
Figure 2.
Figure 2.. G6PD is not essential for KP lung tumorigenesis.
a. Scheme to induce conditional tumoral G6pd knockout to study the role of G6PD in KP lung tumorigenesis. b. Representative immunohistochemistry (IHC) images of G6PD in G6pdWT;KP and G6pdKO;KP lung tumors. c. Representative gross lung pathology from mice bearing G6pdWT;KP and G6pdKO;KP lung tumors at 12 weeks post-tumor induction. d. Graph of wet lung weight from mice bearing G6pdWT;KP and G6pdKO;KP lung tumors at 12 weeks post-tumor induction. e. Representative histology (H&E staining) of scanned lung sections from (c). f & g. Quantification of tumor number (f) and tumor burden (g) from (e). h. Representative IHC images and quantification of Ki67 in G6pdWT;KP and G6pdKO;KP lung tumors. i. Kaplan-Meier survival curve of mice bearing G6pdWT;KP or G6pdKO;KP lung tumors. P > 0.05, log-rank test. j. Pool size of NADPH and NADP+, and NADPH/NADP+ ratio in G6pdWT;KP and G6pdKO;KP lung tumors at 12 weeks post-tumor induction. k. Pool size of glutathione (GSH) and glutathione disulfide (GSSG), and GSH/GSSG ratio in G6pdWT;KP and G6pdKO;KP lung tumors at 12 weeks post-tumor induction. Data are mean± SEM. For D2O infusion, n=3 mice for each group.
Figure 3.
Figure 3.. G6PD promotes KL lung tumorigenesis.
a. Scheme to induce conditional tumoral G6pd knockout to study the role G6PD in KL lung tumorigenesis. b. Representative IHC images of G6PD in G6pdWT;KL and G6pdKO;KL lung tumors at 12 weeks post-tumor induction. c. Representative gross lung pathology from mice bearing G6pdWT;KL and G6pdKO;KL lung tumors at 7 and 12 weeks post-tumor induction. d. Graph of wet lung weight from (c). e. Representative histology (H&E staining) of scanned lung sections from (c). f & g. Quantification of tumor number (f) and tumor burden (g) from (e). h. Representative IHC images and quantification of Ki67 in G6pdWT;KL and G6pdKO;KL lung tumors at 12 weeks post-tumor induction. i. Representative IHC images and quantification of pErk, and pS6 in G6pdWT;KL and G6pdKO;KL lung tumors at 12 weeks post-tumor induction. j. Kaplan-Meier survival curve of mice bearing G6pdWT;KL or G6pdKO;KL lung tumors. P<0.01, log-rank test. Data are mean± SEM. * P<0.05; ** P<0.01; *** P<0.005; **** P<0.001.
Figure 4.
Figure 4.. G6PD-mediated NADPH production is essential to maintain cellular redox homeostasis in KL tumorigenesis.
a. Pool size of NADPH and NADP+, and NADPH/NADP+ ratio in G6pdWT;KL and G6pdKO;KL lung tumors at 12 weeks post-tumor induction. b. Pool size of GSH and GSSG, and GSH/GSSG ratio in G6pdWT;KL and G6pdKO;KL lung tumors at 12 weeks post-tumor induction. c. Gene Set Enrichment Analysis (GSEA) of oxidative stress signaling for G6pdWT;KL and G6pdKO;KL lung tumors based on bulk-tumor mRNA-seq data. d. Representative IHC images and quantification of 8-oxo-dG and γ-H2AX in G6pdWT;KL and G6pdKO;KL lung tumors at 12 weeks post-tumor induction. e. Scheme of generating tumor-derived cell lines (TDCLs) from G6pdWT;KL and G6pdKO;KL lung tumors. f. Pool size of NADPH and NADP+, and NADPH/NADP+ ratio of G6pdWT;KL and G6pdKO;KL TDCLs in nutrient rich conditions (complete RPMI medium). g. Pool size of GSH and GSSG, and GSH/GSSG ratio of G6pdWT;KL and G6pdKO;KL TDCLs in nutrient rich conditions. h. Basal ROS level of G6pdWT;KL and G6pdKO;KL TDCLs in nutrient rich conditions. i. Proliferation rate of G6pdWT;KL and G6pdKO;KL TDCLs in nutrient rich conditions for 4 days. j. Relative proliferation rate of G6pdWT;KL and G6pdKO;KL TDCLs treated with different concentration of H2O2 for 24 hours. k. ROS levels of G6pdWT;KL and G6pdKO;KL TDCLs treated with 20 μmol/L H2O2 for 24 hours. l. Allograft tumor growth curve of G6pdWT;KL and G6pdKO;KL TDCLs treated with or without high-dose Vitamin C (Vit C, 4g/kg, i.p, daily) for 2 weeks. m. Gross pathology of G6pdWT;KL and G6pdKO;KL allograft tumors at the end of the experiment from (l). n. G6pdWT;KL and G6pdKO;KL allograft tumor weight at the end of the experiment from (l). Data are mean± SEM. * P<0.05; ** P<0.01; *** P<0.005; **** P<0.001.
Figure 5.
Figure 5.. G6PD suppresses p53 activation for KL lung tumorigenesis.
a. GSEA of positive regulation of intrinsic apoptotic signaling pathway by p53 class mediator for G6pdWT;KL and G6pdKO;KL lung tumors based on bulk-tumor mRNA-seq data. b. Representative IHC images and quantification of p53, p21 and cleaved caspase-3 of G6pdWT;KL and G6pdKO;KL lung tumors at 12 weeks post-tumor induction. c. Scheme to induce conditional tumoral G6pd knockout to study the role of G6PD in KPL lung tumorigenesis. d. Representative IHC images of G6PD in G6pdWT;KPL and G6pdKO;KPL lung tumors at 6 weeks post-tumor induction. e. Representative gross lung pathology from mice bearing G6pdWT;KPL and G6pdKO;KPL lung tumors at 6 weeks post-tumor induction. f. Graph of wet lung weight from mice bearing G6pdWT;KPL and G6pdKO;KPL lung tumors at 6 weeks post-tumor induction. g. Representative histology (H&E staining) of scanned lung sections from mice bearing G6pdWT;KPL and G6pdKO;KPL lung tumors at 6 weeks post-tumor induction. h & i. Quantification of tumor number (h) and tumor burden (i) from (g). j. Representative IHC images and quantification of Ki67 in G6pdWT;KPL and G6pdKO;KPL lung tumors. k. Kaplan-Meier survival curve of mice bearing G6pdWT;KPL and G6pdKO;KPL lung tumors. P>0.05, log-rank test. Data are mean± SEM. * P<0.05; *** P<0.005.
Figure 6.
Figure 6.. G6PD depletion impairs KL lung tumor lipid metabolism.
a & b. GSEA of lipid biosynthetic process (a) and fatty acids biosynthetic process (b) for G6pdWT;KL and G6pdKO;KL lung tumors based on bulk-tumor mRNA-seq data. c & d. Principal Component Analysis (PCA) (c) and Heatmap (d) of saponified fatty acids pool size of G6pdWT;KL and G6pdKO;KL lung tumors and serum from KL lung tumor bearing mice at fasted state (food was removed from the mice at approximately 9:00 a.m., and mice were euthanized and tumor samples were collected at 3:00 p.m.) at 12 weeks post-tumor induction. e. Scheme of in vivo D2O infusion to examine KL lung tumor de novo fatty acid synthesis. f & g. C16:0 (f) and C18:2 (g) deuterium (2H) labeling fraction in G6pdWT;KL and G6pdKO;KL lung tumors after 12 hour D2O infusion at 12 weeks post-tumor induction. h. C16:0 pool size of G6pdWT;KL and G6pdKO;KL lung tumors at 12 weeks post-tumor induction. i. Scheme to examine the impact of high-fat diet (HFD) on G6pdWT;KL and G6pdKO;KL lung tumorigenesis. j. Representative gross lung pathology from mice bearing G6pdWT;KL and G6pdKO;KL lung tumors fed with normal diet (ND) or HFD at 7, 11 weeks post-tumor induction. k. Graph of wet lung weight from mice bearing G6pdWT;KL and G6pdKO;KL lung tumors fed with ND or HFD at 7, 11 weeks post-tumor induction. l. Representative histology (H&E staining) of scanned lung sections from mice bearing G6pdWT;KL and G6pdKO;KL lung tumors fed with ND or HFD at 7, 11 weeks post-tumor induction. m & n. Quantification of tumor number (m) and tumor burden (n) from (l). o. Representative IHC images and quantification of Ki67 in G6pdWT;KL or G6pdKO;KL lung tumors at 11 weeks post-tumor induction. Data are mean± SEM. * P<0.05; ** P<0.01; **** P<0.0001.
Figure 7.
Figure 7.. G6PD ablation has no impact on KL TCA cycle metabolism, but reprograms serine metabolism.
a. Scheme of carbon contribution from glucose to glycolytic intermediates, TCA cycle intermediates, and serine (top) and in vivo [U-13C6]-glucose tracing in the mice bearing G6pdWT;KL and G6pdKO;KL lung tumors (bottom). b. Normalized 13C labeling fraction of glycolytic intermediates from glucose of G6pdWT;KL and G6pdKO;KL lung tumors in fasted state at 12 weeks post-tumor induction. c. Normalized 13C labeling fraction of TCA cycle intermediates from glucose of G6pdWT;KL and G6pdKO;KL lung tumors in fasted state at 12 weeks post-tumor induction. d. Pool size of glycolytic intermediates of G6pdWT;KL and G6pdKO;KL lung tumors in fasted state at 12 weeks post-tumor induction. e. Pool size of TCA cycle metabolites of G6pdWT;KL and G6pdKO;KL lung tumors in fasted state at 12 weeks post-tumor induction. f. Normalized 13C labeling fraction from glucose to serine and glycine of G6pdWT;KL and G6pdKO;KL lung tumors in fasted state at 12 weeks post-tumor induction. g. Pool size of serine and glycine of G6pdWT;KL and G6pdKO;KL lung tumors in fasted state at 12 weeks post-tumor induction. h. Serine consumption of G6pdWT;KL and G6pdKO;KL TDCLs in nutrient rich conditions. i. 2H labeling fraction of serine in G6pdWT;KL and G6pdKO;KL TDCLs after 4 hours [2,3,3-2H]-serine labeling in nutrient rich conditions. j. Scheme of hydrogen contribution from [2,3,3-2H]-serine to NADPH . k. Scheme of in vivo [2,3,3-2H]-serine tracing in the mice bearing G6pdWT;KL and G6pdKO;KL lung tumors. l. 2H labeling fraction of serine in G6pdWT;KL and G6pdKO;KL lung tumors at 12 weeks post-tumor induction. m. NADPH active-H labeling from [2,3,3]-serine in G6pdWT;KL and G6pdKO;KL lung tumors at 12 weeks post-tumor induction. n. Relative proliferation rate of G6pdWT;KL and G6pdKO;KL TDCLs cultured with RPMI media with or without serine and glycine for 48 hours. o. ROS levels of G6pdWT;KL and G6pdKO;KL TDCLs cultured with RPMI media with or without serine and glycine for 48 hours. Data are mean± SEM. * P<0.05; ** P<0.01; *** P<0.005; **** P<0.001.

References

    1. Harrison I. P. & Selemidis S. Understanding the biology of reactive oxygen species and their link to cancer: NADPH oxidases as novel pharmacological targets. Clin Exp Pharmacol Physiol 41, 533–542, doi:10.1111/1440-1681.12238 (2014). - DOI - PubMed
    1. Ju H. Q., Lin J. F., Tian T., Xie D. & Xu R. H. NADPH homeostasis in cancer: functions, mechanisms and therapeutic implications. Signal Transduct Target Ther 5, 231, doi:10.1038/s41392-020-00326-0 (2020). - DOI - PMC - PubMed
    1. Maddocks O. D., Labuschagne C. F. & Vousden K. H. Localization of NADPH production: a wheel within a wheel. Molecular cell 55, 158–160, doi:10.1016/j.molcel.2014.07.001 (2014). - DOI - PubMed
    1. Goodman R. P., Calvo S. E. & Mootha V. K. Spatiotemporal compartmentalization of hepatic NADH and NADPH metabolism. J Biol Chem 293, 7508–7516, doi:10.1074/jbc.TM117.000258 (2018). - DOI - PMC - PubMed
    1. Lewis C. A. et al. Tracing compartmentalized NADPH metabolism in the cytosol and mitochondria of mammalian cells. Molecular cell 55, 253–263, doi:10.1016/j.molcel.2014.05.008 (2014). - DOI - PMC - PubMed

Publication types