[Preprint]. 2024 Sep 19:2023.10.06.561214.
doi: 10.1101/2023.10.06.561214.

A neural mechanism for learning from delayed postingestive feedback

Affiliations

A neural mechanism for learning from delayed postingestive feedback

Christopher A Zimmerman et al. bioRxiv. .

Update in

  • A neural mechanism for learning from delayed postingestive feedback.
    Zimmerman CA, Bolkan SS, Pan-Vazquez A, Wu B, Keppler EF, Meares-Garcia JB, Guthman EM, Fetcho RN, McMannon B, Lee J, Hoag AT, Lynch LA, Janarthanan SR, López Luna JF, Bondy AG, Falkner AL, Wang SS, Witten IB. Zimmerman CA, et al. Nature. 2025 Jun;642(8068):700-709. doi: 10.1038/s41586-025-08828-z. Epub 2025 Apr 2. Nature. 2025. PMID: 40175547 Free PMC article.

Abstract

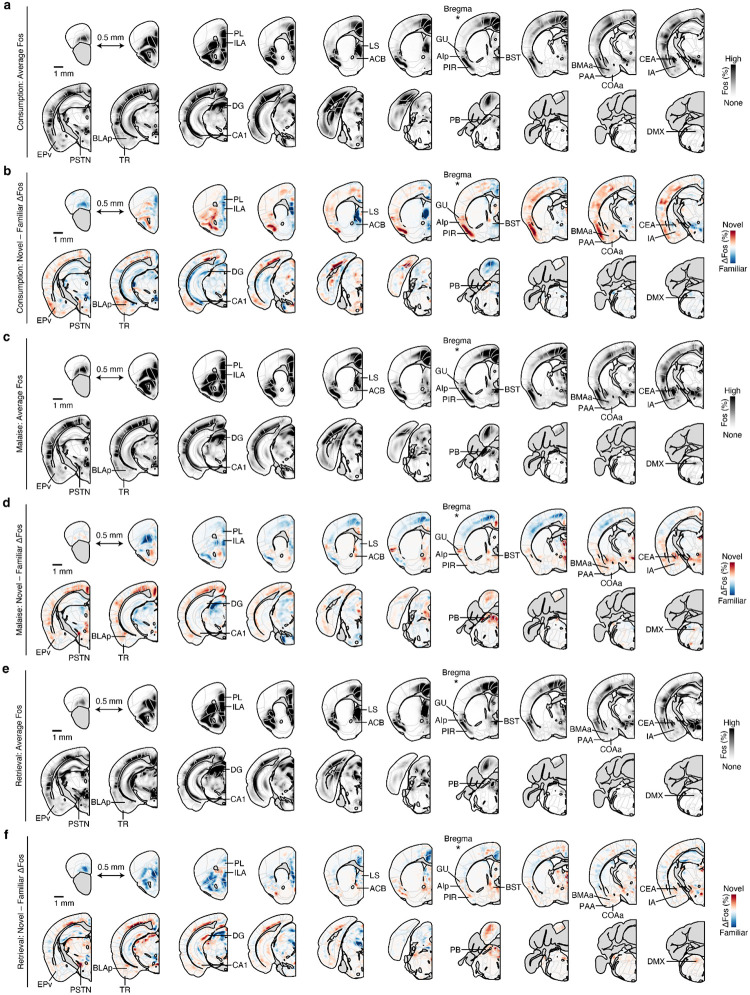
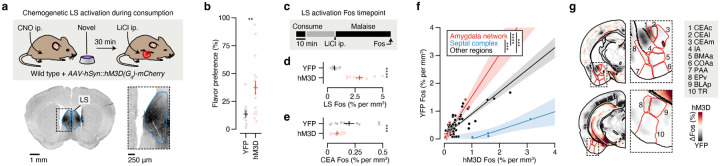
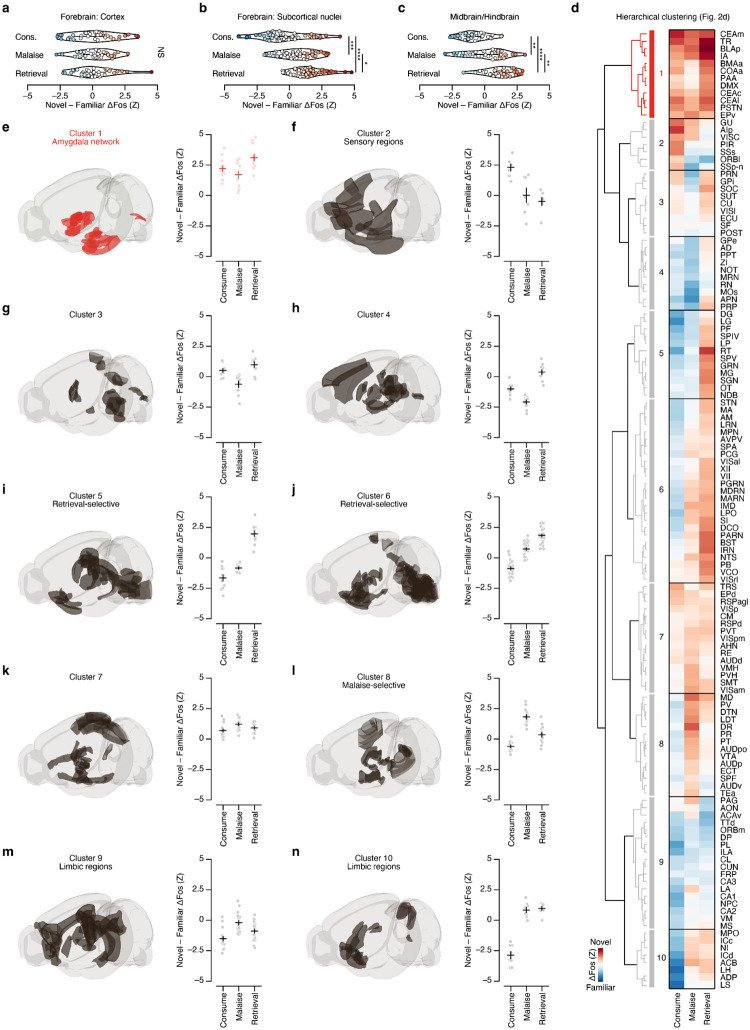
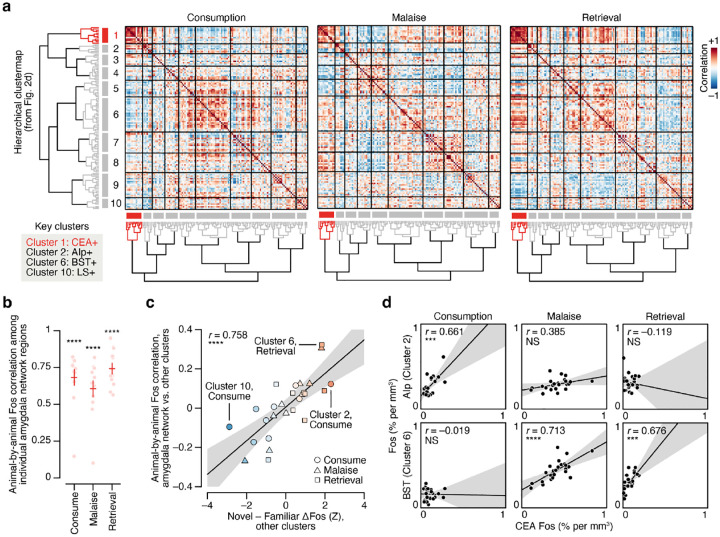
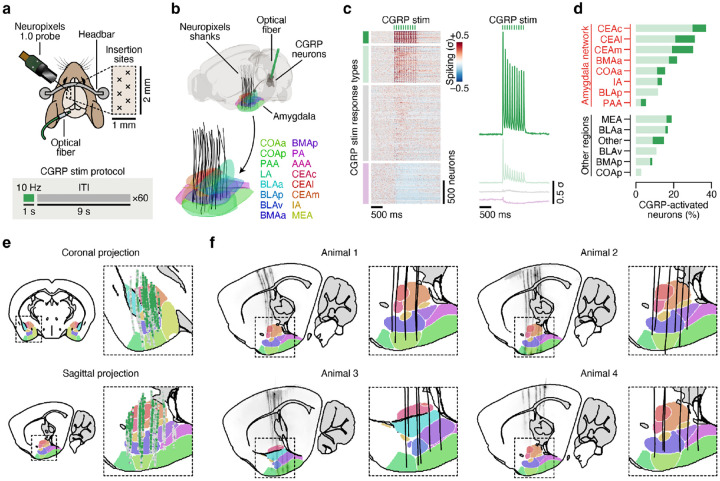
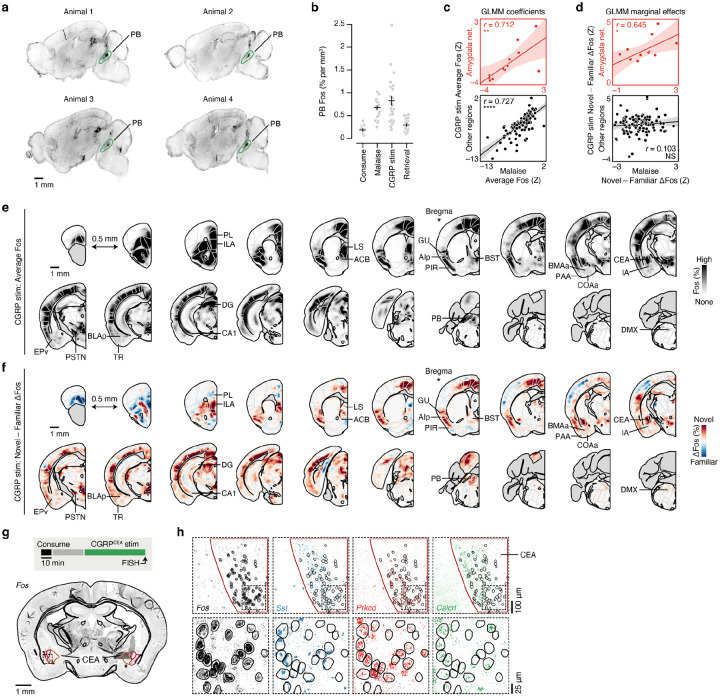
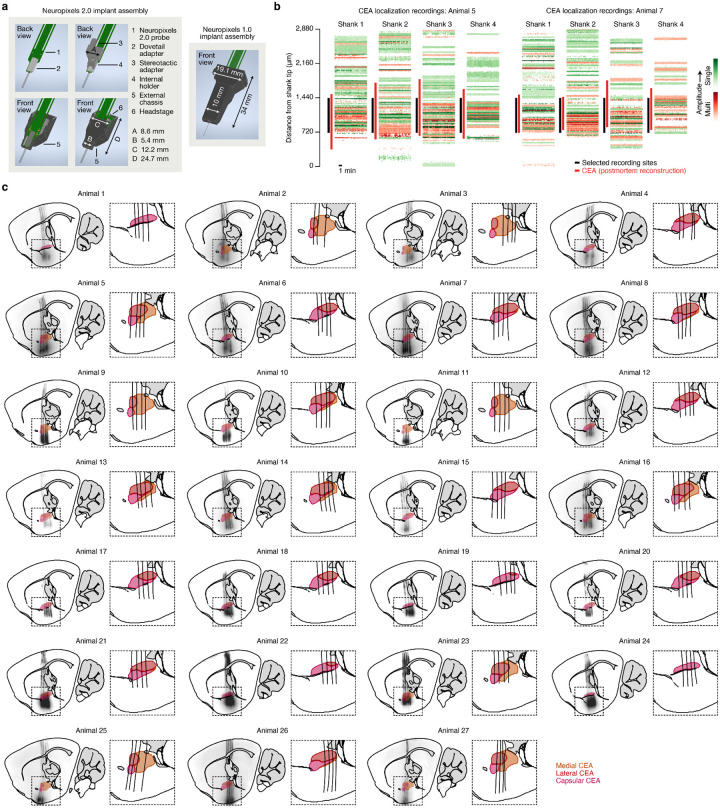
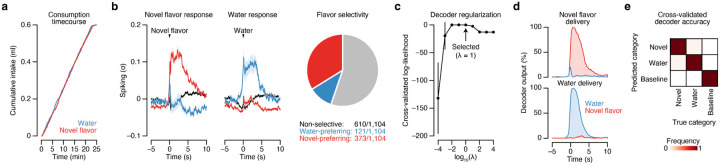
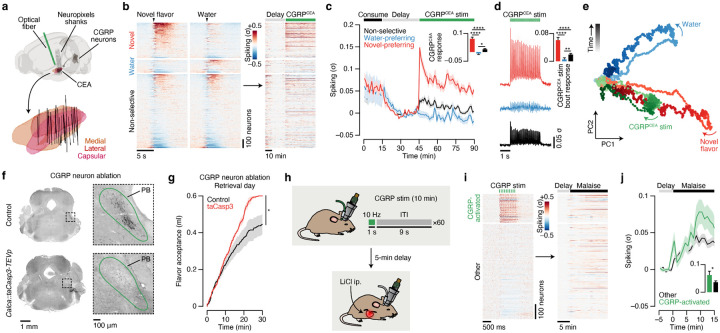
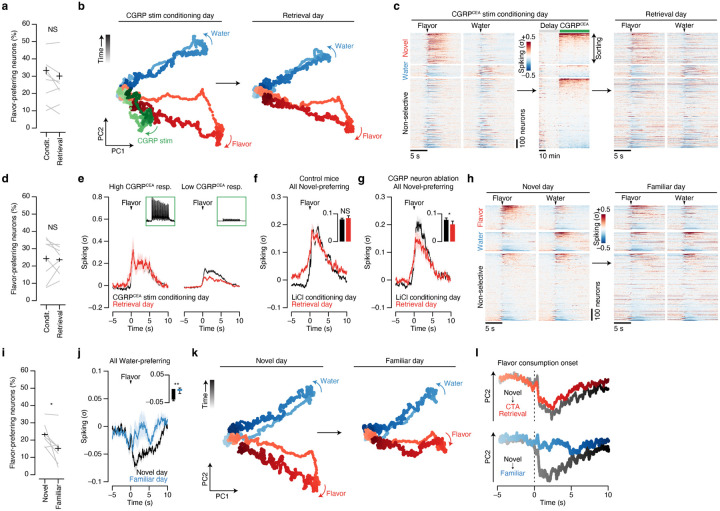
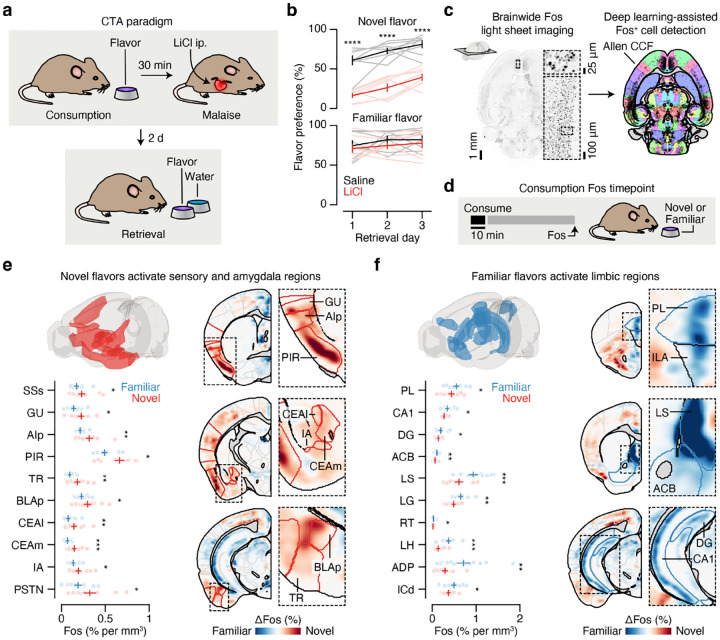
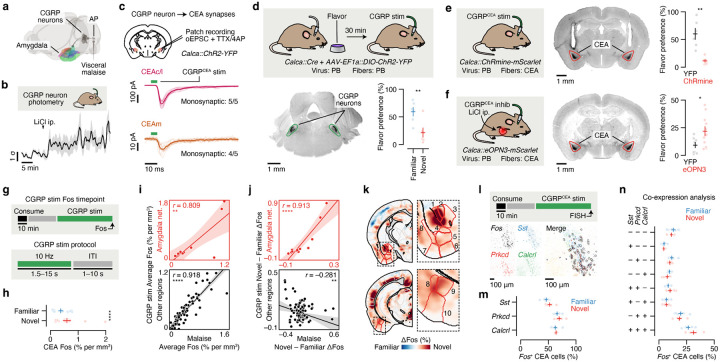
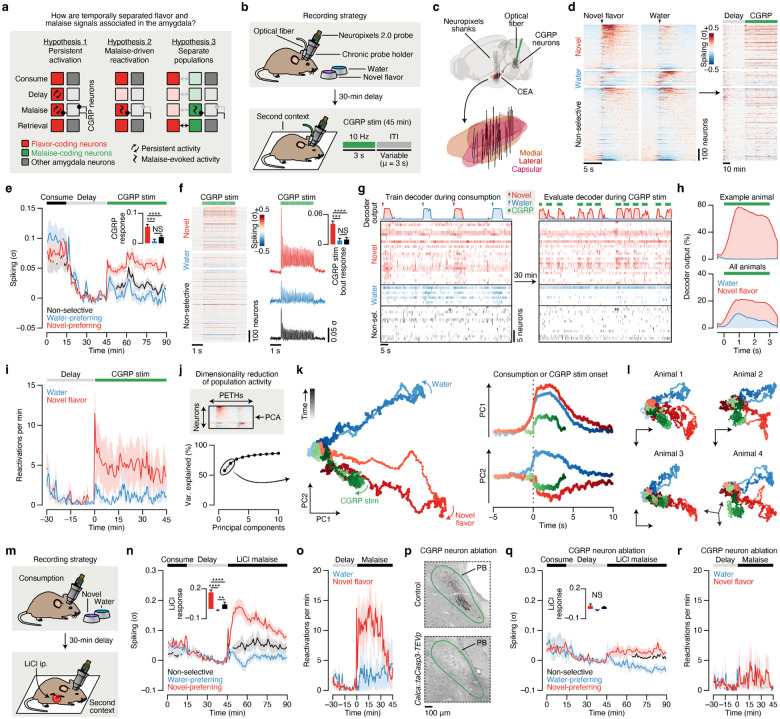
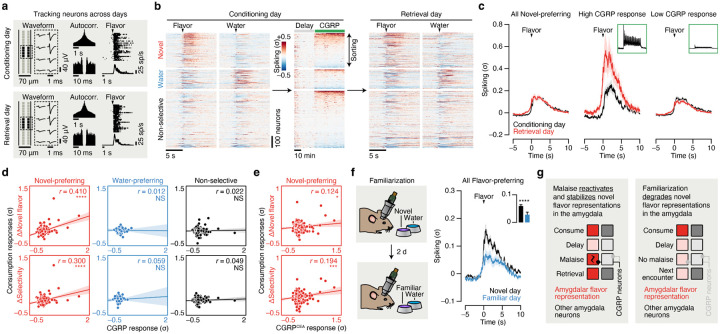
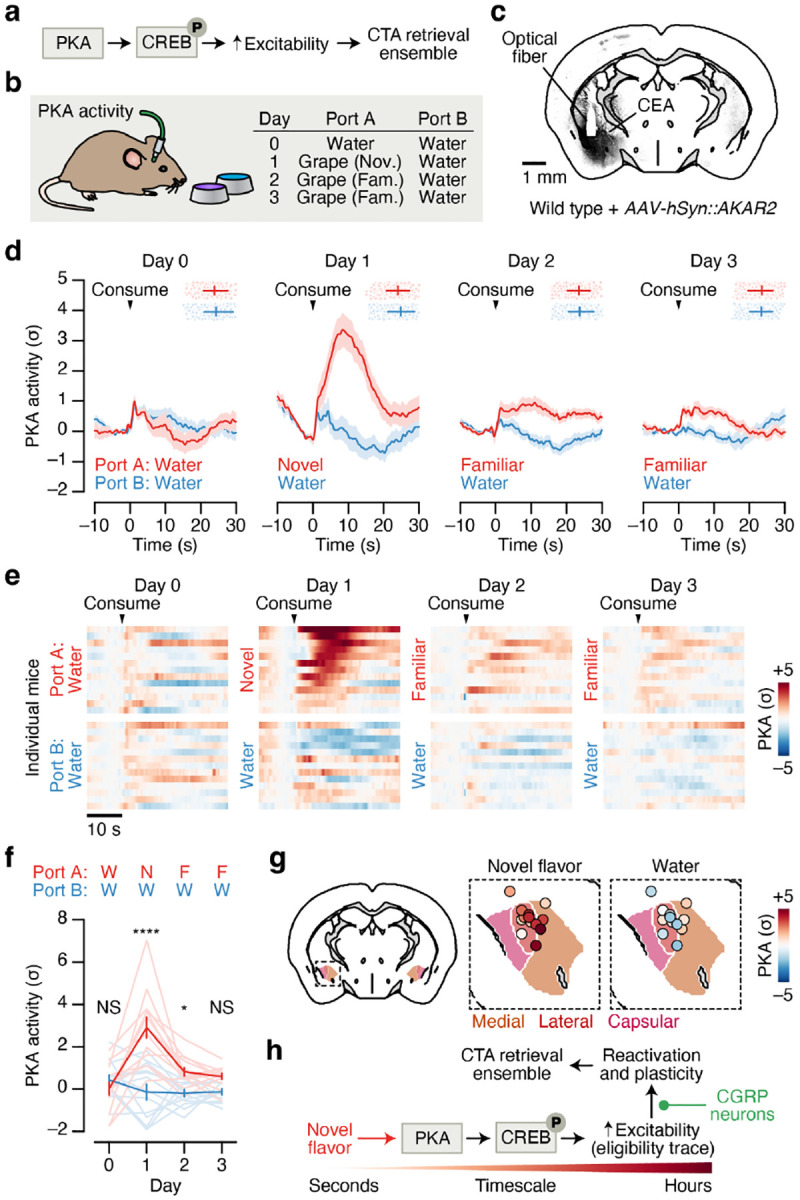
Animals learn the value of foods based on their postingestive effects and thereby develop aversions to foods that are toxic1-6 and preferences to those that are nutritious7-14. However, it remains unclear how the brain is able to assign credit to flavors experienced during a meal with postingestive feedback signals that can arise after a substantial delay. Here, we reveal an unexpected role for postingestive reactivation of neural flavor representations in this temporal credit assignment process. To begin, we leverage the fact that mice learn to associate novel15-18, but not familiar, flavors with delayed gastric malaise signals to investigate how the brain represents flavors that support aversive postingestive learning. Surveying cellular resolution brainwide activation patterns reveals that a network of amygdala regions is unique in being preferentially activated by novel flavors across every stage of the learning process: the initial meal, delayed malaise, and memory retrieval. By combining high-density recordings in the amygdala with optogenetic stimulation of genetically defined hindbrain malaise cells, we find that postingestive malaise signals potently and specifically reactivate amygdalar novel flavor representations from a recent meal. The degree of malaise-driven reactivation of individual neurons predicts strengthening of flavor responses upon memory retrieval, leading to stabilization of the population-level representation of the recently consumed flavor. In contrast, meals without postingestive consequences degrade neural flavor representations as flavors become familiar and safe. Thus, our findings demonstrate that interoceptive reactivation of amygdalar flavor representations provides a neural mechanism to resolve the temporal credit assignment problem inherent to postingestive learning.


Figures

Extended Data Fig. 1 |
Extended Data Fig. 1 |. Brainwide novel versus familiar flavor activation patterns at each stage of postingestive learning.
a, Map of average Fos+ cell density across all mice for the Consumption timepoint (n = 24 mice). The Allen CCF is overlaid. Coronal sections are spaced by 0.5 mm, the section corresponding to Bregma is marked with a *, and key brain regions are labeled. b, Map of the difference in average Fos+ cell density across Novel versus Familiar flavor condition mice for the Consumption timepoint (n = 12 mice per flavor condition). c, Map of average Fos+ cell density across all mice for the Malaise timepoint (n = 24 mice). d, Map of the difference in average Fos+ cell density across Novel versus Familiar flavor condition mice for the Malaise timepoint (n = 12 mice per flavor condition). e, Map of average Fos+ cell density across all mice for the Retrieval timepoint (n = 24 mice). f, Map of the difference in average Fos+ cell density across Novel versus Familiar flavor condition mice for the Retrieval timepoint (n = 12 mice per flavor condition). An interactive visualization of these Fos+ cell density maps is available at https://www.brainsharer.org/ng/?id=872. See Extended Data Table 1 for list of brain region abbreviations.
Extended Data Fig. 2 |
Extended Data Fig. 2 |. Activation of the LS during novel flavor consumption blocks malaise-driven amygdala activation and interferes with CTA acquisition.
a, Schematic and example hM3D-mCherry expression data for the bilateral chemogenetic LS activation experiment. CNO was delivered 45-min before the experiment began to ensure that the LS was activated throughout consumption. b, Retrieval test flavor preference for the experiment described in a (n = 18 hM3D mice, 12 YFP mice). c, Schematic of the LS activation Fos timepoint (n = 12 mice per group). As in a, CNO was delivered 45-min before the experiment began, and the flavor was novel for both groups. d, Comparison of LS Fos for individual YFP (black) and hM3D (red) mice, confirming strong activation by hM3D. e, Comparison of CEA Fos for individual YFP (black) and hM3D (red) mice, showing reduced malaise-driven activation in hM3D mice. f, Correlation between the average Fos+ cell count of each brain region for hM3D versus YFP mice. The amygdala network (from Fig. 2d,e; red; n = 12 regions), septal complex (blue; n = 4 regions), and all other regions (black; n = 114 regions) are shown separately. g, Visualization of the spatially resolved difference in Fos+ cell density across YFP versus hM3D mice with Allen CCF boundaries overlaid. P-value in b is from a Wilcoxon rank-sum test. P-values in d,e are from GLMM coefficient estimate z-tests. P-values in f are from a one-way analysis of covariance model corrected for multiple comparisons across brain region groups. Error bars represent mean ± s.e.m. Shaded areas in f represent 95% confidence interval for linear fit. **P ≤ 0.01, ***P ≤ 0.001, ****P ≤ 0.0001.
Extended Data Fig. 3 |
Extended Data Fig. 3 |. Hierarchical clustering of brain regions based on novel versus familiar flavor activation patterns.
Panels ac show that the brainwide shift towards activation by the novel flavor is primarily localized to subcortical regions. a, Novel – Familiar ΔFos effect distribution of all cortical regions (Cerebral Cortex in the Allen CCF) at each timepoint (n = 38 brain regions). b, Novel – Familiar ΔFos effect distribution of all subcortical forebrain (Cerebral Nuclei, Thalamus, and Hypothalamus in the Allen CCF) regions at each timepoint (n = 54 brain regions). c, Novel – Familiar ΔFos effect distribution of all midbrain and hindbrain regions (Midbrain, Pons, and Medulla in the Allen CCF) at each timepoint (n = 38 brain regions). d, Hierarchical clustering of Novel – Familiar ΔFos effects. This is an expanded version Fig. 2d showing all brain region names. en, Left: Illustration of the brain regions comprising each cluster from the hierarchical clustering analysis. Right: Summary of the Novel – Familiar ΔFos effect for each cluster at each timepoint, showing each brain region as an individual point. P-values in b,c are from Kolmogorov-Smirnov tests corrected for multiple comparisons across timepoints. No statistical tests were performed for ef. Error bars represent mean ± s.e.m. Outlines in ac represent kernel-density estimates of the empirical distributions. *P ≤ 0.05, **P ≤ 0.01, ***P ≤ 0.001, ****P ≤ 0.0001, NS, not significant (P > 0.05). See Extended Data Table 1 for list of brain region abbreviations.
Extended Data Fig. 4 |
Extended Data Fig. 4 |. The amygdala cluster forms a functional network.
a, Correlation matrices showing the animal-by-animal pairwise Fos correlation for every pair of brain regions during consumption (left), delayed malaise (middle), or memory retrieval (right). Brain regions are sorted using the hierarchical clustermap obtained from the Novel – Familiar ΔFos effects in Fig. 2d. b, Summary of the average within-cluster Fos correlation for individual amygdala network regions (Cluster 1 from Fig. 2d,e) by timepoint (n = 12 regions). The high animal-by-animal correlation among all of the regions in cluster 1 suggest that these regions form a functional network. Panels c,d show that activation of other clusters of brain regions is more correlated with amygdala network activation at experimental timepoints when those clusters are more strongly novel flavor-selective, including for clusters that were specifically engaged during the initial flavor consumption (comprising sensory cortices; cluster 2) or during retrieval (including the BST; cluster 6). This suggests that the amygdala network may play a role in orchestrating the brainwide response to novel flavors at different stages of learning. c, Summary of the average across-cluster Fos correlation between the amygdala network and every other cluster at each timepoint as a function of the other cluster’s standardized Novel – Familiar effect at that timepoint (n = 9 clusters × 3 timepoints). d, Scatter plots showing the pairwise correlation between AIp (top; example Cluster 2 region) or BST (bottom; example Cluster 6 region) and the CEA (n = 24 mice per timepoint). P-values in b are from Wilcoxon signed-rank tests corrected for multiple comparisons across timepoints. P-values in c,d are from Pearson correlation t-tests. Error bars represent mean ± s.e.m. Shaded areas in c,d represent 95% confidence interval for linear fit. ***P ≤ 0.001, ****P ≤ 0.0001, NS, not significant (P > 0.05). See Extended Data Table 1 for list of brain region abbreviations.
Extended Data Fig. 5 |
Extended Data Fig. 5 |. An electrophysiological atlas of the effects of CGRP neuron stimulation on amygdala activity in vivo.
a, Schematic of the acute Neuropixels recording experiment. b, Reconstruction of recording trajectories registered to the Allen CCF. Each line represents one insertion of a single-shank Neuropixels 1.0 probe targeting the amygdala (n = 24 insertions from 4 mice). c, Left: PETHs of neural activity time-locked to CGRP neuron stimulation trains (n = 3,524 amygdala neurons from 24 insertions). Neurons were divided into four response types using a GMM model (see Methods): two CGRP neuron stimulation-activated response types (7.3% strongly activated, dark green; 22.4% weakly activated, light green), one CGRP neuron stimulation-inhibited response type (24.6%, purple), and one unmodulated response type (45.8%, gray). Right: Average PETHs for each GMM response type. d, Percentage of recorded neurons that were CGRP neuron stimulation-activated based on the GMM across amygdala subregions (n = 339 CEAc, 272 CEAl, 717 CEAm, 526 BMAa, 129 COAa, 133 IA, 41 BLAp, 30 PAA, 182 MEA, 354 BLAa, 54 Other (AAA, LA, PA), 44 BLAv, 250 BMAp, and 58 COAp neurons). Regions in the CTA amygdala network (Cluster 1 from Fig. 2d,e) are shown in red, and other amygdala regions are shown in black. e, Anatomical distribution of all CGRP-activated (green), CGRP-inhibited (purple), and unmodulated (gray) neurons projected onto a single coronal or sagittal section of the Allen CCF. f, Left: Light sheet imaging data for each animal of Neuropixels probe trajectories aligned to the Allen CCF with amygdala subregions overlaid. Right: Reconstruction of recording trajectories in the amygdala for each animal. For each animal, a single sagittal section corresponding to the center-of-mass of all active recording sites is shown. The colormap for amygdala regions in b is also used in e and f. See Extended Data Table 1 for list of brain region abbreviations.
Extended Data Fig. 6 |
Extended Data Fig. 6 |. Brainwide novel versus familiar flavor activation pattern during CGRP neuron stimulation.
a, Example brainwide Fos imaging data (200-μm maximum intensity projections) for four example CGRP stim timepoint animals. Strong Fos expression in the PB driven by optogenetic stimulation of CGRP neurons is highlighted in green. b, Summary of Fos+ cell counts in the PB at each experimental timpoint, confirming high levels of neural activation during both LiCl-induced malaise and CGRP neuron stimulation (n = 24 mice for Consumption, 24 mice for Malaise, 27 mice for CGRP stim, and 24 mice for Retrieval). c, Analysis analogous to Fig. 3i but using the Fos GLMM from Equation 3. Here, the correlation among the standardized coefficients (Z = estimate/standard error) for the main LiCl effect and main CGRP stim effect on Fos+ cell counts from the regression Fos counts ~ Timepoint + Sex + (1|Batch) + ln(PB Counts) are plotted (n = 12 amygdala network regions, 117 other regions). d, Analysis analogous to Fig. 3j but using the Fos GLMM from Equation 4. Here, the correlation among the average marginal effect (Novel – Familiar ΔFos, in standardized units) of flavor on Fos+ cell counts from the regression Fos counts ~ Novel*Timepoint + Sex + (1|Batch) + ln(PB Counts) are plotted (n = 12 amygdala network regions, 117 other regions). e, Map of average Fos+ cell density across all mice for the CGRP stim timepoint (n = 27 mice). The Allen CCF is overlaid. Coronal sections are spaced by 0.5 mm, the section corresponding to Bregma is marked with a *, and key brain regions are labeled. f, Map of the difference in average Fos+ cell density across Novel versus Familiar flavor condition mice for the CGRP stim timepoint (n = 14 novel flavor mice, 13 familiar flavor mice). g, Top: Schematic of the CGRPCEA projection stimulation RNAscope FISH experiment. Bottom: Example slide scanner image of Fos expression from one coronal section with the Allen CCF overlaid. h, Example confocal image showing Fos expression (as a marker of neural activation) and Sst, Prkcd, and Calcrl expression (as markers of known CEA cell types) in the CEA following CGRPCEA projection stimulation. This is an expanded version of Fig. 3l. The top row shows the full field-of-view for each gene, and the bottom row is magnified with Fos+ cell outlines overlaid in black. P-values in c,d are from Pearson correlation t-tests. No statistical tests were performed for b. Error bars represent mean ± s.e.m. Shaded areas in c,d represent 95% confidence interval for linear fit. *P ≤ 0.05, **P ≤ 0.01, ****P ≤ 0.0001, NS, not significant (P > 0.05). See Extended Data Table 1 for list of brain region abbreviations and for GLMM statistics.
Extended Data Fig. 7 |
Extended Data Fig. 7 |. Chronic Neuropixels electrophysiology in the amygdala of freely moving mice.
a, Left: A schematic illustration of the chronic Neuropixels 2.0 implant assembly at progressive stages of construction from top left to bottom right. Right: A schematic illustration of the chronic Neuropixels 1.0 implant assembly upon which the 2.0 implant design is based, shown for size comparison. b, Test recordings used to select recording sites (black bars) properly targeting the CEA (red bars, based on postmortem reconstruction) for two example animals. The shanks are arranged from anterior (1, left) to posterior (4, right) and span 750-μm total. We found that we could distinguish the CEA from nearby brain regions along the vertical axis of the probe shanks as a band of dense neural activity. c, Left: Light sheet imaging data for each animal of Neuropixels shank trajectories aligned to the Allen CCF with CEA subregions overlaid. Right: Reconstruction of trajectories in the CEA. For each animal, a single sagittal section corresponding to the center-of-mass of all active recording sites is shown. See Methods for a description of which animals were included in each experiment.
Extended Data Fig. 8 |
Extended Data Fig. 8 |. The amygdala is strongly activated by a novel flavor and near-perfectly discriminates flavor.
a, Cumulative intake of the novel flavor (red) and water (blue) in the two-reward CTA paradigm in Fig. 4b (n = 8 mice). We used a randomized, trial-based structure to ensure that mice consumed the two options at an equal rate (see Methods). b, Left: PETHs to novel flavor delivery for the novel flavor-preferring (n = 373 neurons from 8 mice), water-preferring (n = 121 neurons), and non-selective (n = 610 neurons) CEA neurons in Fig. 4c–l. Middle: PETHs to water delivery for the novel flavor-preferring, water-preferring, and non-selective CEA neurons. Right: Pie chart visualizing the proportion of novel flavor-preferring, water-preferring, and non-selective CEA neurons. Panels c–e provide additional characterization of the multinomial logistic regression decoder using CEA population activity. c, Cross-validated log-likelihood for the decoder classifying periods of novel flavor consumption versus water consumption versus baseline activity across a range of regularization parameter (λ) values (n = 6 mice). d, Decoder output time-locked to novel flavor delivery (top) and water delivery (bottom) in the initial consumption period (mean across 6 mice). The decoder’s predicted probability for novel flavor consumption (red) and water consumption (blue) are both shown. e, Confusion matrix summarizing the cross-validated decoder performance across all mice (n = 6 mice). The overall misclassification rate was 0.56% (4 out of 720). Error bars and shaded areas represent mean ± s.e.m.
Extended Data Fig. 9 |
Extended Data Fig. 9 |. CGRPCEA projection stimulation reactivates novel flavor representations in the amygdala, and CGRP neuron ablation impairs delayed CTA learning.
Panels ae show that postingestive CGRPCEA projection stimulation reactivates novel flavor representations in the amygdala. a, Reconstruction of recording trajectories registered to the Allen CCF for mice with CGRPCEA projection stimulation (n = 32 shanks from 8 mice). b, Heatmap showing the trial-average spiking of all recorded CEA neurons (n = 1,221 neurons from 8 mice) to novel flavor and water consumption during the consumption period (left) and during the delay and CGRPCEA projection stimulation periods (right). Neurons are grouped by their novel flavor/water preference and then sorted by consumption response magnitude. Consumption PETHs are time-locked to delivery of the flavor or water. c, Average spiking of the novel flavor-preferring (red; n = 354 neurons), water-preferring (blue; n = 129 neurons), and non-selective (black; n = 738 neurons) populations across the entire experiment. The inset quantifies the average response of each population during the entire 45-min CGRPCEA projection stimulation period. d, Average spiking of the novel flavor-preferring (red), water-preferring (blue), and non-selective (black) populations during individual 3-s bouts of 10-Hz CGRPCEA projection stimulation. The inset quantifies the average response of each population within bouts of CGRPCEA projection stimulation. e, Neural trajectories for novel flavor consumption (red), water consumption (blue), and CGRPCEA projection stimulation in PC-space from a population activity dimensionality reduction analysis analogous to Fig. 4k. Panels f,g show that genetic ablation of CGRP neurons by taCasp3-TEVp impairs delayed CTA learning. f, Example CGRP immunoreactivity data confirming genetic ablation of CGRP neurons by taCasp3-TEVp. This is an expanded version of Fig. 4p. g, CGRP neuron ablation mice (taCasp3) show significantly higher acceptance of the conditioned flavor following LiCl-induced CTA when compared to wild type controls (n = 6 taCasp3 mice, 7 control mice). This data was collected during the retrieval session in the two-reward CTA paradigm, where 0.6-ml is the maximum possible flavor acceptance. Panels hj show that CGRP-activated CEA neurons are also activated by LiCl injection. h, Schematic of the paradigm for tracking neurons across CGRP neuron stimulation and LiCl-induced malaise. i, Heatmap showing the trial-average spiking of all recorded CEA neurons (n = 833 neurons from 4 mice) to CGRP neuron stimulation (left) and then during LiCl-induced malaise (right). Neurons were classified as CGRP neuron stimulation-activated using the GMM trained on the data in Extended Data Fig. 5c. j, Average spiking of the CGRP neuron stimulation-activated neurons (green; n = 189 neurons) and other neurons (black; n = 634 neurons) during LiCl-induced malaise. The inset quantifies the average response of each population. P-values in c,d,g,j are from Wilcoxon rank-sum tests corrected for multiple comparisons when appropriate (across neuron groups in c,d). Error bars and shaded areas represent mean ± s.e.m. *P ≤ 0.05, **P ≤ 0.01, ****P ≤ 0.0001, NS, not significant (P > 0.05).
Extended Data Fig. 10 |
Extended Data Fig. 10 |. Postingestive CGRP neuron activity is necessary and sufficient to stabilize novel flavor representations in the amygdala upon memory retrieval.
Panels a,b present further analysis of the CGRP neuron stimulation conditioning experiment in Fig. 5b–d. a, Summary of the proportion of flavor-preferring units classified separately on conditioning day or on retrieval day (n = 8 mice). b, Neural trajectories for flavor consumption (red), water consumption (blue), and CGRP neuron stimulation in the PC-space on conditioning day (left) and retrieval day (right). Trajectories for both days were calculated using the PCA loadings from conditioning day, and the novel flavor trajectory remained largely stable. Panels ce present further analysis of the CGRPCEA projection stimulation conditioning experiment in Fig. 5e. c, Heatmap showing the average spiking of all recorded neurons (n = 1,042 neurons from 8 mice) to novel flavor and water consumption during the consumption period (left) and during the delay and CGRPCEA projection stimulation periods (middle) on conditioning day, and the responses of the same neurons to flavor and water consumption on retrieval day. Neurons are grouped by their novel flavor/water preference on pairing day and then sorted by CGRPCEA response magnitude. d, Analogous to a, but for mice with CGRPCEA projection stimulation (n = 8 mice). e, Trial-average spiking of the novel-preferring neurons with the highest 10% of CGRPCEA response magnitudes (High CGRPCEA resp.; left) and of the remaining novel-preferring neurons (Low CGRPCEA resp.; right) on conditioning day and retrieval day. The insets show the average CGRPCEA projection stimulation response profile of each subpopulation. Panels f,g show that LiCl-induced malaise stabilizes CEA novel flavor representations during memory retrieval, and that this stabilization is impaired in mice with CGRP neuron ablation. f, For control mice, trial-average spiking of the novel flavor-preferring population (n = 279 neurons) of CEA neurons during flavor consumption on conditioning day (black) and retrieval day (red). The inset quantifies the average response on each day. g, Analogous to f, but for mice with CGRP neuron ablation (n = 109 neurons from 4 mice). Panels hk present further analysis of the familiarization experiment in Fig. 5f. h, Heatmap showing the average spiking of all recorded neurons (n = 924 neurons from 7 mice) to flavor and water consumption on novel day (left) and, two days later, on familiar day (right). Neurons are grouped by their novel flavor/water preference on novel day and then sorted by reward response magnitude. i, Summary of the proportion of flavor-preferring units classified separately on novel day or on familiar day for the familiarization experiment (n = 7 mice). j, Trial-average spiking of the initially water-preferring population (n = 160 neurons from 7 mice; classified on novel day) during flavor consumption on novel day (black) and familiar day (blue). The inset quantifies the average response on each day. k, Neural trajectories for flavor consumption (red) and water consumption (blue) in the PC-space on novel day (left) and familiar day (right). Trajectories for both days were calculated using the PCA loadings from the novel day, and the flavor trajectory was strongly degraded following familiarization. l, Comparison of the time-courses specifically along the PC2 axis during consumption for the conditioning with CGRP neuron stimulation (from the data in b) and familiarization (from the data in k) experiments. Top: The flavor consumption trajectory on conditioning day (“Novel”) is shown in grays and the stable trajectory on retrieval day (“CTA Retrieval”) is shown in reds. Bottom: The flavor consumption trajectory on novel day (“Novel”) is shown in grays and the degraded trajectory on familiar day (“Familiar”) is shown in blues. P-values in a,d,f,g,i,j are from Wilcoxon signed-rank tests. Error bars and shaded areas represent mean ± s.e.m. *P ≤ 0.05, **P ≤ 0.01, NS, not significant (P > 0.05).
Fig. 1 |
Fig. 1 |. Consumption of a novel flavor supports one-shot CTA learning and activates different brain regions than the same flavor when familiar.
a. Schematic of the CTA paradigm. b, Flavor preference across three consecutive daily retrieval tests for mice that consumed either a novel (top) or familiar (bottom) flavor and then were injected with either LiCl (red) or saline (black) on pairing day (n = 8 mice per group). The specific flavor (sweetened grape kool-aid) and amount consumed (1.2 ml) was the same for all groups. The familiar group was pre-exposed to the flavor on four consecutive days before conditioning, whereas the novel group was completely naïve. c, Schematic and example Fos expression data (100-μm maximum intensity projection) for the brainwide light sheet imaging pipeline. d, Schematic of the Consumption Fos timepoint (n = 12 mice per group). The line above “10 min” is a scale bar and the gray bar represents the 60-min wait before perfusion. e, Novel flavors preferentially activate sensory and amygdala regions. Left: Comparison of individual familiar (blue) and novel (red) flavor condition mice for every significantly novel flavor-activated brain region. Right: Visualization of the spatially resolved difference in Fos+ cell density across flavor conditions with Allen CCF boundaries overlaid. f, Familiar flavors preferentially activate limbic regions. Panels are analogous to e. P-values in b are from GLMM marginal effect z-tests corrected for multiple comparisons across retrieval days within each flavor condition. P-values in e,f are from GLMM marginal effect z-tests corrected for multiple comparisons across timepoints within each brain region. Error bars represent mean ± s.e.m. *P ≤ 0.05, **P ≤ 0.01, ***P ≤ 0.001, ****P ≤ 0.0001. See Extended Data Table 1 for list of brain region abbreviations.
Fig. 2 |
Fig. 2 |. An amygdala network responds to novel flavors across every stage of CTA learning.
a, Schematic of the Malaise and Retrieval Fos timepoints (n = 12 mice per flavor condition per timepoint). There were six total groups of mice in the main Fos dataset: two flavor conditions (Novel, Familiar) × three timepoints (Consumption (from Fig. 1), Malaise, Retrieval). b, Description of the GLMM for brainwide Fos data. Briefly, we modeled the number of Fos+ neurons in each brain region (Fos counts) as a fixed effect interaction of flavor condition (Novel) and experimental timepoint (Timepoint; in the formula, * represents all possible main effects and interactions) with additional contributions from sex (fixed effect: Sex), technical batch (random effect: (1|Batch)), and total brainwide Fos+ cell count (offset term: ln(Total Counts)) using a negative binomial link function. This model properly accounts for the statistical structure of brainwide Fos data as well as batch-to-batch variation in tissue clearing, immunolabeling, and imaging. We then used this model to calculate the average marginal effect (Novel – Familiar ΔFos, in standardized units) of flavor on Fos+ cell counts for each brain region (see Methods and Equation 2 for more details). c, Novel – Familiar ΔFos effect distribution at each timepoint across brain regions, for all regions that were significantly modulated by Novel, Timepoint, or their interaction (n = 130 brain regions). Each point represents a single brain region. d, Hierarchical clustering of Novel – Familiar ΔFos effects. See Extended Data Fig. 3d for an expanded version. e, Detail of the amygdala network (Cluster 1 from d) that is preferentially activated by novel flavors at every stage of learning. The heatmap columns in e are in the same order as the rows in d (left to right: Consumption, Malaise, Retrieval). f, Visualization of the spatially resolved difference in Fos+ cell density across flavor conditions with Allen CCF boundaries overlaid. g, Comparison of individual familiar (blue) and novel (red) flavor condition mice for the CEA at each timepoint. P-values in c are from Kolmogorov-Smirnov tests corrected for multiple comparisons across timepoints. P-values in g are from GLMM marginal effect z-tests corrected for multiple comparisons across timepoints. Error bars represent mean ± s.e.m. *P ≤ 0.05, **P ≤ 0.01, ****P ≤ 0.0001. See Extended Data Table 1 for list of brain region abbreviations and for GLMM statistics.
Fig. 3 |
Fig. 3 |. Parabrachial CGRP neurons mediate the effects of postingestive malaise on the amygdala network, and monosynaptic connections to the CEA support the acquisition of delayed CTA.
a, Schematic of the neural pathway that conveys visceral malaise signals from the gut to the amygdala via the area postrema (AP) and CGRP neurons in the parabrachial nucleus (PB)–,,,. b, Fiber photometry recordings showing that CGRP neurons are activated in vivo by LiCl-induced malaise (n = 5 mice). c, Top: Strategy for using ChR2-assisted circuit mapping to identify monosynaptic connections (optogenetically evoked excitatory postsynaptic currents (oEPSCs) in the presence of the voltage-gated sodium channel blocker tetrodotoxin (TTX) and the voltage-gated potassium channel blocker 4-aminopyridine (4AP)) between CGRP neurons and the CEA. Middle: Strong monosynaptic inputs from CGRP neurons to the CEAc/l (amplitude: −327.0 ± 136.3 pA; mean ± s.e.m.; n = 5/5 neurons from 3 mice). Bottom: Weaker monosynaptic inputs from CGRP neurons to the CEAm (amplitude: −15.6 ± 6.4 pA; mean ± s.e.m.; n = 4/5 neurons from 3 mice). The dark lines represent the average and the transparent lines represent individual trials for each example neuron. d, Top: Schematic for the CGRP neuron stimulation experiment. Cre-dependent ChR2-YFP virus was injected bilaterally into the PB of Calca::Cre mice and optical fibers were implanted bilaterally above the PB. Bottom left: Example ChR2-YFP expression in PB. Bottom right: Retrieval test flavor preference for the same experiment (n = 6 mice per group). e, Left: Schematic for the CGRPCEA projection stimulation experiment. Cre-dependent ChRmine-mScarlet virus was injected bilaterally into the PB of Calca::Cre mice and optical fibers were implanted bilaterally above the CEA. During the behavioral experiment, CGRPCEA projection stimulation began 30-min after novel flavor consumption. Middle: Example ChRmine-mScarlet expression in CEA. Right: Retrieval test flavor preference for the same experiment (n = 6 mice per group). f, Left: Schematic for the CGRPCEA projection inhibition experiment. Cre-dependent eOPN3-mScarlet virus was injected bilaterally into the PB of Calca::Cre mice and optical fibers were implanted bilaterally above the CEA. During the behavioral experiment, CGRPCEA projection inhibition and LiCl injection began 30-min after novel flavor consumption. Middle: Example eOPN3-mScarlet expression in CEA. Right: Retrieval test flavor preference for the same experiment (n = 11 eOPN3 mice, 9 YFP mice). g, Schematic of the CGRP stim Fos timepoint, which used Calca::ChR2 mice with optical fibers implanted bilaterally above the PB (n = 14 novel flavor mice, 13 familiar flavor mice). h, Comparison of CEA Fos in individual familiar (blue) and novel (red) flavor condition mice. i, Correlation between the average Fos+ cell count across both flavor conditions in each brain region for the LiCl-induced malaise timepoint versus the CGRP stim timepoint for the amygdala network (Cluster 1 from Fig. 2d,e; top; n = 12 regions) and for all other regions (bottom; n = 117 regions). See also Extended Data Fig. 6c. j, Panels are analogous to i, but comparing the difference between Novel and Familiar flavor groups. See also Extended Data Fig. 6d. k, Visualization of the spatially resolved difference in Fos+ cell density across flavor conditions with Allen CCF boundaries overlaid. See Fig. 2f for brain region number legend. l, Top: Schematic of the CGRPCEA projection stimulation RNAscope FISH experiment, which used Calca::ChR2 mice with optical fibers implanted bilaterally above the CEA (n = 6 novel flavor mice, 7 familiar flavor mice; 490 ± 54 Fos+neurons per mouse). Bottom: Example FISH data showing Fos expression (as a marker of neural activation) and Sst, Prkcd, and Calcrl expression (as markers of known CEA cell types) in the CEA following CGRPCEA projection stimulation. See Extended Data Fig. 6g,h for an expanded version. m, Comparison of marker gene expression in Fos+ neurons for individual familiar (blue) and novel (red) flavor condition mice. n, Comparison of marker gene co-expression. P-values in df are from Wilcoxon rank-sum tests. P-value in h is from a GLMM marginal effect z-test. P-values in i,j are from Pearson correlation t-tests. All within-gene Novel vs. Familiar comparisons in m,n are not significant with Wilcoxon rank-sum tests. Error bars represent mean ± s.e.m. Shaded areas in b represent mean ± s.e.m. and in i,j represent 95% confidence interval for linear fit. Units in j are % per mm3. *P ≤ 0.05, **P ≤ 0.01, ****P ≤ 0.0001.
Fig. 4 |
Fig. 4 |. Postingestive CGRP neuron activity preferentially reactivates the representation of a recently consumed novel flavor in the amygdala.
a, Hypotheses for how the amygdala associates temporally separated flavor and malaise signals to support CTA learning. Hypothesis 1: Individual novel flavor-coding neurons may be persistently activated long after a meal, either through cell-autonomous or circuit mechanisms, in a manner that provides passive overlap with delayed CGRP neuron malaise signals. Hypothesis 2: CGRP neuron inputs may specifically reactivate novel flavor-coding neurons. Hypothesis 3: CGRP neuron inputs may specifically activate a separate population of neurons that subsequently becomes incorporated into the novel flavor representation upon memory retrieval. Each of these hypotheses provides a plausible mechanism for linking flavors to malaise signals, but they make mutually exclusive predictions about single-neuron and populational-level activity across the stages of learning. b, Schematic of the CTA paradigm for chronic Neuropixels recordings and CGRP neuron stimulation. We trained mice to consume the novel flavor and water at relatively equal rates, and the total amount consumed was equal (Extended Data Fig. 8a; see Methods). c, Reconstruction of recording trajectories registered to the Allen CCF. Each line represents one shank of a four-shank Neuropixels 2.0 probe targeting CEA (n = 32 shanks from 8 mice). d, Heatmap showing the trial-average spiking of all recorded CEA neurons (n = 1,104 single- and multi-units from 8 mice) to novel flavor and water consumption during the consumption period (left) and during the delay and CGRP neuron stimulation periods (right). Neurons are grouped by their novel flavor/water preference and then sorted by consumption response magnitude. Consumption PETHs are time-locked to delivery of the flavor or water, which was triggered by the animal entering the port. e, Average spiking of the novel flavor-preferring (red; n = 373 neurons), water-preferring (blue; n = 121 neurons), and non-selective (black; n = 610 neurons) populations across the entire experiment. The inset quantifies the average response of each population during the entire 45-min CGRP neuron stimulation period. f, Left: Heatmap showing the trial-average spiking of all recorded neurons to individual 3-s bouts of 10-Hz CGRP neuron stimulation. Right: Average spiking of the novel flavor-preferring (red), water-preferring (blue), and non-selective (black) populations during CGRP neuron stimulation bouts. The inset quantifies the average response of each population within bouts of CGRP neuron stimulation. g, Example multinomial logistic regression decoder session. The top row shows the moment-by-moment decoder posterior for the novel flavor (red) and water (blue). The raster below shows time-locked neural activity for novel flavor-preferring, water-preferring, and non-selective neurons. The symbols in the legend represent the true event times (novel flavor delivery, water delivery, CGRP neuron stimulation), not decoder predictions. Only a subset of recorded neurons is shown for clarity (50 out of 90). h, Average decoder posterior time-locked to CGRP neuron stimulation for the example animal (top) and across all mice (bottom; n = 6 mice). i, Average reactivation rate for the novel flavor and water across the delay and CGRP neuron stimulation periods (n = 6 mice). We defined a reactivation event as any peak in the decoder posterior trace that was > 0.5. j, Top: Schematic of the population activity dimensionality reduction analysis. Bottom: The first two principal components explained >70% of the variance in trial-average population dynamics during novel flavor and water consumption. k, Left: Neural trajectories for novel flavor consumption (red), water consumption (blue), and CGRP neuron stimulation in PC-space. Right: Time-courses along the PC1 and PC2 axes for the trajectories to left. l, Dimensionality reduction analysis performed separately for four individual example mice, rather than on all mice combined as in k. m, Schematic of the CTA paradigm for chronic Neuropixels recordings and LiCl-induced malaise. n, Average spiking of the novel flavor-preferring (red; n = 280 neurons from 4 mice), water-preferring (blue; n = 80 neurons), and non-selective (black; n = 218 neurons) populations across the entire experiment. The inset quantifies the average response of each population following LiCl injection. o, Average population-level reactivation rate for the novel flavor and water across the delay and malaise periods (n = 4 mice). p, Example CGRP immunoreactivity data confirming genetic ablation of CGRP neurons by taCasp3-TEVp. See also Extended Data Fig. 9f,g. q, Analogous to n, but for mice with CGRP neuron ablation (n = 124 novel flavor-preferring neurons, 20 water-preferring neurons, 256 non-selective neurons from 4 mice). r, Analogous to o, but for mice with CGRP neuron ablation (n = 4 mice). P-values in e,f,n,q are from Wilcoxon rank-sum tests corrected for multiple comparisons across neuron groups. Error bars and shaded areas represent mean ± s.e.m. **P ≤ 0.01, ***P ≤ 0.001, ****P ≤ 0.0001, NS, not significant (P > 0.05).
Fig. 5 |
Fig. 5 |. Postingestive CGRP neuron activity induces plasticity to stabilize novel flavor representations in the amygdala upon memory retrieval.
a, Spike waveforms, autocorrelograms, and flavor response rasters for one example neuron tracked across conditioning and retrieval days. b, Heatmap showing the average spiking of all recorded neurons (n = 939 neurons from 8 mice) to novel flavor and water consumption during the consumption period (left) and during the delay and CGRP neuron stimulation periods (middle) on conditioning day, and the responses of the same neurons to flavor and water consumption on retrieval day. Neurons are grouped by their novel flavor/water preference on pairing day and then sorted by CGRP response magnitude. c, Left: Trial-average spiking of the novel flavor-preferring population (n = 265 neurons) during flavor consumption on conditioning day (black) and retrieval day (red). Middle/Right: Trial-average spiking of the novel-preferring neurons with the highest 10% of CGRP response magnitudes (High CGRP response; middle) and of the remaining novel-preferring neurons (Low CGRP response; right) on conditioning day and retrieval day. The insets show the average CGRP neuron stimulation response profile of each subpopulation. d, Correlation between each neuron’s change (Retrieval – Conditioning) in flavor response (top) or selectivity (bottom) during the consumption period to its average response during the CGRP neuron stimulation period. The novel flavor-preferring (left; n = 265 neurons), water-preferring (middle; n = 123 neurons), and non-selective (right; n = 551 neurons) populations are shown separately. e, Analogous to d, but for mice with CGRPCEA projection stimulation rather than cell-body stimulation (n = 286 novel flavor-preferring neurons from 8 mice). See Extended Data Fig. 10c–e for additional analysis. f, Left: Schematic for the flavor familiarization experiment. Right: Trial-average spiking of the initially flavor-preferring population (n = 201 neurons from 7 mice; classified on novel day) during flavor consumption on novel day (black) and familiar day (blue). The inset quantifies the average response on each day. See Extended Data Fig. 10h–k for additional analysis. g, Illustration of a neural mechanism for learning from delayed postingestive feedback using malaise-driven reactivation and stabilization of amygdala novel flavor representations. P-values in d,e are from Pearson correlation t-tests. P-value in f is from a Wilcoxon signed-rank test. Error bars represent mean ± s.e.m. Shaded areas in c,f represent mean ± s.e.m. and in d,e represent 95% confidence interval for linear fit. *P ≤ 0.05, ***P ≤ 0.001, ****P ≤ 0.0001, NS, not significant (P > 0.05).
Fig. 6 |
Fig. 6 |. Novel flavor consumption triggers PKA activity in the amygdala, providing a potential biochemical eligibility trace for reactivation by postingestive CGRP neuron activity.
a, Simplified schematic of the biochemical pathway that has been proposed to recruit a subset of amygdala neurons into the CTA memory retrieval ensemble (“memory engram”)–,–. b, Schematic for recording PKA activity in the CEA across familiarization using the AKAR2 sensor. c, Example AKAR2 expression in the CEA. d, PKA activity in the CEA in response to consumption of a novel or familiar flavor (Port A; red) and to water (Port B; blue) across four consecutive days (n = 13 mice). Points and error bars at the top of each plot indicate the timing of the next reward consumption. e, PKA activity for individual mice in response to novel or familiar flavor and to water consumption. Mice are sorted by novel flavor response (Day 1). f, Summary of PKA activity in response to novel or familiar flavor and to water consumption (n = 13 mice). g, PKA activity in response to novel flavor (left) and water (right) consumption on Day 1 for individual mice aligned to the Allen CCF (n = 13 mice). h, Schematic of a putative hypothesis linking biochemistry with neural activity during CTA, with novel flavor-dependent increases in PKA in amygdala neurons leading to increased reactivation by delayed CGRP neuron inputs and recruitment into the CTA memory retrieval ensemble. P-values in f are from GLMM marginal effect z-tests corrected for multiple comparisons across days. Error bars and shaded areas represent mean ± s.e.m. *P ≤ 0.05, ****P ≤ 0.0001, NS, not significant (P > 0.05).

References

    1. Garcia J., Kimeldorf D. J. & Koelling R. A. Conditioned aversion to saccharin resulting from exposure to gamma radiation. Science 122, 157–158 (1955). - PubMed
    1. Garcia J. & Koelling R. A. Relation of cue to consequence in avoidance learning. Psychonomic Science 4, 123–124 (1966).
    1. Garb J. L. & Stunkard A. J. Taste Aversions in Man. American Journal of Psychiatry 131, 1204–1207 (1974). - PubMed
    1. Carter M. E., Han S. & Palmiter R. D. Parabrachial Calcitonin Gene-Related Peptide Neurons Mediate Conditioned Taste Aversion. Journal of Neuroscience 35, 4582–4586 (2015). - PMC - PubMed
    1. Zhang C. et al. Area Postrema Cell Types that Mediate Nausea-Associated Behaviors. Neuron 109, 461–472 (2021). - PMC - PubMed

Publication types