[Preprint]. 2023 Oct 10:2023.10.10.561760.
doi: 10.1101/2023.10.10.561760.

Phosphoglycerate kinase is a central leverage point in Parkinson's Disease driven neuronal metabolic deficits

Affiliations

Phosphoglycerate kinase is a central leverage point in Parkinson's Disease driven neuronal metabolic deficits

Alexandros C Kokotos et al. bioRxiv. .

Update in

Abstract

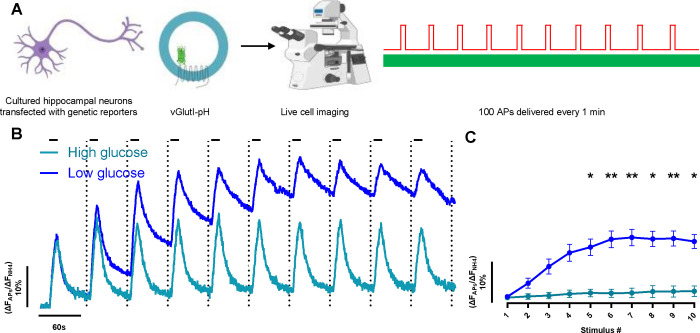
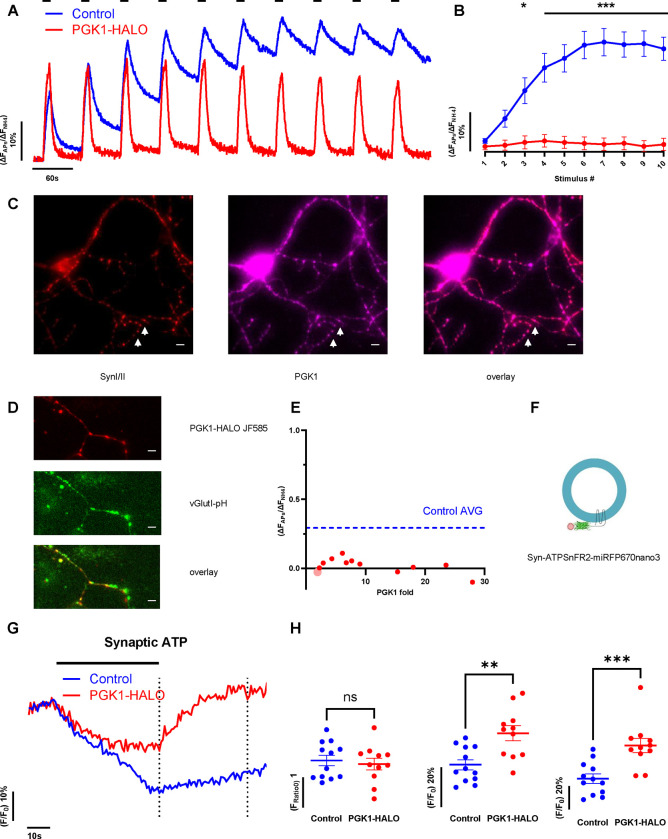
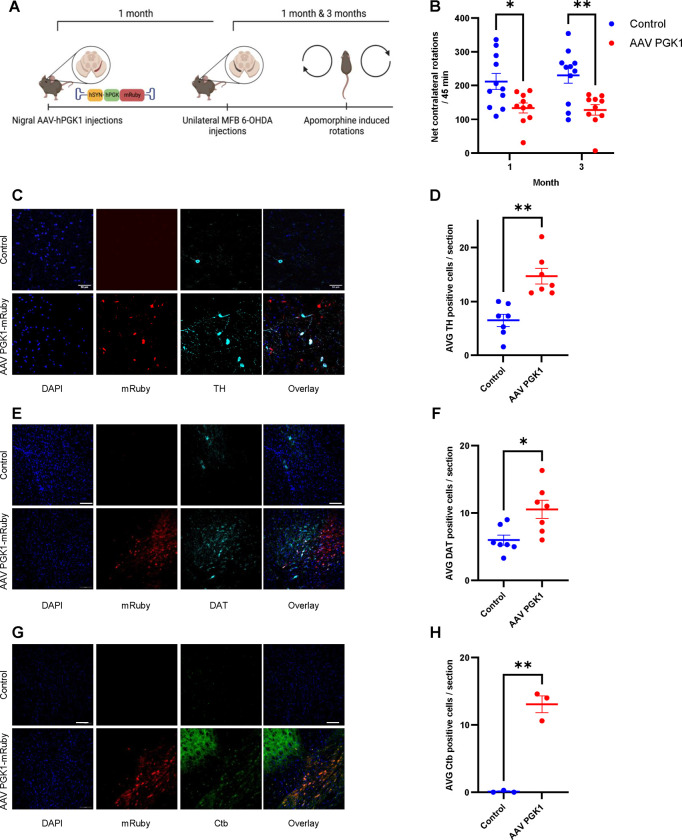
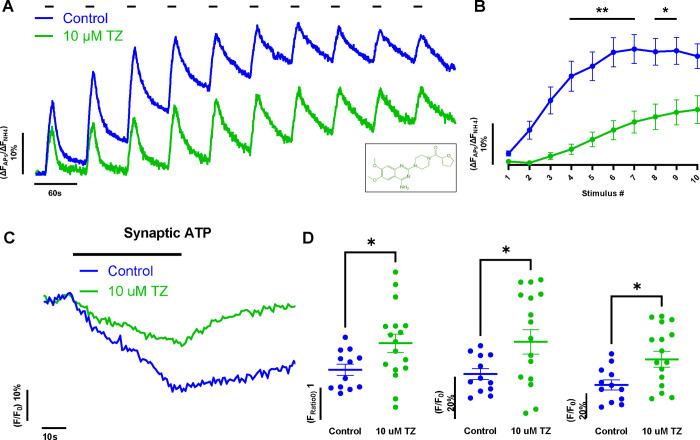
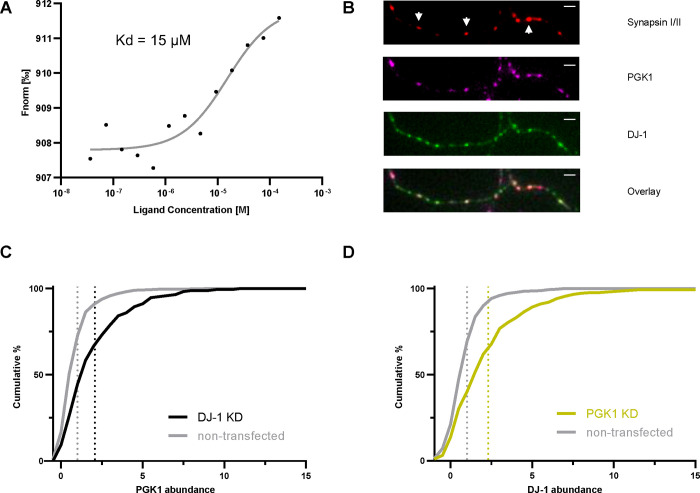
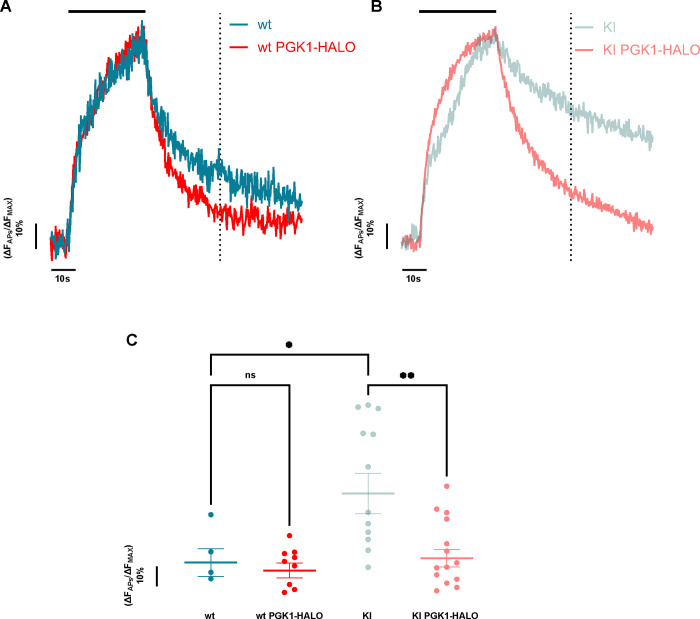
Phosphoglycerate kinase 1 (PGK1), the first ATP producing glycolytic enzyme, has emerged as a therapeutic target for Parkinson's Disease (PD), since a potential enhancer of its activity was reported to significantly lower PD risk. We carried out a suppressor screen of hypometabolic synaptic deficits and demonstrated that PGK1 is a rate limiting enzyme in nerve terminal ATP production. Increasing PGK1 expression in mid-brain dopamine neurons protected against hydroxy-dopamine driven striatal dopamine nerve terminal dysfunction in-vivo and modest changes in PGK1 activity dramatically suppressed hypometabolic synapse dysfunction in vitro. Furthermore, PGK1 is cross-regulated by PARK7 (DJ-1), a PD associated molecular chaperone, and synaptic deficits driven by PARK20 (Synaptojanin-1) can be reversed by increasing local synaptic PGK1 activity. These data indicate that nerve terminal bioenergetic deficits may underly a spectrum of PD susceptibilities and the identification of PGK1 as the limiting enzyme in axonal glycolysis provides a mechanistic underpinning for therapeutic protection.


Figures

Figure 1.
Figure 1.. Hypometabolic synaptic endurance assay
(A) Assay schematic: Cultured primary hippocampal neurons expressing vGlutI-pH incubated in imaging media of interest for 5 min prior to ten bouts of AP firing (100 APs at 10 Hz, highlighted as black bars in the traces) delivered every minute. (B) Ensemble average vGlutI-pH responses are normalized to the maximal sensor fluorescence revealed by perfusion with 50 mM NH4Cl. With sufficient fuel (5 mM glucose, teal) efficient SV recycling persists for all rounds of stimulation but in low glucose (0.1 mM glucose, blue) SV recycling gradually slows, resulting in a net accumulation of fluorescence. (C) The ensemble average fraction of the fluorescence remaining 55 s post stimulation for each bout for high and low glucose conditions mean ± SEM for the data shown in (B), 5 mM glucose N=6, 0.1 mM glucose N=23 *p < 0.05, **p < 0.01 2-way ANOVA.
Figure 2.
Figure 2.. Synaptic PGK1 expression confers synaptic resilience under hypometabolic stress.
(A) Ensemble average vGlutI-pH fluorescence in neurons expressing PGK1-HALO (red) shows that synaptic endurance is fully restored in 0.1 mM glucose compared to controls (blue). (B) The remaining fluorescence 55 s post stimulation after each train is plotted as mean ± SEM, control N=23, PGK1-HALO N=12 *p < 0.05, ***p < 0.001 2-way ANOVA. (C) PGK1 (magenta) and synapsin (red) immunofluorescence shows that PGK1 is present in nerve terminals (white arrows). (D) PGK1-HALO (labelled with JF585) also accumulates in nerve terminals (vGlutI-pH, visualized during NH4Cl application) scale bar in C and D 6 μm. (E) Synaptic endurance score, measured as the fluorescence signal of recovery after the 10th round for each cell tested compared to the average synaptic PGK1-HALO expression normalized to non-transfected cells N=12. Dashed blue line shows the average synaptic endurance score for low glucose in control neurons after the 10th round. (F) Schematic of the synapto-iATPSnFR2-miRFP670nano3 sensor used for synaptic ATP measurements. (G) Ensemble average synapto-iATPSnFR2-miRFP670nano3 traces for control (blue) and PGK1-HALO (red) transfected cells stimulated with 600 APs at 10 Hz in 0.1 mM glucose. PGK1-HALO neurons show a significant activity dependent upregulation of ATP synthesis following activity. (H) Comparison of absolute nerve terminal ATP values pre-stimulus (left) at the end of the stimulus (left dotted line in (PGK1-HALO)) (middle) and 35 s post-stimulus (right dotted line in C) (right) in control and PGK1-HALO expressing neurons, mean ± SEM indicated, control N=12, PGK1-Halo N=11. *p < 0.05, **p < 0.01 unpaired t-test.
Figure 3.
Figure 3.. PGK1 protects dopaminergic neurons degeneration in vivo
(A) An AAV driving hSyn PGK1-mRuby was injected unilaterally in the substantia nigra 30 days before 6-OHDA was injected in the medial forebrain bundle, with control mice only receiving the 6-OHDA injections. At 30 or 90 days after the 6-OHDA injection, both controls and AAV injected mice were subjected to apomoprhine induced rotation tests. (B) PGK1-mRuby expression significantly suppressed the apomorphine induced rotations, mean ± SEM, Control N=11, AAV PGK1 N=10 *p < 0.05, **p < 0.01 2-way ANOVA. (C) Immunostaining of control and AAV PGK1 mid-brain brain slices against a nuclear marker, DAPI, mRuby and a dopaminergic neuronal marker, TH. Scale bar 50 μm. (D) Quantification of the number of TH positive cells showed a significant increase in the amount of alive cells post lesion in case of the PGK1 AAV. Control N=8, AAV PGK1 N=8 **p < 0.01 unpaired t-test. (E) Immunostaining of control and AAV PGK1 mid-brain brain slices against a nuclear marker, DAPI, mRuby and a second dopaminergic neuronal marker, DAT. Scale bar 100 μm. (F) Quantification of the total number of DAT positive cells showed a significant increase in the amount of alive cells post lesion in case of the PGK1 AAV. Control N=7, AAV PGK1 N=7 *p < 0.05 unpaired t-test. (G) Prior to carrying out retrospective immunostaining, the striatums of the animals were injected with a retrograde tracer, cholera toxin subunit b, Scale bar 100 μm. (H) Quantification of the number of Ctb positive cells also showed a significant increase in the amount of alive cells post lesion in case of the PGK1 AAV. Control N=3, AAV PGK1 N=3 **p < 0.01 unpaired t-test.
Fig. 4
Fig. 4. Terazosin confers metabolic synaptic resilience.
(A) Ensemble average vGlutI-pH traces for control (blue) and Terazosin (TZ) treated (green) primary hippocampal neurons subjected to repeated stimulation in 0.1 mM glucose (TZ chemical structure shown in window). (B) The synaptic endurance, measured as the remaining fluorescence 55 sec after each AP bout (mean ± SEM) for the traces in (A) show that TZ confers significant resilience. Control N=23, Terazosin N=10 *p < 0.05, **p < 0.01 2-way ANOVA. (C) The kinetics of presynaptic ATP measured with synapto-iATPSnFR2-miRFP670nano3, normalized to the pre-stimulus values reveal that TZ incubated cells stimulated with 600 APs in 0.1 mM glucose have significantly smaller activity-induced drops in ATP and more rapid post-stimulus recovery as well as higher starting ATP. (D) Comparison of the absolute nerve terminal ATP values pre-stimulus (left) at the end of the stimulus (middle) and 35 s post-stimulus (right) in control and TZ treated neurons mean ± SEM indicated, control N=12, TZ N=17. *p < 0.05, **p < 0.01 unpaired t-test.
Fig. 5
Fig. 5. PARK7/DJ-1 is necessary for PGK1 driven hypometabolic resilience.
(A) Ensemble vGlutI-pH traces in neurons, expressing PGK1-HALO (red) or PGK1-HALO with DJ-1 KD (black) and (C) TZ treated neurons (green) versus TZ treated in DJ-1 KD (black) subjected to repeated electrical stimulation (B) Synaptic endurance measured vGlutI-pH fluorescence 55 s after each stimulus bout for the traces in (A) mean ± SEM, PGK1-HALO N=12, PGK1-HALO + DJ-1 KD N=7 **p < 0.01, ***p < 0.001 2-way ANOVA and (D) mean ± SEM, Terazosin N=10, Terazosin + DJ-1 KD N=10 *p < 0.05, ***p < 0.001 mixed-effects (E) The kinetics of presynaptic ATP normalized to the pre-stimulus values when neurons were stimulated with 600 APs at 10 Hz in 0.1 mM glucose in absence of DJ-1 reveal a significantly larger activity-induced drop in ATP and defective post-stimulus recovery. (F) Comparison absolute nerve terminal ATP values pre-stimulus (left) at the end of the stimulus (middle) and 35 s post-stimulus (right) in control and DJ-1 KD neurons mean ± SEM indicated, control N=12, DJ-1 KD N=11. *p < 0.05, ***p < 0.001 unpaired t-test. (G) The kinetics of presynaptic ATP normalized to the pre-stimulus values when neurons were stimulated with 600 APs at 10 Hz in 0.1 mM glucose in TZ and DJ-1 KD reveal an inability of TZ to accelerate ATP kinetics in absence of DJ-1. (H) Comparison absolute nerve terminal ATP values pre-stimulus (left) at the end of the stimulus (middle) and 35 s post-stimulus (right) in TZ and TZ with DJ-1 KD neurons mean ± SEM indicated, TZ N=17, TZ DJ-1 KD N=8. *p < 0.05, ***p < 0.001 unpaired t-test.
Fig. 6
Fig. 6. DJ-1 interacts with PGK1 while their levels are co-regulated in nerve terminals
(A) Microscale thermophoresis identified an in-vitro interaction between PGK1 and DJ-1 with a low micromolar affinity (~ 15 μM). (B) Immunostaining against PGK1 (magenta), synapsin (red) and DJ-1 (green) shows that DJ-1 and PGK1 are both present in nerve terminals (white arrows), white bar 2 μm. (C) Cumulative histogram of presynaptic PGK1 fluorescence immunostaining intensity in control (grey) and DJ-1 KD nerve terminals (black), DJ-1 KD N=171, non-transfected N=500 (D) DJ-1 fluorescence immunostaining in control (grey) and PGK1 KD nerve terminals (yellow), PGK1 KD N=290, control N=500). Distributions in both KD are significantly different then their respective controls ***p < 0.001 Kolmogorov-Smirnoff.
Fig. 7
Fig. 7. PGK1 restores synaptic function in PARK20 neurons (SynjI R258Q mutation)
(A) Ensemble average vGlutI-pH traces in primary wt and (B) SynjI R258Q KI mouse cortical neurons stimulated with 600 APs (10 Hz, indicated by the black bar) with PGK1-HALO expression (red) or without (teal). (C) Quantification of the remaining fluorescence of the vGlut-pH traces 60 s post stimulation (indicated by the dotted line) mean ± SEM, wt N=6, wt PGK1-HALO N=10, KI N=12, KI PGK1-HALO N=16 *p < 0.05, **p < 0.01 1-way ANOVA.

References

    1. Rangaraju V., Calloway N., and Ryan T.A. (2014). Activity-driven local ATP synthesis is required for synaptic function. Cell 156, 825–835. S0092-8674(14)00013-0 [pii] 10.1016/j.cell.2013.12.042. - DOI - PMC - PubMed
    1. Ashrafi G., Wu Z., Farrell R.J., and Ryan T.A. (2017). GLUT4 Mobilization Supports Energetic Demands of Active Synapses. Neuron 93, 606–615.e603. 10.1016/j.neuron.2016.12.020. - DOI - PMC - PubMed
    1. Ashrafi G., de Juan-Sanz J., Farrell R.J., and Ryan T.A. (2020). Molecular Tuning of the Axonal Mitochondrial Ca 2+ Uniporter Ensures Metabolic Flexibility of Neurotransmission. Neuron 105, 678–687.e675. 10.1016/j.neuron.2019.11.020. - DOI - PMC - PubMed
    1. Mosconi L., De Santi S., Li J., Tsui W.H., Li Y., Boppana M., Laska E., Rusinek H., and de Leon M.J. (2008). Hippocampal hypometabolism predicts cognitive decline from normal aging. Neurobiol Aging 29, 676–692. 10.1016/j.neurobiolaging.2006.12.008. - DOI - PMC - PubMed
    1. Pickrell A.M., and Youle R.J. (2015). The roles of PINK1, parkin, and mitochondrial fidelity in Parkinson’s disease. Neuron 85, 257–273. 10.1016/j.neuron.2014.12.007. - DOI - PMC - PubMed

Publication types