[Preprint]. 2025 May 16:2023.09.29.560039.
doi: 10.1101/2023.09.29.560039.

Commensal myeloid crosstalk in neonatal skin regulates cutaneous type 17 inflammation

Affiliations

Commensal myeloid crosstalk in neonatal skin regulates cutaneous type 17 inflammation

Miqdad O Dhariwala et al. bioRxiv. .

Abstract

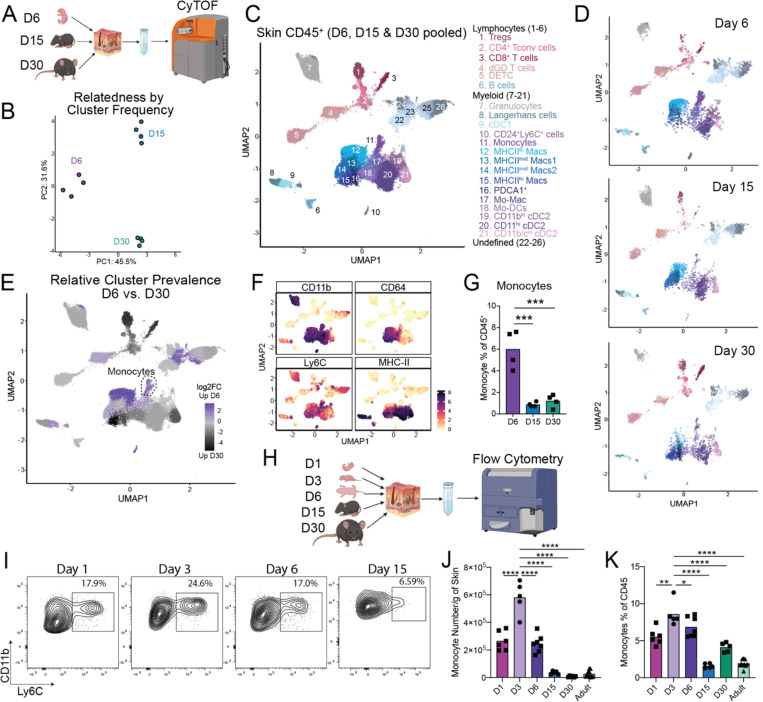
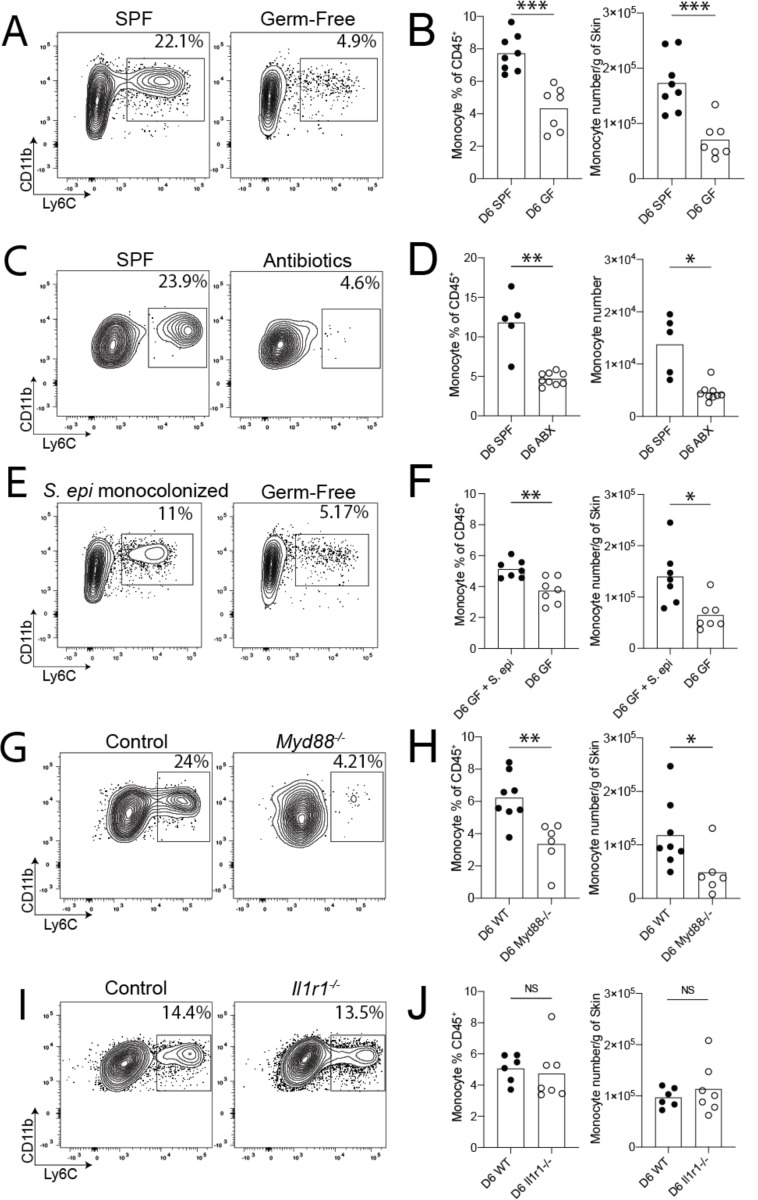
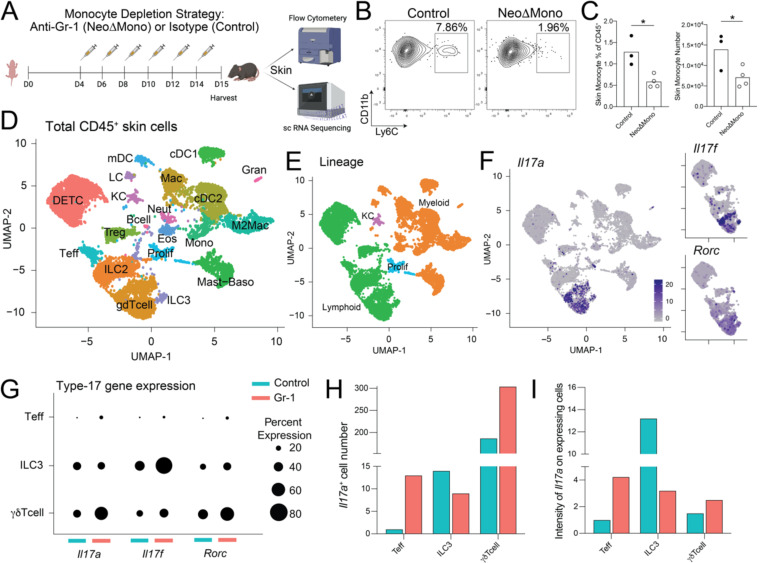
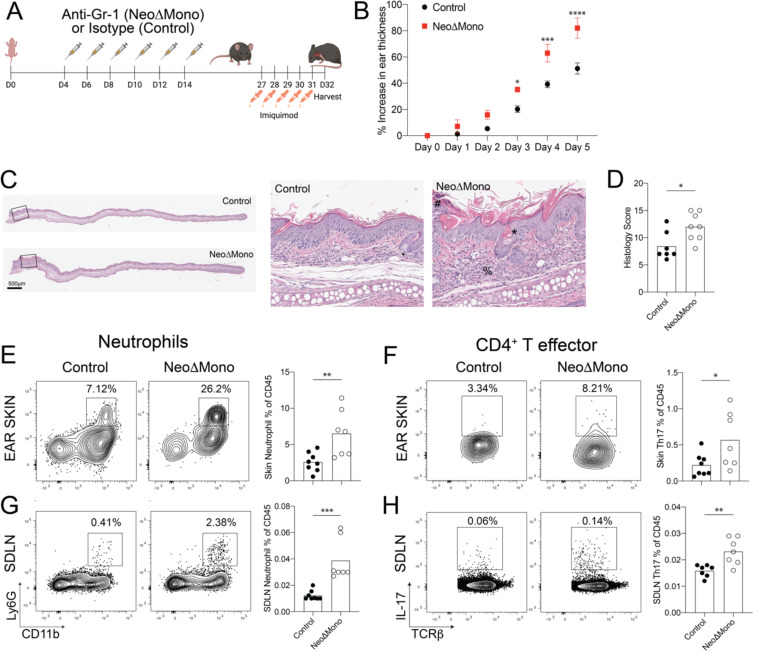
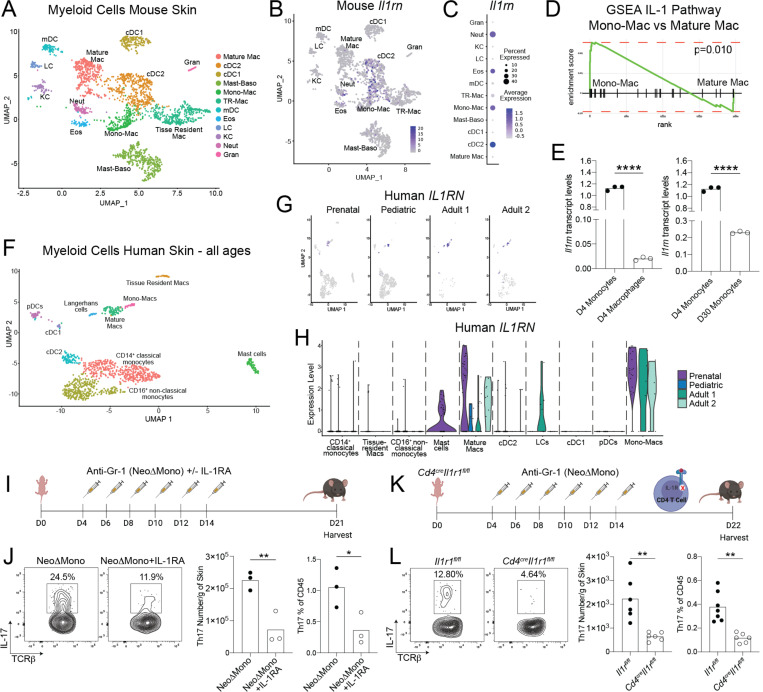
Early life microbe-immune interactions at barrier surfaces have lasting impacts on the trajectory towards health versus disease. Monocytes, macrophages and dendritic cells are primary sentinels in barrier tissues, yet the salient contributions of commensal-myeloid crosstalk during tissue development remain poorly understood. Here, we identify that commensal microbes facilitate accumulation of a population of monocytes in neonatal skin. Transient postnatal depletion of these monocytes resulted in heightened IL-17A production by skin T cells, which was particularly sustained among CD4+ T cells and sufficient to exacerbate inflammatory skin pathologies. Neonatal skin monocytes were enriched in expression of negative regulators of the IL-1 pathway. Functional in vivo experiments confirmed a key role for excessive IL-1R1 signaling in T cells as contributing to the dysregulated type 17 response in neonatal monocyte-depleted mice. Thus, a commensal-driven wave of monocytes into neonatal skin critically facilitates immune homeostasis in this prominent barrier tissue.


Conflict of interest statement

T.C.S is on the scientific advisory board of Concerto Biosciences. M.H.S. is founder, shareholder and board member of Teiko.bio, has received a speaking honorarium from Fluidigm Inc., Kumquat Bio, and Arsenal Bio, has been a paid consultant for Five Prime, Ono, January, Earli, Astellas, and Indaptus, and has received research funding from Roche/Genentech, Pfizer, Valitor, and Bristol Myers Squibb.

Figures

Figure 1:
Figure 1:. Classical monocytes rapidly accumulate in neonatal skin
(A) Skin tissue from mice at the postnatal Day 6, Day 15 and Day 30 ages was harvested and analyzed by Mass Cytometry (CyTOF). (B) Principal component analysis (PCA) plot demonstrating the distribution of the cutaneous CD45+ cellular compartment based on cluster frequency. Each dot represents a single mouse at the indicated age. (C) Pooled UMAP plot demonstrating clusters of CD45+ immune cells in the skin of mice at Day 6, 15 and 30. (D) Individual UMAPs demonstrating immune cell clusters in the skin of Day 6, 15 and 30 mice. (E) UMAP demonstrating clusters of immune cells enriched in the skin of Day 6 (purple) or Day 30 (black) mice. (F) UMAPs demonstrating expression profile of indicated markers to identify monocyte cluster. (G) Enumeration of monocytes as a percent of the total immune cell compartment of the skin at the indicated time points. (H) Back skin from mice at postnatal day 1, 3, 6, 15 & 30 and >8-week-old adult mice was analyzed by Flow Cytometry. (I) Representative flow cytometry plots of skin monocytes at the indicated ages. (J-K) Enumeration of skin monocytes by flow cytometry as (J) total numbers per gram of skin and (K) percentage of CD45+ cells. For CyTOF experiment n=4 mice were used at each time point, for flow cytometry assays >4 mice were used at each time point. Data presented in I-K is one representative of at least two independent experiments. Statistical significance was determined by a One-Way ANOVA where *** is p<0.001 and **** is p<0.0001.
Figure 2:
Figure 2:. Commensal microbiota facilitate early skin accumulation of monocytes
Neonatal skin from mice at the postnatal Day 6 age was harvested and analyzed for monocytes using flow cytometry. Representative flow cytometry plots and quantification of monocyte numbers from (A-B) Specific Pathogen Free (SPF) control and Germ-Free (GF) pups, (C-D) SPF control pups and pups born to antibiotic treated dams in cleaner environments, (E-F) GF pups colonized on postnatal Day 2 of life with S. epidermidis and age-matched GF controls, (G-H) Control and Myd88−/− pups, (I-J) Control and Il1r1−/− pups. Data from (A-B and G-H) are pooled from two experiments where each point represents a single mouse with a pooled n≥5 mice per group, per condition. Data from (C-D, E-F and I-J) are one representative of at least two independent experiments with n≥5 mice per group, per condition. Statistical significance was determined by a two-tailed Student’s t test where * is p<0.05, ** is p<0.01 and *** is p<0.001
Figure 3:
Figure 3:. Neonatal monocyte depletion affects type 17 signature of skin T cells
(A) Monocytes were depleted in neonatal mice by treatment with the anti-Gr-1 antibody (NeoΔMono mice) and controls were treated with isotype antibody. Skin from these mice was then processed either for flow cytometry or scRNA-seq. (B-C) Representative flow plots, with percent of parent gate shown, and quantification of monocytes, as % of CD45+ and absolute numbers, from the skin of NeoΔMono mice and controls at postnatal Day 15. (D-E) UMAP from scRNA-seq analyses demonstrating clusters of immune cell populations in the skin of NeoΔMono and control mice. (F) UMAPs demonstrating expression profiles of Il17a, Il17f and Rorc in skin lymphoid clusters of NeoΔMono and control mice, for the latter two only lymphoid clusters are shown. (G) Dot plot demonstrating the percent of cells within the cutaneous Teff, ILC3 and γδ T cell clusters that express Il17a, Il17f and Rorc in NeoΔMono and control mice. (H-I) Quantification of the number of Il17a expressing cells and intensity of Il17a expression in Teff, ILC3 and γδ T cell clusters. For C, statistical significance was determined by a two-tailed Student’s t test where * is p<0.05. All scRNA-seq analyses were performed post normalizing clusters across both treatment groups.
Figure 4:
Figure 4:. Transient depletion of monocytes in early life leads to sustained type 17 inflammatory responses from cutaneous T lymphocytes.
(A) Monocytes were depleted in neonatal mice by treatment with the anti-Gr-1 antibody (NeoΔMono mice) and controls were treated with isotype antibody. Skin from these mice were then processed for flow cytometry at postnatal Day 21. (B & D) Representative flow cytometry plots and quantification of numbers of CD4+ T effector cells producing IL-17 in the skin (B) and skin draining lymph nodes (D). (C & E) Representative flow cytometry plots and quantification of numbers of γδ T cells producing IL-17 in the skin (C) and skin draining lymph nodes (E). (F-G) Representative flow cytometry plots and quantification of numbers of CD4+ T regulatory (F) and effector (G) cells in the skin. (H-I) Quantification of numbers of CD4+ T effector cells producing IL-17 in the skin of mice treated with anti-CCR2 antibody (H) or anti-Ly6G antibody (I) according to the same schedule as in (A). Data in A-G are one representative of at least three independent experiments, H-I are one representative of at least two independent experiments. Statistical significance was determined by a two-tailed Student’s t test where * is p<0.05, ** is p<0.01 and *** is p<0.001
Figure 5:
Figure 5:. Commensal microbes contribute to elevated type 17 response in NeoΔMono mice
Skin swabs were taken from NeoΔmono mice and littermate controls on postnatal day 15 and processed for 16S sequencing. (A) Non-metric multidimensional scaling (NMDS) plot calculated using Bray-Curtis dissimilarities of Amplicon Sequence Variants (ASVs) demonstrating the differences in beta-diversity of bacterial communities in day 15 skin between NeoΔmono mice and littermate controls. (B) Environmental fit of ASVs aggregated at the genus level, excluding unassigned genera, driving spatial distribution of points in the NMDS in A. (C) Bar plot showing mean and standard error of the relative abundances of the top 12 most abundant genera, in descending rank-order, in the skin of either group of mice. (D) NeoΔMono mice were treated with topical Neosporin and frequent cage changes while controls were treated with vehicle and subjected to mock cage changes. Skin was then processed for flow cytometry on postnatal Day 22. (E) Representative flow cytometry plots and quantification of numbers of IL-17-producing CD4+ T effector cells in ear skin. (F) Pregnant dams were treated with a cocktail of antibiotics in the drinking water along with frequent cage changes until pups were 21 days old. (G) Representative flow cytometry plots and quantification of numbers of IL-17-producing CD4+ T effector cells in back skin. Data in E are pooled from two of three experiments, data in F is from one of two independent experiments. Analysis of Similarity (anosim; vegan R package) was used to test for differences in the community structures between both treatment groups with statistical significance displayed in plot for (A). For (B) each arrow shows a correlation with the relative abundance and coordinate space for genera with p</=0.05, R>/=0.1. Statistical significance in C, E, and G was determined by a two-tailed Student’s t test where * is p<0.05, and ** is p<0.01.
Figure 6:
Figure 6:. NeoΔmono mice demonstrate a heightened inflammatory response to imiquimod-driven psoriasiform inflammation
(A) Monocytes were depleted in neonatal mice by treatment with the anti-Gr-1 antibody (NeoΔMono mice) and controls were treated with isotype antibody. The ears of these mice were treated daily for five days with 5% Imiquimod cream then one day later ear skin and lymph nodes were harvested. (B) Quantification of relative increase in ear thickness as measured with digital calipers during imiquimod treatment in NeoΔMono versus control mice. (C-D) Representative images of ear skin sections stained with H&E with zoomed inset (C) and quantification of histopathology scoring (D) between groups. # represents parakeratosis (neutrophils in the stratum corneum), * represents hyperkeratosis and plugging and % represents dermal and subcutaneous inflammatory infiltrate. (E-F) Representative flow cytometry plots and quantification of neutrophils (E) and CD4+ Th17 cells (F) in the skin. (G-H) Representative flow cytometry plots and quantification of neutrophils (G) and CD4+ Th17 cells (H) in the skin draining lymph nodes. Data in B is from one of three independent experiments. Data in E-H is data pooled from two independent experiments. Statistical significance in B was determined by a two-way ANOVA with Sidak’s multiple comparisons test where * is p<0.05, *** is p<0.001 and **** is p<0.0001. Statistical significance in E-H was determined using a two-tailed Student’s t test where * is p<0.05, ** is p<0.01 and *** is p<0.001.
Figure 7:
Figure 7:. Neonatal monocytes modulate IL-1 signaling to regulate cutaneous type 17 inflammation
(A) UMAP of myeloid cluster from scRNA-seq analysis of postnatal Day 15 mouse skin. (B) Intensity plot showing Il1rn expression across murine skin myeloid clusters. (C) Quantification of Il1rn expression by normalized average expression and percentage of expressing cells for individual myeloid clusters. (D) Gene Set Enrichment Analyses (GSEA) for IL-1 pathway genes comparing postnatal Day 15 skin mono-mac and mature mac clusters. (E) qPCR analysis of Il1rn transcript levels comparing monocytes versus macrophages sorted from postnatal Day 4 skin and monocytes sorted from postnatal Day 4 versus postnatal Day 30 skin. (F) UMAP of myeloid clusters from scRNA-seq analysis of human skin – combining cells from all four donors. (G-H) Intensity and violin plots showing IL1RN expression across human skin myeloid clusters by age. (I) NeoΔMono mice were either treated with recombinant IL-1Ra or with vehicle. Skin was then processed for flow cytometry on postnatal Day 21. (J) Representative flow cytometry plots and quantification of numbers of CD4+ T effector cells producing IL-17A in the skin. (K) Monocytes were depleted in neonatal Cd4creIl1r1fl/fl or control Il1r1fl/fl mice by treatment with the anti-Gr-1 antibody (NeoΔMono mice). Skin was then processed for flow cytometry on postnatal Day 21. (L) Representative flow cytometry plots and quantification of numbers of CD4+ T effector cells producing IL-17A in the skin. Statistical significance was determined using a two-tailed Student’s t test where * is p<0.05, ** is p<0.01 and **** is p<0.0001. Data in J is representative data from one of three independent experiments and data in L is pooled from two independent experiments.

References

    1. Dwyer L. R. & Scharschmidt T. C. Early life host-microbe interactions in skin. Cell Host & Microbe 30, 684–695 (2022). - PMC - PubMed
    1. Donald K. & Finlay B. B. Early-life interactions between the microbiota and immune system: impact on immune system development and atopic disease. Nat Rev Immunol 1–14 (2023) doi: 10.1038/s41577-023-00874-w. - DOI - PubMed
    1. Lubin J.-B. et al. Arresting microbiome development limits immune system maturation and resistance to infection in mice. Cell Host Microbe 31, 554–570.e7 (2023). - PMC - PubMed
    1. Dhariwala M. O. & Scharschmidt T. C. Baby’s skin bacteria: first impressions are long-lasting. Trends Immunol 42, 1088–1099 (2021). - PMC - PubMed
    1. Scharschmidt T. C. et al. Commensal Microbes and Hair Follicle Morphogenesis Coordinately Drive Treg Migration into Neonatal Skin. Cell Host Microbe 21, 467–477.e5 (2017). - PMC - PubMed

Publication types