[Preprint]. 2023 Oct 10:2023.10.08.561424.
doi: 10.1101/2023.10.08.561424.

Transthalamic input to higher-order cortex selectively conveys state information

Affiliations

Transthalamic input to higher-order cortex selectively conveys state information

Garrett T Neske et al. bioRxiv. .

Update in

Abstract

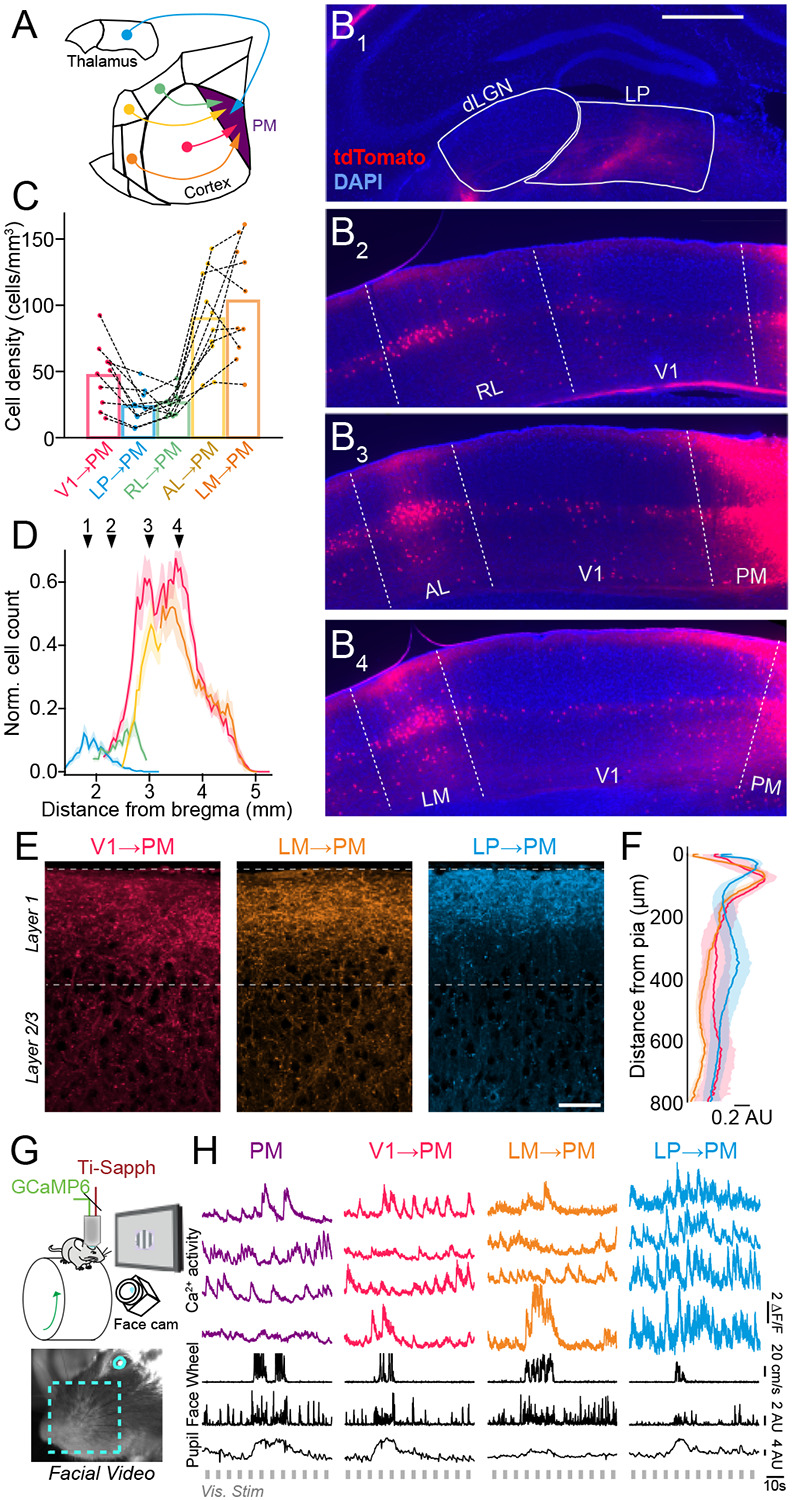
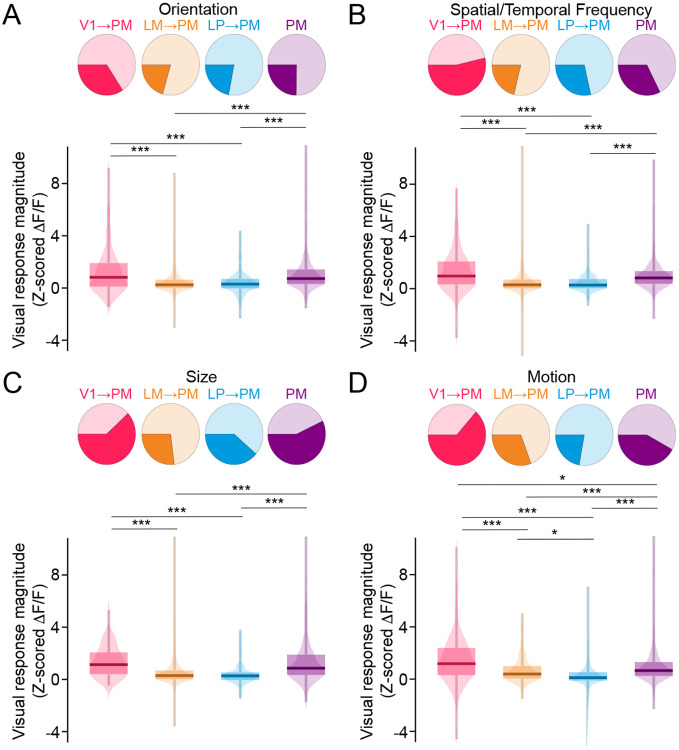
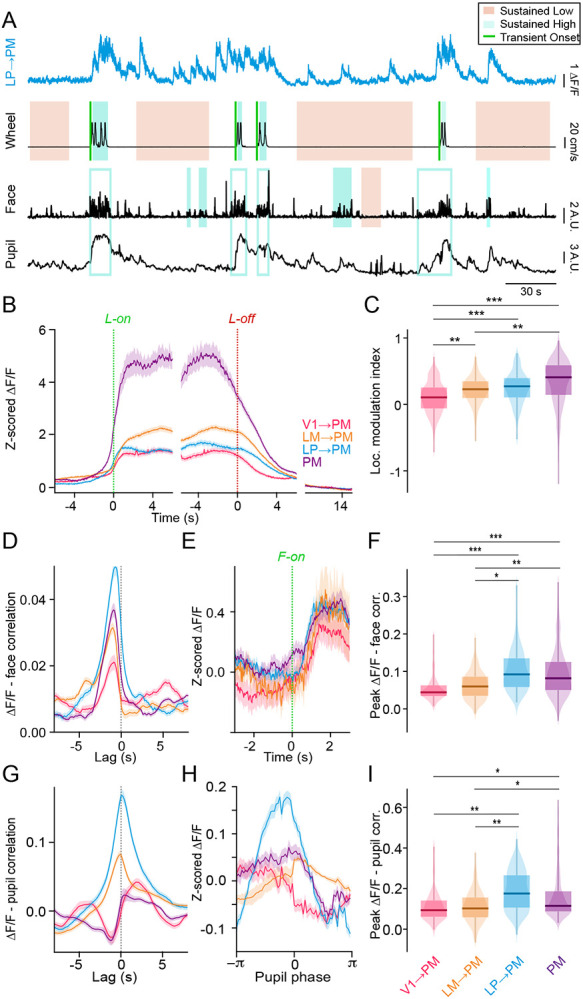
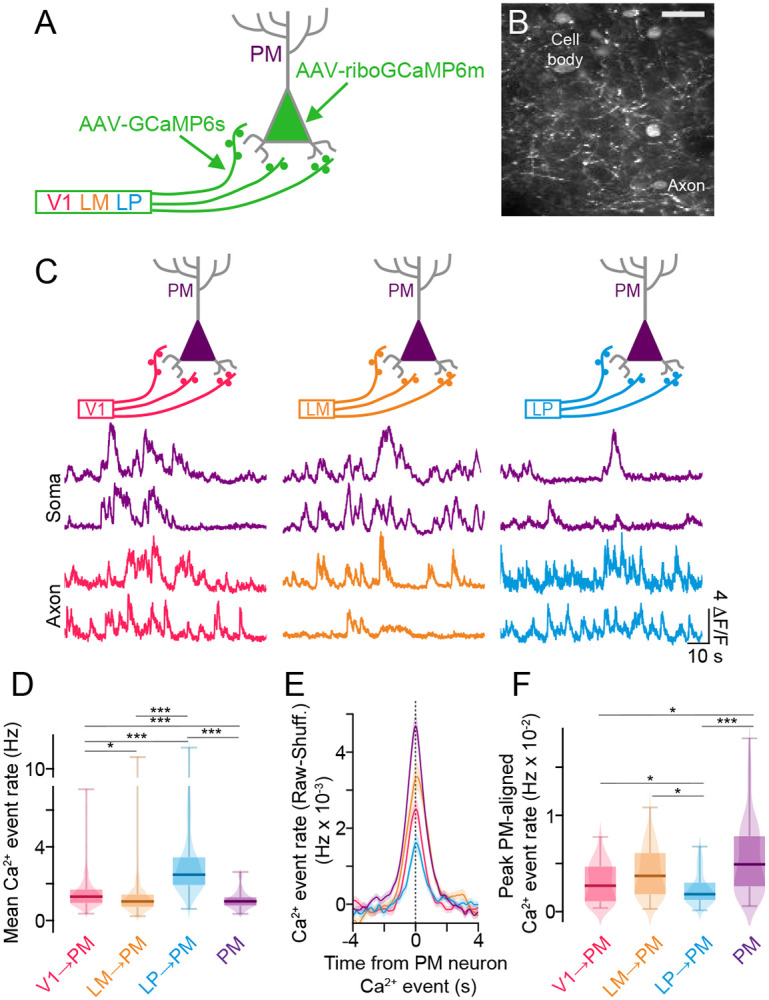
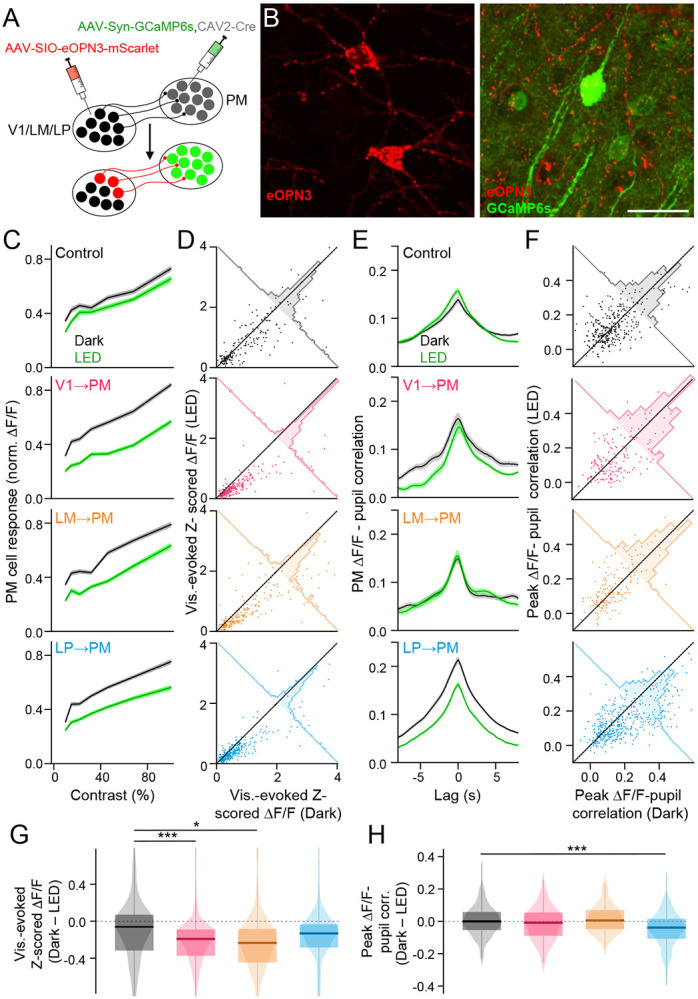
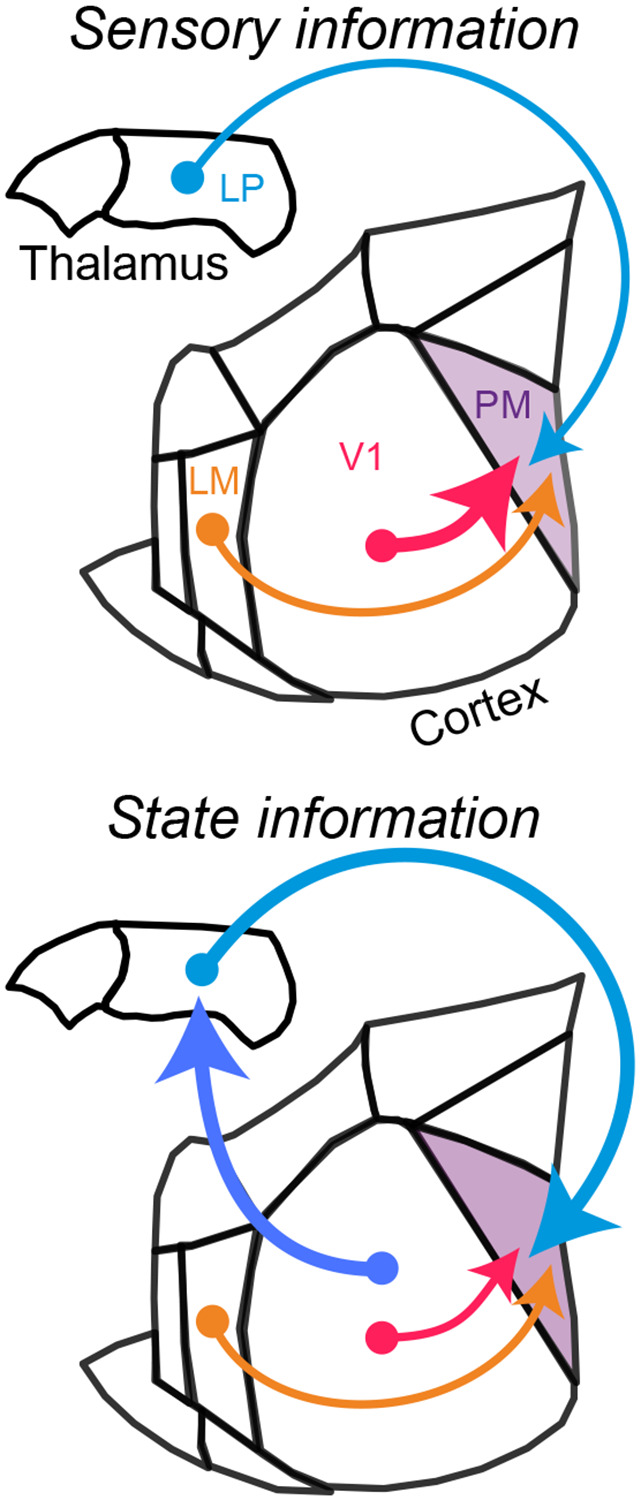
Communication among different neocortical areas is largely thought to be mediated by long-range synaptic interactions between cortical neurons, with the thalamus providing only an initial relay of information from the sensory periphery. Higher-order thalamic nuclei receive strong synaptic inputs from the cortex and send robust projections back to other cortical areas, providing a distinct and potentially critical route for cortico-cortical communication. However, the relative contributions of corticocortical and thalamocortical inputs to higher-order cortical function remain unclear. Using imaging of cortical neurons and projection axon terminals in combination with optogenetic manipulations, we find that the higher-order visual thalamus of mice conveys a specialized stream of information to higher-order visual cortex. Whereas corticocortical projections from lower cortical areas convey robust visual information, higher-order thalamocortical projections convey strong behavioral state information. Together, these findings suggest a key role for higher-order thalamus in providing contextual signals that flexibly modulate sensory processing in higher-order cortex.


Figures

Figure 1.
Figure 1.. Long-range corticocortical and higher-order thalamocortical projections to mouse higher-order visual area PM.
A. Schematic of pathways originating from the higher-order visual thalamus (lateral posterior nucleus, LP) and multiple visual cortical regions that project to the higher-order posterior medial (PM) visual cortex. B. Coronal sections containing thalamocortical and corticocortical projection neurons retro-labeled via injection of CAV2-Cre in PM of tdTomato reporter (Ai9) mice. Cells labeled by tdTomato send projections to PM (dLGN: dorsal lateral geniculate nucleus, RL: rostral lateral visual cortex, AL: anterior lateral visual cortex, LM: lateral medial visual cortex). Scale bar = 500 μm. C. Quantification of overall cell density for thalamocortical and corticocortical projection neurons sending axons to PM. Dotted lines connect values from individual Ai9 animals (N = 10 mice). D. Quantification of cell counts (normalized to the histological section with the highest cell count in each animal) along the anterior-posterior axis of the brain (relative to bregma) for each thalamocortical and corticocortical projection neuron type. Numbered arrows correspond to panels B1-B4 (N = 10 mice). E. Thalamocortical (LP→PM) and corticocortical (V1→PM, LM→PM) projection axons in PM labeled with GCaMP6s via AAV injection in the corresponding presynaptic regions. Scale bar = 50 μm. F. Laminar distribution of axonal fluorescence intensity for each projection type (N = 4 mice per projection type). G. Upper: Schematic of in vivo imaging set-up. Lower: Image from video monitoring of the mouse’s facial motion and pupil size. H. Fluorescence traces of Ca2+ activity from individual cell body (PM) and axon (V1→PM, LM→PM, LP→PM) ROIs, simultaneous with behavioral state monitoring (locomotion speed, facial motion, pupil size) and presentation of visual stimuli. Error bars denote s.e.m.
Figure 2.
Figure 2.. Visual responses of thalamocortical and corticocortical inputs converging in PM.
A. Upper: ROIs of each cell type that were significantly responsive (darker colors) or non-responsive (lighter colors) to visual stimuli varying in orientation. Lower: Visual response magnitude distributions to stimuli varying in orientation for all ROIs of each cell type. (V1→PM: N = 8 animals, n = 172 ROIs; LM→PM: N = 9 animals, n = 364 ROIs; LP→PM: N = 9 animals, n = 268 ROIs; PM: N = 9 animals, n = 579 ROIs) (PM max. val. = 18.0, not shown for visualization purposes). B. As in A for stimuli varying in spatial frequency/temporal frequency/speed tuning. (V1→PM: N = 10 animals, n = 183 ROIs; LM→PM: N = 9 animals, n = 348 ROIs; LP→PM: N = 10 animals, n = 303 ROIs; PM: N = 13 animals, n = 781 ROIs) (LM→PM min./max. val. = −8.2/20.6). C. As in A but for stimuli varying in size. (V1→PM: N = 5 animals, n = 69 ROIs; LM→PM: N = 8 animals, n = 291 ROIs; LP→PM: N = 8 animals, n = 181 ROIs; PM: N = 6 animals, n = 228 ROIs) (LM→PM max. val. = 12.4; PM max. val. = 17.3). D. As in A but for stimuli varying in motion coherence (V1→PM: N = 7 animals, n = 200 ROIs; LM→PM: N = 7 animals, n = 301 ROIs; LP→PM: N = 10 animals, n = 376 ROIs; PM: N = 13 animals, n = 807 ROIs) (LP→PM min. val. = −30.1; PM max. val. = 12.7). *p<0.05, **p<0.01, ***p<0.001, semi-weighted t-test, Benjamini-Hochberg correction for false discovery rate.
Figure 3.
Figure 3.. Behavioral state-dependent modulation of thalamocortical and corticocortical inputs to PM.
A. Example Ca2+ signal from an LP axon terminating in PM (cyan). Lower traces (black) show locomotion speed, facial motion (motion energy of the whisker pad), and pupil size (AU, arbitrary units). Periods of sustained low or high motor activity (locomotion or facial motion) are indicated by shaded areas and transition points from low to high motor activity are indicated by green lines. Analyses of modulation by facial motion and pupil dilation/constriction were limited to sustained periods without locomotion. Open blue boxes indicate high facial motion periods not included in the analysis of state transitions due to overlap with locomotion. B. Neuronal activity (Z-scored DF/F) aligned to locomotion onset (green dotted line) and offset (red dotted line). Baseline activity (10-15 s after locomotion offset during sustained quiescent periods) is shown to the right for comparison. C. Locomotion modulation indices for ROIs of each cell type (V1→PM: N = 11 animals, n = 291 ROIs; LM→PM: N = 9 animals, n = 343 ROIs; LP→PM: N = 10 animals, n = 266 ROIs; PM: N = 8 animals, n = 622 ROIs). D. Cross-correlation between neuronal activity (ΔFF) and facial motion. Facial motion is the reference signal in the cross-correlation. E. Neuronal activity (Z-scored ΔFF) aligned to the onset of high facial motion. F. Peak correlation values between neuronal activity and facial motion for each cell type (V1→PM: N = 4 animals, n = 107 ROIs; LM→PM: N = 4 animals, n = 176 ROIs; LP→PM: N = 6 animals, n = 165 ROIs; PM: N = 5 animals, n = 454 ROIs). G. Cross-correlation between neuronal activity (ΔFF) and pupil size. H. Neuronal activity (Z-scored ΔFF) aligned to one pupil dilation-constriction cycle (derived from the Hilbert transform of the pupil signal). I. Peak correlation values between neuronal activity and pupil size for each cell type (V1→PM: N = 4 animals, n = 108 ROIs; LM→PM: N = 8 animals, n = 284 ROIs; LP→PM: N = 6 animals, n = 162 ROIs; PM: N = 5 animals, n = 353 ROIs). *p<0.05, **p<0.01, ***p<0.001, semi-weighted t-test, Benjamini-Hochberg correction for false discovery rate. Error bars denote s.e.m.
Figure 4.
Figure 4.. Distinct functional interactions between thalamocortical and corticocortical afferents and PM cells.
A. Schematic of method for simultaneously monitoring the neuronal activity of PM cell bodies and long-range projection axons terminating in PM, based on expression of GCaMP6s in long-range axon terminals and ribo-GCaMP6m in PM cell bodies. B. In vivo field of view with PM cell bodies expressing riboGCaMP6m and LM axon terminals expressing GCaMP6s. C. Fluorescence traces of Ca2+ activity simultaneously recorded in PM cell bodies expressing riboGCaMP6m and projection axons expressing GCaMP6s. D. Mean Ca2+ event rates among the different cell types. (V1→PM: N = 5 animals, n = 332 ROIs; LM→PM: N = 4 animals, n = 211 ROIs; LP→PM: N = 5 animals, n = 191 ROIs; PM: N = 14 animals, n = 168 ROIs). E. Ca2+ event rates for each afferent population aligned to simultaneously recorded Ca2+ events in PM neurons (raw data minus data from shuffled PM event times). F. Peak Ca2+ event rates aligned to PM neuron Ca2+ events. (V1→PM: N = 5 animals, n = 59 PM ROIs; LM→PM: N = 4 animals, n = 53 PM ROIs; LP→PM: N = 5 animals, n = 56 PM ROIs; PM activity aligned with PM events: N = 14 animals, n = 168 PM ROIs). *p<0.05, **p<0.01, ***p<0.001, semi-weighted t-test, Benjamini-Hochberg correction for false discovery rate. Error bars denote s.e.m.
Figure 5.
Figure 5.. Distinct contributions of corticocortical and thalamocortical pathways to PM activity.
A. Schematic of viral injections for co-expressing GCaMP6s in PM cortical neurons and the Cre-dependent inhibitory opsin eOPN3 in presynaptic projection axon terminals. B. Left: Expression of eOPN3-mScarlet (red) in thalamocortical neurons in LP. Right: Expression of GCaMP6s in PM cortical neurons (green) and eOPN3-mScarlet (red) in the surrounding LP thalamocortical terminals. Scale bar = 30 μm. C. Visual contrast-response curves of PM neurons in control animals and animals with eOPN3 expressed in corticocortical and higher-order thalamocortical axons for session with (LED) and without (Dark) optogenetic stimulation. D. Scatter plots showing visual response magnitudes from individual PM neurons identified during both Dark and LED imaging sessions. E. As in C but for cross-correlations between PM neuronal activity and pupil size. F. As in D but for peak correlation values between neuronal activity and pupil size. G. Differences between visual response magnitudes during sessions with and without optogenetic stimulation. (Control: N = 5 animals, n = 195 ROIs; V1→PM eOPN3: N = 7 animals, n = 227 ROIs; LM→PM eOPN3: N = 4 animals, n = 215 ROIs; LP→PM eOPN3: N = 6 animals, n = 327 ROIs) (Control min./max. val. = −3.2/2.5; V1→PM eOPN3 min./max. val. = −5.3/3.1; LM→PM eOPN3 min./max. val. = −3.1/5.0; LP→PM eOPN3 min./max. val. = −3.1/1.0). H. As in G but for differences in peak ΔFF-pupil correlation values between sessions with and without optogenetic stimulation. (Control: N = 7 animals, n = 327 ROIs; V1→PM eOPN3: N = 4 animals, n = 169 ROIs; LM→PM eOPN3: N = 3 animals, n = 167 ROIs; LP→PM eOPN3: N = 5 animals, n = 468 ROIs). *p<0.05, **p<0.01, ***p<0.001, semi-weighted t-test, Benjamini-Hochberg correction for false discovery rate. Error bars denote s.e.m.
Figure 6.
Figure 6.. Corticocortical and thalamocortical pathways provide distinct streams of information to higher-order cortex.
Upper: Corticocortical pathways, particularly the direct input from V1, carry strong sensory information to higher-order visual cortex (PM), whereas higher-order thalamocortical inputs from LP carry comparatively weak sensory signals. Lower: Corticocortical pathways carry relatively little behavioral state information, whereas higher-order thalamocortical inputs from LP convey strong behavioral state-related signals that reflect their presynaptic corticothalamic inputs from V1.

Similar articles

References

    1. Aarts E, Verhage M, Veenvliet JV, Dolan CV, van der Sluis S (2014) A solution to dependency: using multilevel analysis to accommodate nested data. Nat. Neurosci. 17: 491–496. - PubMed
    1. Andermann ML, Kerlin AM, Roumis DK, Glickfeld LL, Reid RC (2011) Functional specialization of mouse higher visual cortical areas. Neuron. 72:1025–1039. - PMC - PubMed
    1. Bayer L, Serafin M, Eggermann E, Saint-Mleux B, Machard D, Jones BE, Mühlethaler M (2004) Exclusive postsynaptic action of hypocretin-orexin on sublayer 6b cortical neurons. J. Neurosci. 24: 6760–6764. - PMC - PubMed
    1. Beaulieu-Laroche L, Toloza EHS, Brown NJ, Harnett MT (2019) Widespread and highly correlated somato-dendritic activity in cortical layer 5 neurons. Neuron 103: 235–241. - PMC - PubMed
    1. Beltramo R, Scanziani M (2019) A collicular visual cortex: neocortical space for an ancient midbrain visual structure. Science 363: 64–69. - PubMed

Publication types