

This is a preprint.
The impact of common variants on gene expression in the human brain: from RNA to protein to schizophrenia risk
- PMID: 37873195
- PMCID: PMC10592607
- DOI: 10.1101/2023.06.04.543603
The impact of common variants on gene expression in the human brain: from RNA to protein to schizophrenia risk
Abstract
Background: The impact of genetic variants on gene expression has been intensely studied at the transcription level, yielding in valuable insights into the association between genes and the risk of complex disorders, such as schizophrenia (SCZ). However, the downstream impact of these variants and the molecular mechanisms connecting transcription variation to disease risk are not well understood.
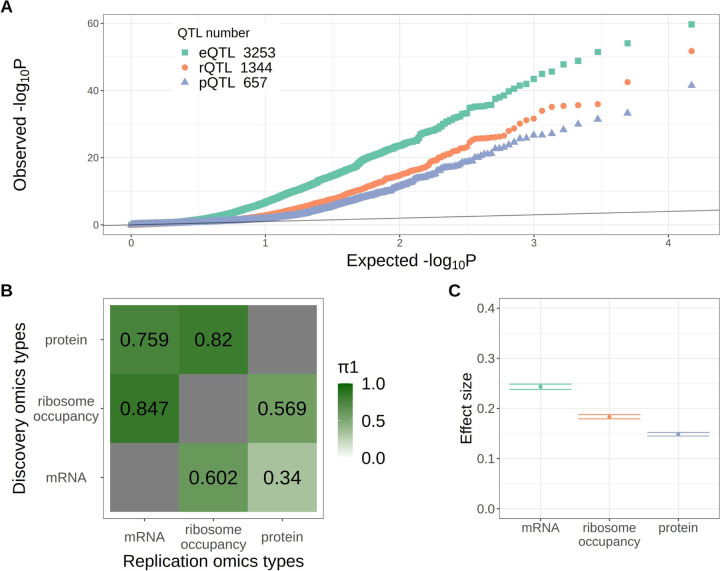
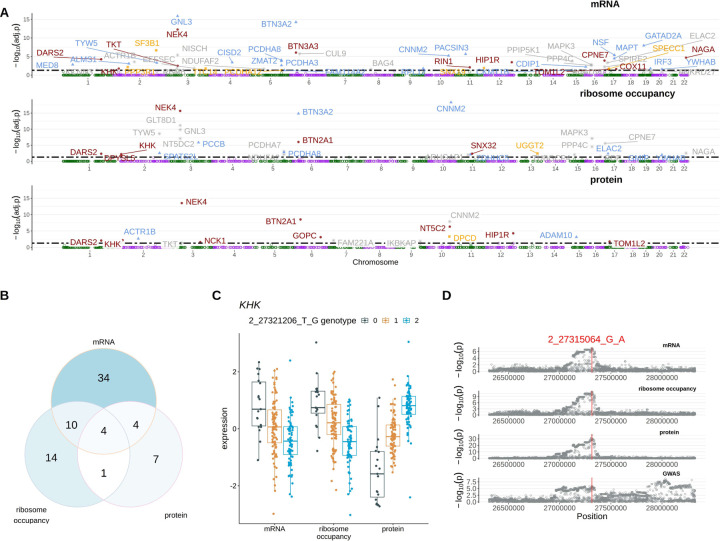
Results: We quantitated ribosome occupancy in prefrontal cortex samples of the BrainGVEX cohort. Together with transcriptomics and proteomics data from the same cohort, we performed cis-Quantitative Trait Locus (QTL) mapping and identified 3,253 expression QTLs (eQTLs), 1,344 ribosome occupancy QTLs (rQTLs), and 657 protein QTLs (pQTLs) out of 7,458 genes quantitated in all three omics types from 185 samples. Of the eQTLs identified, only 34% have their effects propagated to the protein level. Further analysis on the effect size of prefrontal cortex eQTLs identified from an independent dataset showed clear post-transcriptional attenuation of eQTL effects. To investigate the biological relevance of the attenuated eQTLs, we identified 70 expression-specific QTLs (esQTLs), 51 ribosome-occupancy-specific QTLs (rsQTLs), and 107 protein-specific QTLs (psQTLs). Five of these omics-specific QTLs showed strong colocalization with SCZ GWAS signals, three of them are esQTLs. The limited number of GWAS colocalization discoveries from omics-specific QTLs and the apparent prevalence of eQTL attenuation prompted us to take a complementary approach to investigate the functional relevance of attenuated eQTLs. Using S-PrediXcan we identified 74 SCZ risk genes, 34% of which were novel, and 67% of these risk genes were replicated in a MR-Egger test. Notably, 52 out of 74 risk genes were identified using eQTL data and 70% of these SCZ-risk-gene-driving eQTLs show little to no evidence of driving corresponding variations at the protein level.
Conclusion: The effect of eQTLs on gene expression in the prefrontal cortex is commonly attenuated post-transcriptionally. Many of the attenuated eQTLs still correlate with SCZ GWAS signal. Further investigation is needed to elucidate a mechanistic link between attenuated eQTLs and SCZ disease risk.
Conflict of interest statement
Competing interests: Authors declare that they have no competing interests.
Figures
Similar articles
-
Illuminating links between cis-regulators and trans-acting variants in the human prefrontal cortex.Genome Med. 2022 Nov 24;14(1):133. doi: 10.1186/s13073-022-01133-8. Genome Med. 2022. PMID: 36424644 Free PMC article.
-
Cross-ancestry analysis of brain QTLs enhances interpretation of schizophrenia genome-wide association studies.Am J Hum Genet. 2024 Nov 7;111(11):2444-2457. doi: 10.1016/j.ajhg.2024.09.001. Epub 2024 Oct 2. Am J Hum Genet. 2024. PMID: 39362218 Free PMC article.
-
Genomic variation. Impact of regulatory variation from RNA to protein.Science. 2015 Feb 6;347(6222):664-7. doi: 10.1126/science.1260793. Epub 2014 Dec 18. Science. 2015. PMID: 25657249 Free PMC article.
-
Multi-omics colocalization with genome-wide association studies reveals a context-specific genetic mechanism at a childhood onset asthma risk locus.Genome Med. 2021 Oct 10;13(1):157. doi: 10.1186/s13073-021-00967-y. Genome Med. 2021. PMID: 34629083 Free PMC article.
-
QTL Analysis Beyond eQTLs.Methods Mol Biol. 2020;2082:201-210. doi: 10.1007/978-1-0716-0026-9_14. Methods Mol Biol. 2020. PMID: 31849017 Review.
References
-
- Fialkowski A., Beasley T. M., Tiwari H. K., “[11 – Multifactorial Inheritance and Complex Diseases]” in Emery and Rimoin’s Principles and Practice of Medical Genetics and Genomics (Seventh Edition), Pyeritz R. E., Korf B. R., Grody W. W., Eds. (Academic Press, 2019), pp. 323–358.
-
- Heckman M. G., Labbé C., Kolicheski A. L., Soto-Beasley A. I., Walton R. L., Valentino R. R., Brennan E. R., Johnson P. W., Baheti S., Sarangi V., Ren Y., Uitti R. J., Wszolek Z. K., Ross O. A., Fine-mapping of the non-coding variation driving the Caucasian LRRK2 GWAS signal in Parkinson’s disease. Parkinsonism Relat. Disord. 83, 22–30 (2021). - PMC - PubMed
Publication types
Grants and funding
LinkOut - more resources
Full Text Sources