[Preprint]. 2023 Oct 14:2023.10.13.562302.
doi: 10.1101/2023.10.13.562302.

The fatty liver disease-causing protein PNPLA3-I148M alters lipid droplet-Golgi dynamics

Affiliations

The fatty liver disease-causing protein PNPLA3-I148M alters lipid droplet-Golgi dynamics

David J Sherman et al. bioRxiv. .

Update in

Abstract

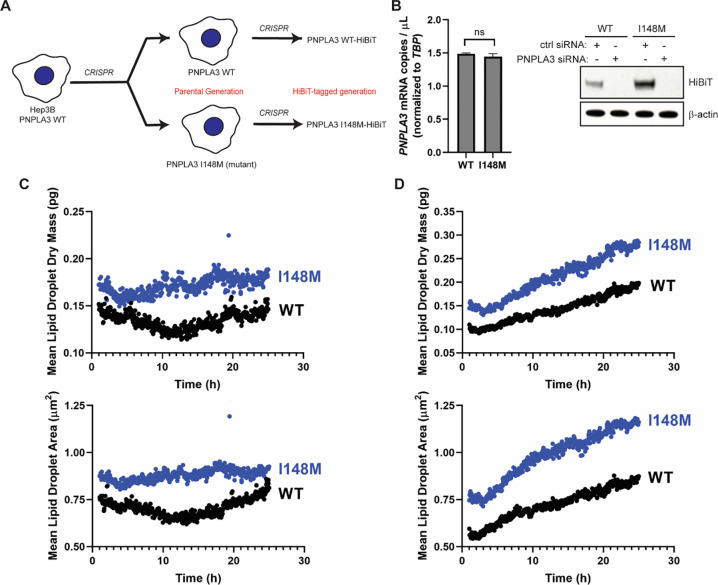
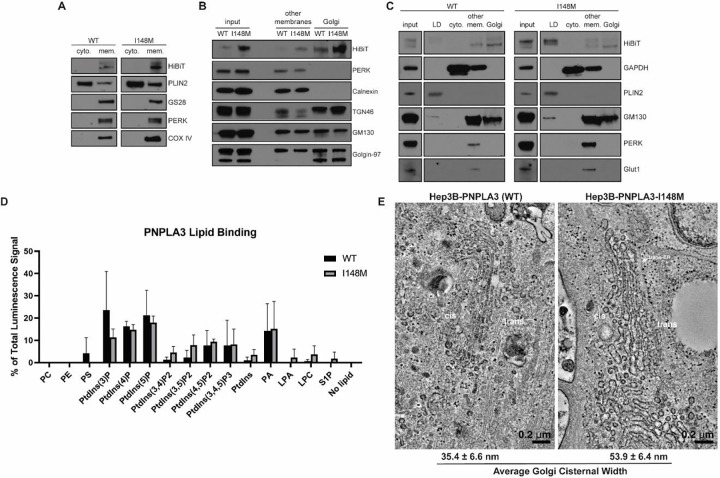
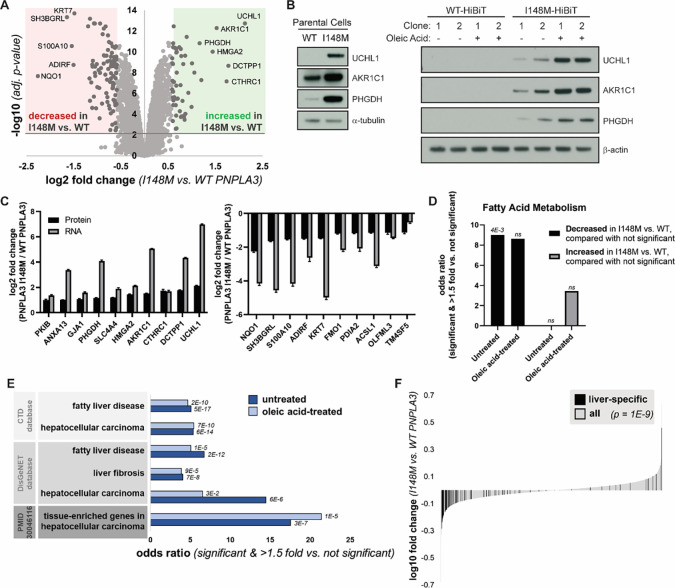
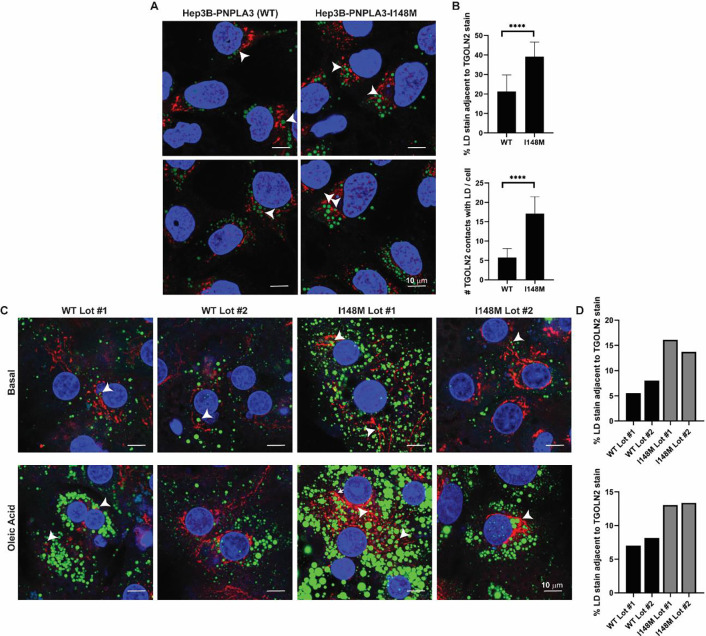
Non-alcoholic fatty liver disease (NAFLD), recently renamed metabolic dysfunction-associated steatotic liver disease (MASLD), is a progressive metabolic disorder that begins with aberrant triglyceride accumulation in the liver and can lead to cirrhosis and cancer. A common variant in the gene PNPLA3, encoding the protein PNPLA3-I148M, is the strongest known genetic risk factor for MASLD to date. Despite its discovery twenty years ago, the function of PNPLA3, and now the role of PNPLA3-I148M, remain unclear. In this study, we sought to dissect the biogenesis of PNPLA3 and PNPLA3-I148M and characterize changes induced by endogenous expression of the disease-causing variant. Contrary to bioinformatic predictions and prior studies with overexpressed proteins, we demonstrate here that PNPLA3 and PNPLA3-I148M are not endoplasmic reticulum-resident transmembrane proteins. To identify their intracellular associations, we generated a paired set of isogenic human hepatoma cells expressing PNPLA3 and PNPLA3-I148M at endogenous levels. Both proteins were enriched in lipid droplet, Golgi, and endosomal fractions. Purified PNPLA3 and PNPLA3-I148M proteins associated with phosphoinositides commonly found in these compartments. Despite a similar fractionation pattern as the wild-type variant, PNPLA3-I148M induced morphological changes in the Golgi apparatus, including increased lipid droplet-Golgi contact sites, which were also observed in I148M-expressing primary human patient hepatocytes. In addition to lipid droplet accumulation, PNPLA3-I148M expression caused significant proteomic and transcriptomic changes that resembled all stages of liver disease. Cumulatively, we validate an endogenous human cellular system for investigating PNPLA3-I148M biology and identify the Golgi apparatus as a central hub of PNPLA3-I148M-driven cellular change.


Conflict of interest statement

Competing Interest Statement: D.J.S., L.L., J.L.M., J.X., J.F., R.V., I.C.R., and R.J.D. are or were employees of Amgen Inc., although this study was conducted as postdoctoral research for D.J.S. and does not have direct financial implications for Amgen Inc. The authors declare no other competing interests.

Figures

Figure 1.
Figure 1.. Constitutive endogenous expression of PNPLA3-I148M increases the LD content of hepatoma cells.
(A) PNPLA3-I148M was introduced into Hep3B cells using CRISPR. Parental Hep3B cells (WT and I148M) were further modified to introduce a C-terminal HiBiT tag at the endogenous locus. (B) PNPLA3 expression in the parental cells (left) was analyzed by digital PCR (p = 0.0972, determined by Student’s t-test, n = 3). Protein expression (right) was analyzed by HiBiT detection in the tagged cell lines treated with a negative control siRNA or PNPLA3-specific siRNA. (C,D) Mean lipid droplet content (upper) and mean lipid droplet area (lower) were quantified from live-cell label-free imaging using the Nanolive 3D Cell Explorer microscope. Cells were treated with vehicle (C) or with 200 μM oleic acid (D). Images were taken every 3 min for 24 h, starting 1 h after addition of oleic acid. Quantification was done using Eve software.
Figure 2.
Figure 2.. PNPLA3-I148M induces structural changes at the Golgi apparatus.
(A) Basal-state Hep3B cells expressing endogenous PNPLA3 or PNPLA3-I148M were fractionated into cytosolic (“cyto.”) or total membrane (“mem.”) fractions. (B) Basal-state Hep3B cells were further fractionated to separate membrane species. “Other membranes” include non-Golgi membranes. (C) Hep3B cells were treated with 100 μM oleic acid for 16 h prior to fractionation into LD, cytosolic, “other membranes,” and Golgi membrane fractions. (D) Purified PNPLA3-His and PNPLA3-I148M-His were incubated with phosphoinositide strips containing spots with 100 pmol of different lipid species. Following washing and staining with anti-His-HRP, strips were imaged using chemiluminescence. Bar graph represents the average of three independent experiments. p-values indicated in Table S5. (E) Hep3B cells (WT or I148M) were treated with 100 μM oleic acid for 16 h, then fixed and imaged by transmission electron microscopy. Average cisternal widths were calculated from 20 Golgi cisternae per cell type.
Figure 3.
Figure 3.. PNPLA3-I148M causes proteomic changes consistent with liver disease.
(A) Volcano plot of proteins quantified by mass spectrometry in untreated cells expressing WT or PNPLA3-I148M. Red and green compartments contain proteins significantly (adj. p-value < 0.01) decreased or increased, respectively, by >1.5 fold in the I148M vs. WT cell lines. (B) Confirmation of top proteomic hit proteins in parental Hep3B cells and additional HiBiT clones, with and without incubation with 200 μM oleic acid overnight. (C) Log2 fold changes of top ten significantly upregulated (left) and significantly downregulated (right) proteins in untreated mass spectrometry, compared with gene expression from RNA-seq. (D) Enrichment of the biological process keyword in proteins significantly (adj. p-value < 0.01) decreased or increased by >1.5 fold in the I148M vs. WT PNPLA3 cell lines versus those not significantly changing. Fatty acid metabolism is the only term that is significant after multiple testing correction in at least one comparison. p-values indicated above the bars. (E) Proteins significantly (adj. p-value < 0.01) decreased or increased by >1.5 fold in the I148M vs. WT PNPLA3 cell lines were compared with those not significantly changed. Enrichment of liver disease-related terms was determined; adjusted p-value by Fisher’s exact test is shown. (F) Plot showing the log10 fold change for proteins quantified in the I148M vs. WT PNPLA3 untreated cell lines. Those reported (TiGER database) to be liver-specific genes are shown in black. Kolmogorov-Smirnov p-value testing for a difference in fold change distribution between the two protein sets is reported.
Figure 4.
Figure 4.. Hepatoma cells and primary hepatocytes expressing PNPLA3-I148M have more LD-Golgi contacts.
(A) Hep3B cells expressing endogenous PNPLA3 or PNPLA3-I148M were fixed and stained with LipidTOX Green to label LDs (green) and TGOLN2 (red) to label the trans-Golgi network. White arrowheads indicate examples of LD-TGOLN2 interactions. (B) Lipid droplet-TGOLN2 contact sites in ~ 45 cells per cell line were quantified using Imaris software. p-values were calculated from Student’s t-tests. (C) Individual lots of primary human hepatocytes expressing wild-type PNPLA3 or PNPLA3-I148M were plated, treated with vehicle or 200 μM oleic acid for 24 h, fixed and stained with LipidTOX Green to label LDs (green) and anti-TGOLN2 (red) to label the trans-Golgi network. White arrowheads indicate examples of LD-TGOLN2 interactions. (E) 20–40 cells of each lot and condition were quantified and LD-TGOLN2 proximity was calculated using Imaris software. Percentage of LD stain juxtaposed to TGOLN2 stain for untreated cells (top) and oleic acid-treated cells (bottom) per primary hepatocyte lot. WT (black) and I148M (gray) lots are indicated. Each bar represents the average of 11 fields of view for each primary hepatocyte lot per condition. **** p < 0.0001.

Similar articles

References

    1. Younossi Z. M. et al., Epidemiology of chronic liver diseases in the USA in the past three decades. Gut 69, 564–568 (2020). - PubMed
    1. Powell E. E., Wong V. W., Rinella M., Non-alcoholic fatty liver disease. Lancet 397, 2212–2224 (2021). - PubMed
    1. Romeo S. et al., Genetic variation in PNPLA3 confers susceptibility to nonalcoholic fatty liver disease. Nat Genet 40, 1461–1465 (2008). - PMC - PubMed
    1. Sookoian S., Pirola C. J., Meta-analysis of the influence of I148M variant of patatin-like phospholipase domain containing 3 gene (PNPLA3) on the susceptibility and histological severity of nonalcoholic fatty liver disease. Hepatology 53, 1883–1894 (2011). - PubMed
    1. Dai G., Liu P., Li X., Zhou X., He S., Association between PNPLA3 rs738409 polymorphism and nonalcoholic fatty liver disease (NAFLD) susceptibility and severity: A meta-analysis. Medicine (Baltimore) 98, e14324 (2019). - PMC - PubMed

Publication types