[Preprint]. 2023 Oct 2:2023.09.30.560314.
doi: 10.1101/2023.09.30.560314.

ATF7IP2/MCAF2 directs H3K9 methylation and meiotic gene regulation in the male germline

Affiliations

ATF7IP2/MCAF2 directs H3K9 methylation and meiotic gene regulation in the male germline

Kris G Alavattam et al. bioRxiv. .

Update in

Abstract

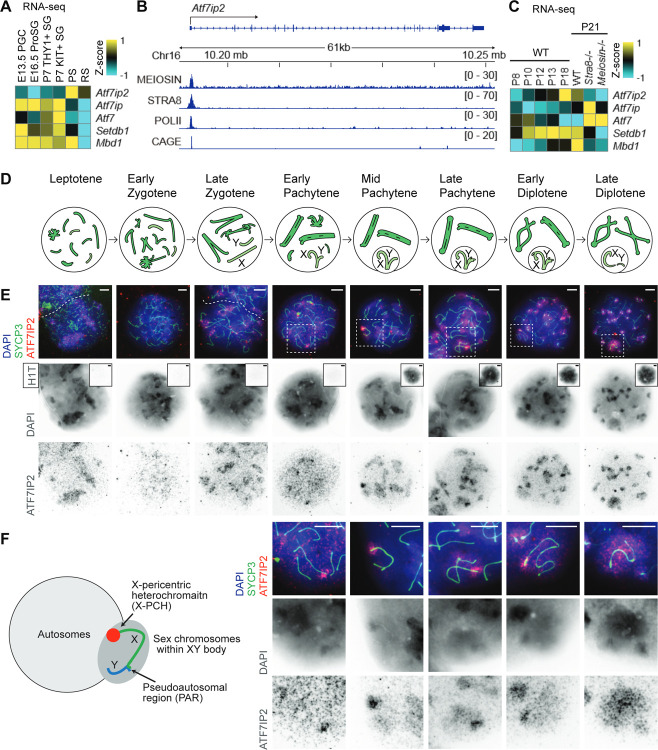
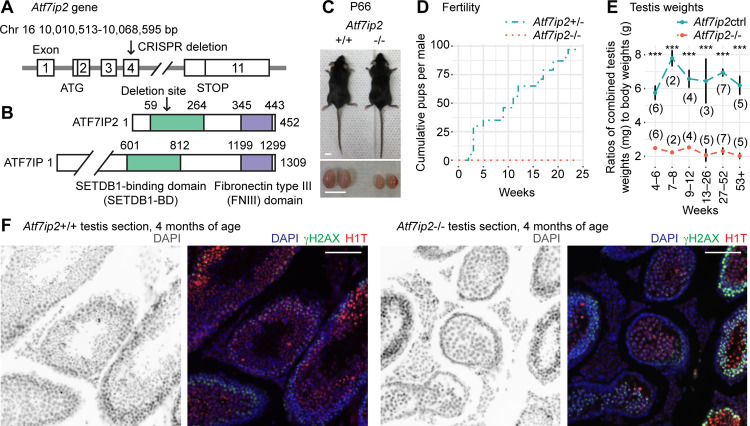
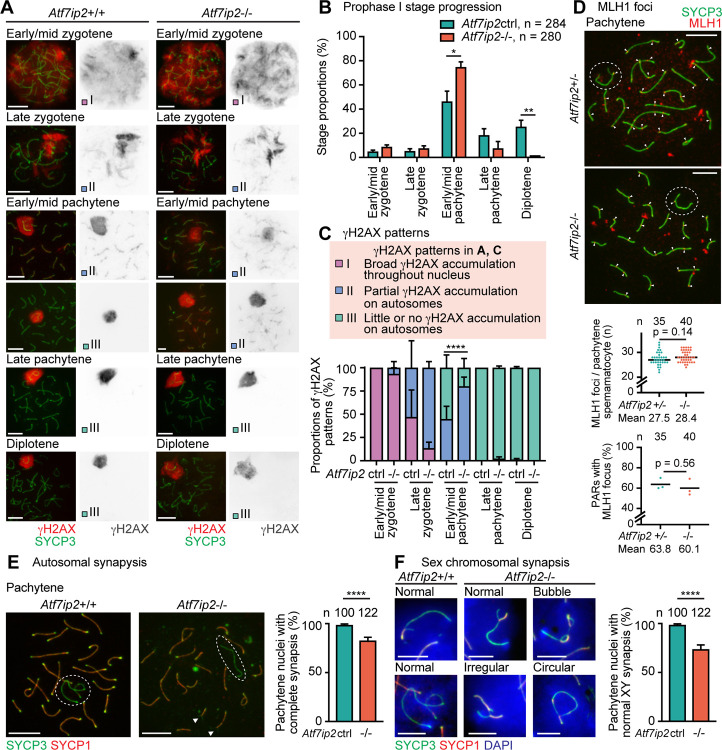
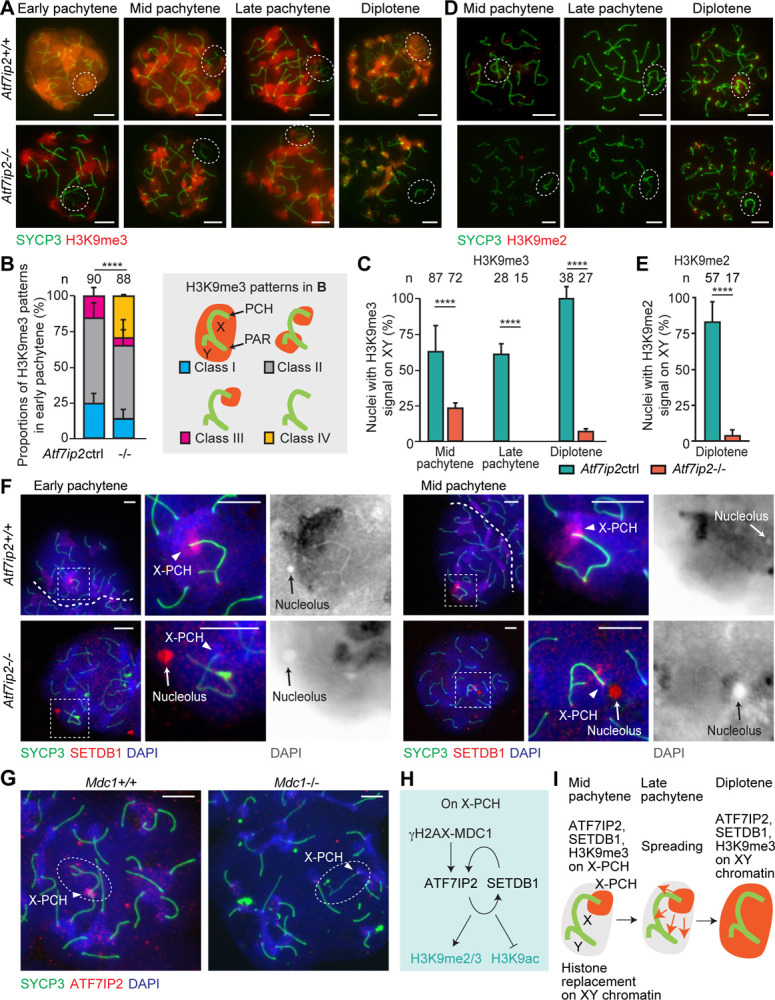
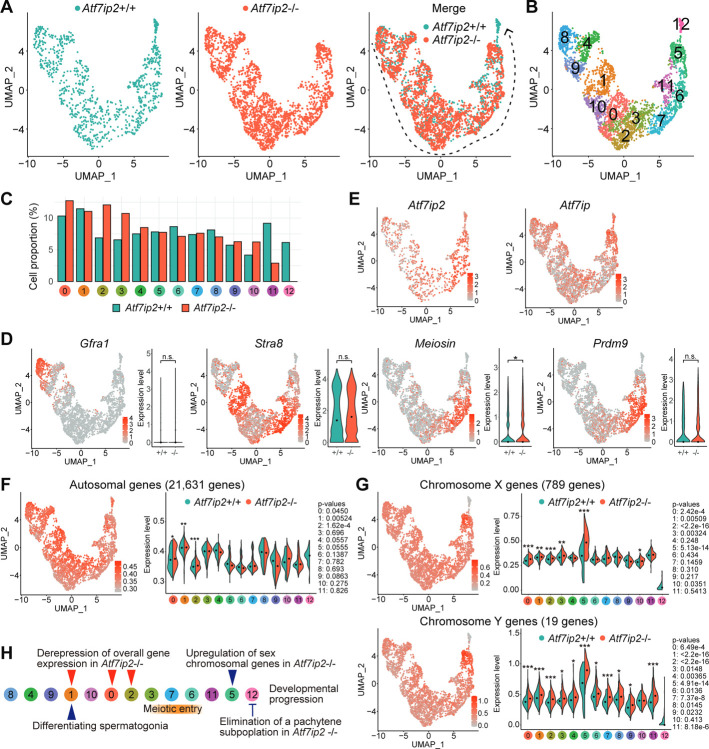
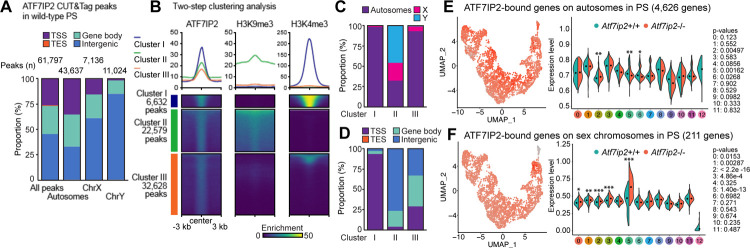
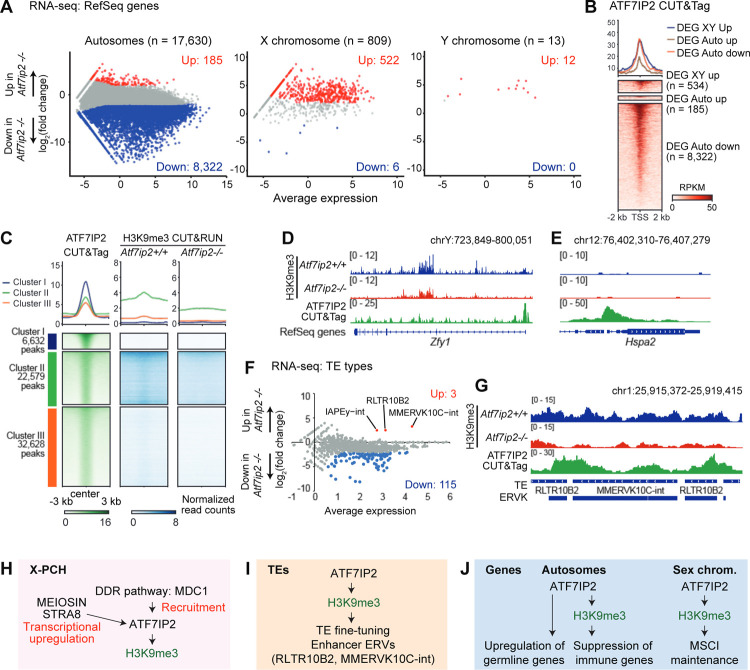
H3K9 tri-methylation (H3K9me3) plays emerging roles in gene regulation, beyond its accumulation on pericentric constitutive heterochromatin. It remains a mystery why and how H3K9me3 undergoes dynamic regulation in male meiosis. Here, we identify a novel, critical regulator of H3K9 methylation and spermatogenic heterochromatin organization: the germline-specific protein ATF7IP2 (MCAF2). We show that, in male meiosis, ATF7IP2 amasses on autosomal and X pericentric heterochromatin, spreads through the entirety of the sex chromosomes, and accumulates on thousands of autosomal promoters and retrotransposon loci. On the sex chromosomes, which undergo meiotic sex chromosome inactivation (MSCI), the DNA damage response pathway recruits ATF7IP2 to X pericentric heterochromatin, where it facilitates the recruitment of SETDB1, a histone methyltransferase that catalyzes H3K9me3. In the absence of ATF7IP2, male germ cells are arrested in meiotic prophase I. Analyses of ATF7IP2-deficient meiosis reveal the protein's essential roles in the maintenance of MSCI, suppression of retrotransposons, and global upregulation of autosomal genes. We propose that ATF7IP2 is a downstream effector of the DDR pathway in meiosis that coordinates the organization of heterochromatin and gene regulation through the spatial regulation of SETDB1-mediated H3K9me3 deposition.

Keywords: ATF7IP2/MCAF2; Constitutive Heterochromatin; Gene activation; H3K9me3; Meiosis; Meiotic Sex Chromosome Inactivation.


Figures

Figure 1.
Figure 1.. ATF7IP2 is highly expressed in male meiosis and accumulates on heterochromatin.
(A, C) Heatmaps showing bulk RNA-seq gene expression levels across a male-germline time course for Atf7ip2 and related genes. PGC: Primordial germ cells, ProSG: prospermatogonia, SG: spermatogonia, PS: pachytene spermatocytes, RS: round spermatids. Original data are from (Seisenberger et al. 2012; Hasegawa et al. 2015; Maezawa et al. 2018b) for (A) and (Ishiguro et al. 2020) for (C) (B) Track views for MEIOSIN (preleptotene-enriched testes), STRA8 (preleptotene-enriched testes), and RNA polymerase II (POLII; postnatal day (P) 10.5 testes) ChIP-seq data, and CAGE (P10.5 testes). Numbers in brackets: ranges of normalized coverage. (D) Schematic: chromosome behavior in meiotic prophase I of male Mus musculus. Darker green: autosomes; lighter green: sex chromosomes. (E) Meiotic chromosome spreads stained with DAPI and antibodies raised against ATF7IP2, SYCP3, and H1T; spreads represent stages of meiotic prophase I. Insets: H1T immunostaining; H1T is a nuclear marker that appears in mid pachytene nuclei and persists into haploid spermatids. SYCP3 is a marker of meiotic chromosome axes. Dashed squares are magnified in panel F. Scale bars: 5 μm. (F) Schematic: sex chromosome configuration in male meiosis. Right: magnified images of sex chromosomes from panel E. Scale bars: 5 μm.
Figure 2.
Figure 2.. ATF7IP2 is required for male fertility.
(A) Schematic: mouse Atf7ip2 gene and the location of the CRISPR-mediated deletion. (B) Schematic: mouse ATF7IP2 and ATF7IP proteins, and their functional domains. (C) Atf7ip2+/+ and Atf7ip2−/− males, and their testes, at postnatal day 66 (P66). Scale bars: 10 mm. (D) Cumulative numbers of pups sired with Atf7ip2+/− and Atf7ip2−/− males. (E) Testis weights for Atf7ip2−/− males and littermate controls (Atf7ip2 ctrl: Atf7ip2+/+ and Atf7ip2+/−). Numbers of independent mice analyzed are shown in parentheses. P-values are from pairwise t-tests adjusted with Benjamini-Hochberg post-hoc tests: *** < 0.001. Data are presented as mean ± SEM. (F) Testis sections from Atf7ip2+/+ and Atf7ip2−/− mice at 4 months of age stained with DAPI and antibodies raised against ATF7IP2, γH2AX (a marker of the DNA damage response), and H1T (a marker of germ cells in mid pachytene and subsequent stages). Scale bars: 100 μm.
Figure 3.
Figure 3.. DDR and chromosome synapsis are mildly impaired in Atf7ip2−/− spermatocytes.
(A) Atf7ip2+/+ and Atf7ip2−/− spermatocyte chromosome spreads stained with antibodies raised against SYCP3 and γH2AX. γH2AX accumulation patterns are one of three classifications described in panel C. Scale bars: 10 μm. (B) Meiotic prophase I stage populations quantified as mean ± SEM for three independent littermate pairs. Numbers of analyzed nuclei are indicated. Data are from five independent littermate pairs at P44, P56, P66, P66, and P69. P-values are from unpaired two-tailed t-tests: * < 0.05, ** < 0.01. (C) Stage-wise proportions of γH2AX accumulation patterns for three independent littermate pairs. Patterns are classified with three criteria (see top). P-values are from Fisher’s exact tests: **** < 0.0001. (D) Chromosome spreads stained with antibodies raised against SYCP3 and MLH1. Arrowheads indicate MLH1 foci. Dot plot (top): distributions of MLH1 counts from three independent littermate pairs. Dot plot (bottom): proportions of MLH1 focus-associated XY pseudoautosomal regions (PARs) from three independent littermate pairs. Numbers of analyzed nuclei are indicated. Data are from three independent littermate pairs at P108, P115, P122. Bars represent means. P-values are from unpaired t-tests. (E, F) Chromosome spreads stained with antibodies raised against SYCP3 (a marker of all chromosome axes) and SYCP1 (a marker of only synapsed axes). Scale bars: 10 μm (E), 5 μm (F). Bar plots: proportions of pachytene nuclei with normal synapsis of autosomes (E) and sex chromosomes (F). Data are from four independent littermate pairs at P44, P66, P66, and P69, and presented as mean ± SEM. P-values are from unpaired t-tests: * < 0.05, ** < 0.01.
Figure 4:
Figure 4:. ATF7IP2 is required for H3K9 methylation on the sex chromosomes during male meiosis.
(A) Atf7ip2+/+ and Atf7ip2−/− spermatocyte chromosome spreads stained with antibodies raised against H3K9me3 and SYCP3 (a marker of chromosome axes, both synapsed and unsynapsed). Dashed circles indicate the sex chromosomes. Scale bars: 10 μm. (B) H3K9me3 accumulation patterns on the sex chromosomes of Atf7ip2+/+ and Atf7ip2−/− early pachytene spermatocytes. Patterns are classified with four criteria (see right). Three independent experiments. P-values are from Fisher’s exact tests: **** < 0.0001. Scale bars: 10 μm. (C) Quantification of mid pachytene, late pachytene, and diplotene spermatocytes with H3K9me3 signals on the sex chromosomes. Three independent experiments. P-values are from Fisher’s exact tests: * < 0.05, *** < 0.001, **** < 0.0001. (D) Chromosome spreads stained with antibodies raised against H3K9me2 and SYCP3. (E) Quantification of diplotene spermatocytes with H3K9me2 signals on the sex chromosomes. Three independent experiments. P-values are from Fisher’s exact tests, **** < 0.0001. (F) Chromosome spreads stained with antibodies raised against SETDB1 and SYCP3. Dashed squares are magnified in the panels to the right. Scale bars: 10 μm. (G) Mdc1+/+ and Mdc1−/− spermatocyte chromosome spreads stained with antibodies raised against ATF7IP2 and SYCP3. Scale bars: 10 μm. (H) Summary of the γH2AX/MDC1-ATF7IP2-SETDB1 pathway on X-PCH. (I) Schematic: establishment of H3K9me3 on the sex chromosomes in normal mid pachytene-to-diplotene spermatocytes.
Figure 5.
Figure 5.. scRNA-seq analyses of Atf7ip2+/+ and Atf7ip2−/− spermatogenic germ cells
(A) UMAP representations of scRNA-seq transcriptome profiles for germ cells from Atf7ip2+/+ testes (left: P15), Atf7ip2−/− testes (middle: P15), and both Atf7ip2+/+ and Atf7ip2−/− testes (right). Gray arrow: inferred developmental trajectory. (B) Clustering of UMAP-projected scRNA-seq transcriptome profiles for Atf7ip2+/+ and Atf7ip2/ germ cells based on gene expression patterns. (C) Bar graph showing the proportions of Atf7ip2+/+ and Atf7ip2−/− germ cells among the clusters. (D) UMAP representations showing expression patterns for key developmental marker genes in spermatogenic cells. Genes include Gfra1, which represent undifferentiated spermatogonia; Stra8, differentiating spermatogonia; Meiosin, preleptotene spermatocytes; and Prdm9, early meiotic prophase spermatocytes. P-values are from Wilcoxon rank sum tests: n.s., not significant; * < 0.05. (E) Expression patterns for Atf7ip2 and Atf7ip upon the UMAP. (F) Expression levels for autosomal genes. P-values are from Wilcoxon rank sum tests: * < 0.05, ** < 0.01, *** < 0.001. (G) Expression levels for X chromosomal genes (top) and Y chromosomal genes (bottom). P-values are from Wilcoxon rank sum tests: * < 0.05, ** < 0.01, *** < 0.001. (H) Summary of Atf7ip2−/− phenotypes in spermatogenic germ cells. Subtype clusters are ordered by inferred developmental progression. Key cell types and events in Atf7ip2+/+ and Atf7ip2−/− spermatogenesis are shown.
Figure 6.
Figure 6.. ATF7IP2-binding sites in pachytene spermatocytes.
(A) Numbers and genomic distribution of ATF7IP2 CUT&Tag peaks in wild-type pachytene spermatocytes. (B) Two-step clustering analysis of ATF7IP2 CUT&Tag peaks and H3K9me3 and H3K4me3 enriched-regions. Average tag density profiles (top) and heatmaps for each cluster (bottom). (C) Chromosomal distribution of ATF7IP2 peak clusters. (D) Genomic distribution of ATF7IP2 peak clusters. (E) Expression levels of ATF7IP2-bound autosomal genes in scRNA-seq. P-values are from Wilcoxon rank sum tests: * < 0.05, ** < 0.01. (F) Expression levels for ATF7IP2-bound sex chromosomal genes in scRNA-seq. P-values are from Wilcoxon rank sum tests: * < 0.05, ** < 0.01, *** < 0.001
Figure 7.
Figure 7.. ATF7IP2 directs meiotic gene regulation and regulates TEs.
(A) Comparison of Atf7ip2+/+ and Atf7ip2−/− pachytene spermatocyte transcriptomes. Autosomal, X, and Y genes were analyzed separately. Two independent biological replicates were examined. All genes with adjusted p-values (Benjamini-Hochberg method) are plotted. Differentially expressed genes (DEGs: log2 fold change ≥ 2, adjusted p-value ≤ 0.05) are colored (red: upregulated in Atf7ip2−/− testes; blue: downregulated in Atf7ip2−/− testes), and numbers are shown. (B) ATF7IP2 CUT&Tag enrichment at DEG TSSs ± 2 kb in pachytene spermatocytes isolated from Atf7ip2−/− mice. Average tag density profiles (top) and heatmaps for each cluster (bottom). (C) ATF7IP2 CUT&Tag and H3K9me3 CUT&RUN enrichment in Clusters I–III (defined in Fig. 6B). Average tag density profiles (top) and heatmaps for each cluster (bottom). (D, E) Track views of the Zfy1 locus (an upregulated Y-linked locus) and the Hspa2 locus (a downregulated autosomal locus). (F) Comparison of Atf7ip2+/+ and Atf7ip2−/− pachytene spermatocyte transposable element (TE) expression. All TE types are plotted. Differentially expressed TE types (DEGs: log2 fold change > 2, adjusted p-value < 0.05) are colored (red: upregulated in Atf7ip2−/−; blue: downregulated in Atf7ip2−/−), and numbers are shown. (G) Track view of the ATF7IP2-targeted TEs RLTR10B2 and MMERVK10C-int. (H) Summary and model of the function of ATF7IP2 on X-PCH. (I) Summary and model of the function of ATF7IP2 in TE regulation. (J) Summary and model of the function of ATF7IP2 in gene expression regulation.

References

    1. Abe H, Alavattam KG, Kato Y, Castrillon DH, Pang Q, Andreassen PR, Namekawa SH. 2018. CHEK1 coordinates DNA damage signaling and meiotic progression in the male germline of mice. Hum Mol Genet 27: 1136–1149. - PMC - PubMed
    1. Abe H, Yeh YH, Munakata Y, Ishiguro KI, Andreassen PR, Namekawa SH. 2022. Active DNA damage response signaling initiates and maintains meiotic sex chromosome inactivation. Nat Commun 13: 7212. - PMC - PubMed
    1. Alavattam KG, Abe H, Sakashita A, Namekawa SH. 2018. Chromosome Spread Analyses of Meiotic Sex Chromosome Inactivation. Methods Mol Biol 1861: 113–129. - PMC - PubMed
    1. Alavattam KG, Kato Y, Sin HS, Maezawa S, Kowalski IJ, Zhang F, Pang Q, Andreassen PR, Namekawa SH. 2016. Elucidation of the Fanconi Anemia Protein Network in Meiosis and Its Function in the Regulation of Histone Modifications. Cell Rep 17: 1141–1157. - PMC - PubMed
    1. Alavattam KG, Maezawa S, Andreassen PR, Namekawa SH. 2021. Meiotic sex chromosome inactivation and the XY body: a phase separation hypothesis. Cell Mol Life Sci 79: 18. - PMC - PubMed

Publication types