

This is a preprint.
Type 1 Diabetes Risk Phenotypes Using Cluster Analysis
- PMID: 37873281
- PMCID: PMC10593014
- DOI: 10.1101/2023.10.10.23296375
Type 1 Diabetes Risk Phenotypes Using Cluster Analysis
Update in
-
Identification of type 1 diabetes risk phenotypes using an outcome-guided clustering analysis.Diabetologia. 2024 Nov;67(11):2507-2517. doi: 10.1007/s00125-024-06246-w. Epub 2024 Aug 6. Diabetologia. 2024. PMID: 39103721 Free PMC article.
Abstract
Background: Although statistical models for predicting type 1 diabetes risk have been developed, approaches that reveal clinically meaningful clusters in the at-risk population and allow for non-linear relationships between predictors are lacking. We aimed to identify and characterize clusters of islet autoantibody-positive individuals that share similar characteristics and type 1 diabetes risk.
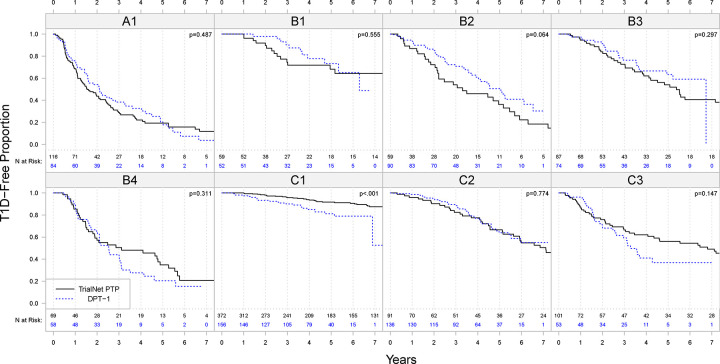
Methods: We tested a novel outcome-guided clustering method in initially non-diabetic autoantibody-positive relatives of individuals with type 1 diabetes, using the TrialNet Pathway to Prevention (PTP) study data (n=1127). The outcome of the analysis was time to type 1 diabetes and variables in the model included demographics, genetics, metabolic factors and islet autoantibodies. An independent dataset (Diabetes Prevention Trial of Type 1 Diabetes, DPT-1 study) (n=704) was used for validation.
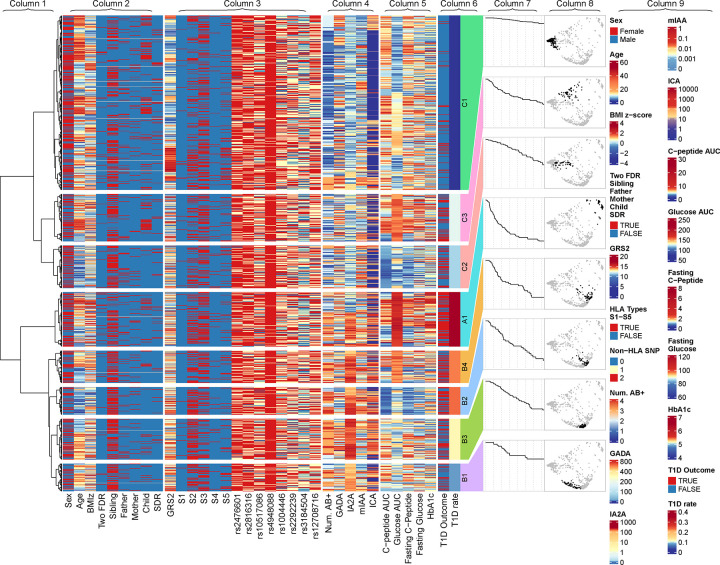
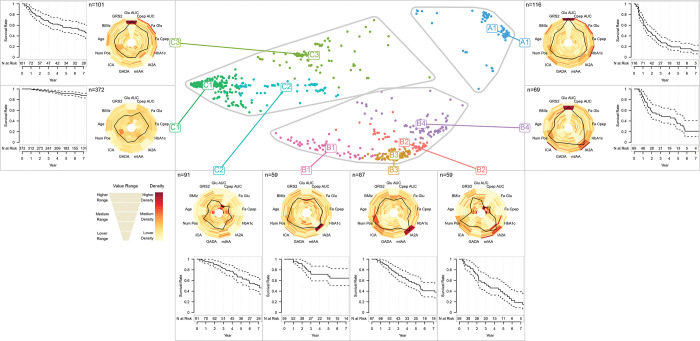
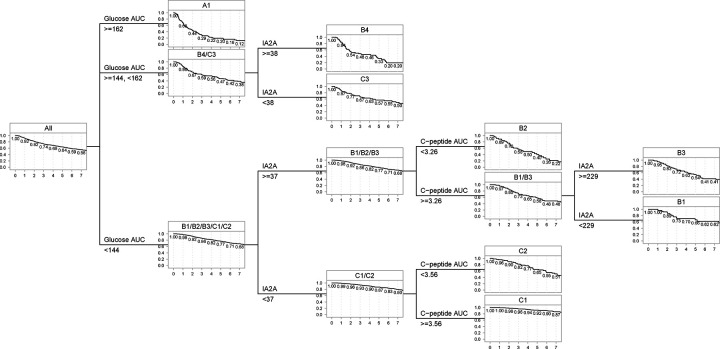
Findings: The analysis revealed 8 clusters with varying type 1 diabetes risks, categorized into three groups. Group A had three clusters with high glucose levels and high risk. Group B included four clusters with elevated autoantibody titers. Group C had three lower-risk clusters with lower autoantibody titers and glucose levels. Within the groups, the clusters exhibit variations in characteristics such as glucose levels, C-peptide levels, age, and genetic risk. A decision rule for assigning individuals to clusters was developed. The validation dataset confirms that the clusters can identify individuals with similar characteristics.
Interpretation: Demographic, metabolic, immunological, and genetic markers can be used to identify clusters of distinctive characteristics and different risks of progression to type 1 diabetes among autoantibody-positive individuals with a family history of type 1 diabetes. The results also revealed the heterogeneity in the population and complex interactions between variables.
Figures
References
Publication types
Grants and funding
- U01 DK085476/DK/NIDDK NIH HHS/United States
- U01 DK061010/DK/NIDDK NIH HHS/United States
- R01 DK121843/DK/NIDDK NIH HHS/United States
- U01 DK103282/DK/NIDDK NIH HHS/United States
- UC4 DK106993/DK/NIDDK NIH HHS/United States
- U01 DK061042/DK/NIDDK NIH HHS/United States
- U01 DK085509/DK/NIDDK NIH HHS/United States
- UC4 DK117009/DK/NIDDK NIH HHS/United States
- U01 DK085466/DK/NIDDK NIH HHS/United States
- U01 DK103153/DK/NIDDK NIH HHS/United States
- U01 DK061058/DK/NIDDK NIH HHS/United States
- U01 DK106984/DK/NIDDK NIH HHS/United States
- U01 DK085499/DK/NIDDK NIH HHS/United States
- U01 DK107013/DK/NIDDK NIH HHS/United States
- U01 DK103266/DK/NIDDK NIH HHS/United States
- U01 DK107014/DK/NIDDK NIH HHS/United States
- U01 DK106994/DK/NIDDK NIH HHS/United States
- U01 DK061034/DK/NIDDK NIH HHS/United States
- U01 DK085461/DK/NIDDK NIH HHS/United States
- U01 DK103180/DK/NIDDK NIH HHS/United States
- U01 DK085465/DK/NIDDK NIH HHS/United States
LinkOut - more resources
Full Text Sources