[Preprint]. 2023 Oct 9:2023.09.24.559205.
doi: 10.1101/2023.09.24.559205.

A developmentally defined population of neurons in the lateral septum controls responses to aversive stimuli

Affiliations

A developmentally defined population of neurons in the lateral septum controls responses to aversive stimuli

Miguel Turrero García et al. bioRxiv. .

Abstract

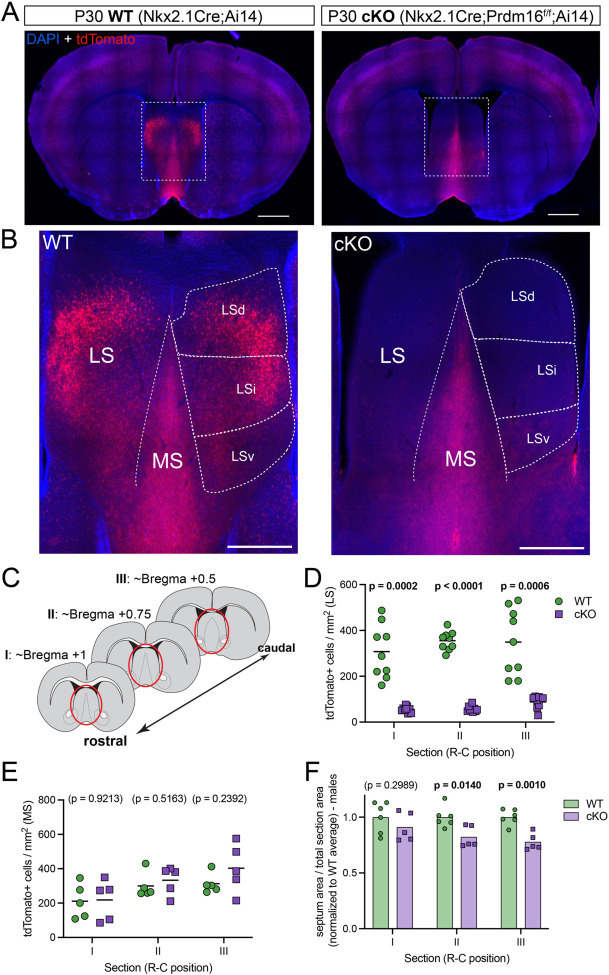
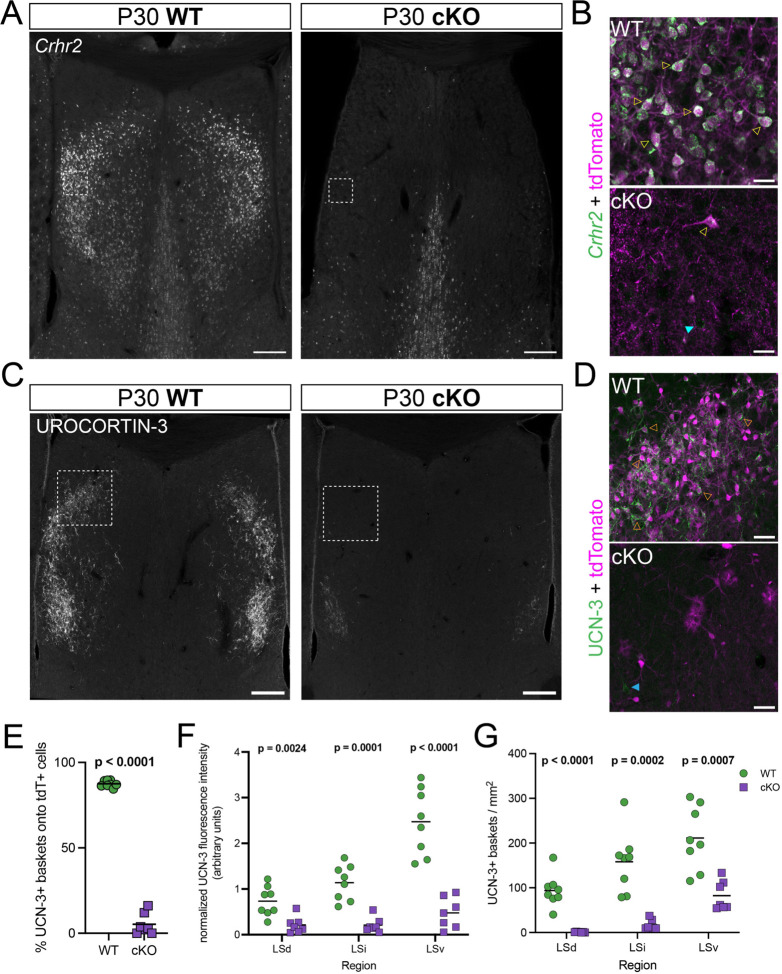
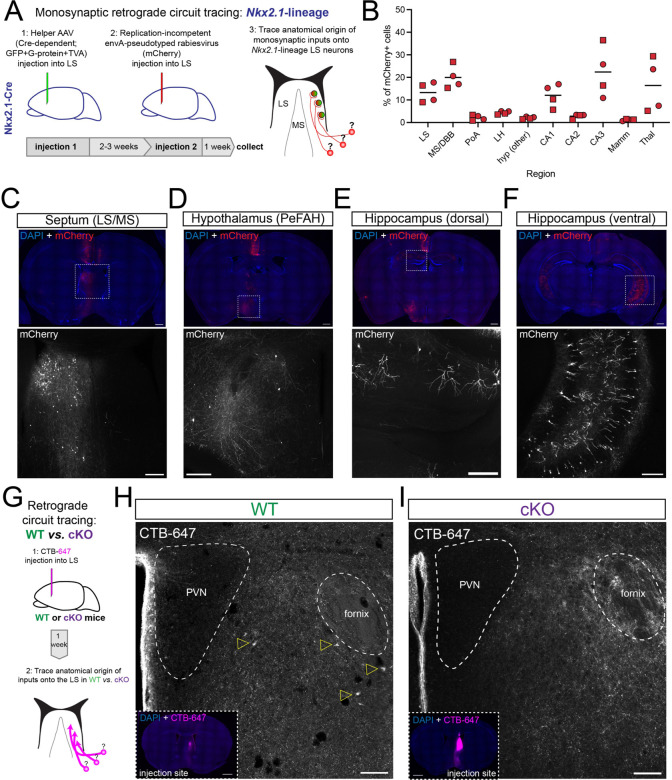
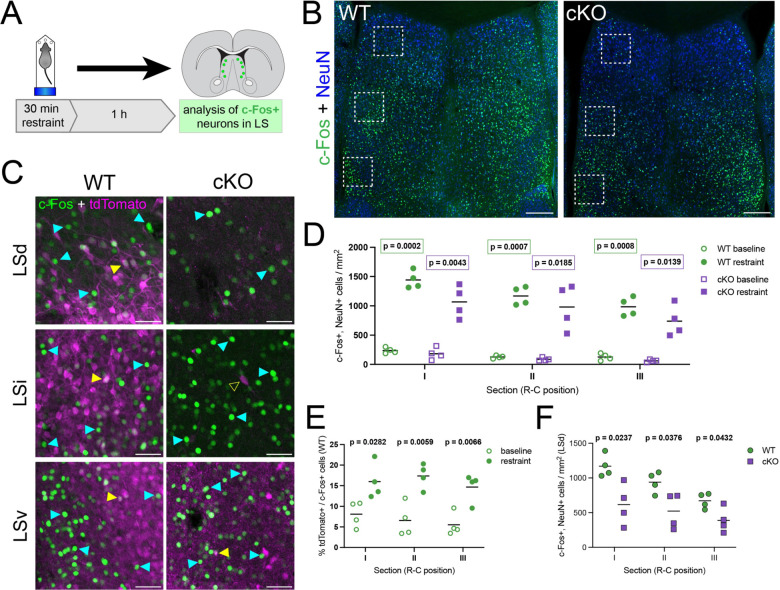
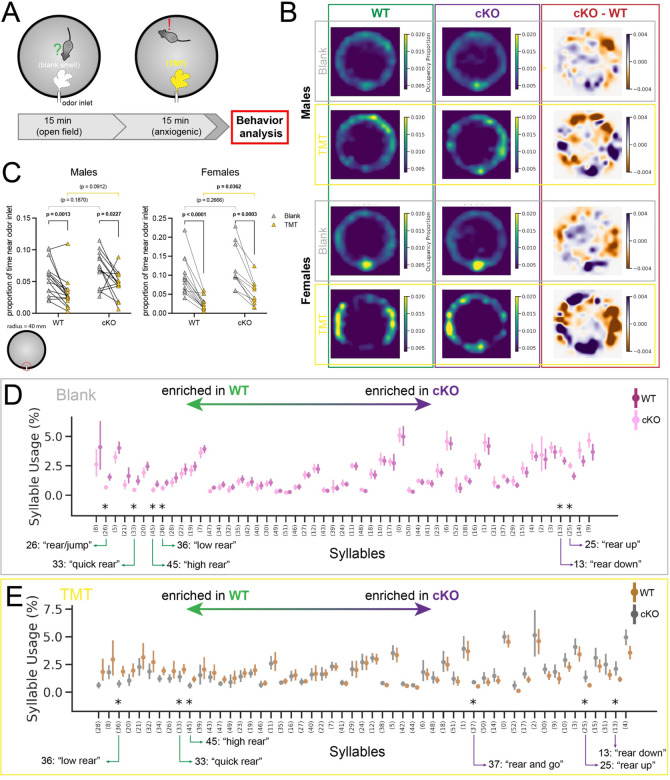
When interacting with their environment, animals must balance exploratory and defensive behavior to evaluate and respond to potential threats. The lateral septum (LS) is a structure in the ventral forebrain that calibrates the magnitude of behavioral responses to stress-related external stimuli, including the regulation of threat avoidance. The complex connectivity between the LS and other parts of the brain, together with its largely unexplored neuronal diversity, makes it difficult to understand how defined LS circuits control specific behaviors. Here, we describe a mouse model in which a population of neurons with a common developmental origin (Nkx2.1-lineage neurons) are absent from the LS. Using a combination of circuit tracing and behavioral analyses, we found that these neurons receive inputs from the perifornical area of the anterior hypothalamus (PeFAH) and are specifically activated in stressful contexts. Mice lacking Nkx2.1-lineage LS neurons display increased exploratory behavior even under stressful conditions. Our study extends the current knowledge about how defined neuronal populations within the LS can evaluate contextual information to select appropriate behavioral responses. This is a necessary step towards understanding the crucial role that the LS plays in neuropsychiatric conditions where defensive behavior is dysregulated, such as anxiety and aggression disorders.


Figures

Figure 1:
Figure 1:. A genetic model to ablate Nkx2.1-lineage neurons in the lateral septum.
A) Coronal sections through the forebrain of postnatal day 30 (P30) control (labeled as ‘WT’; Nkx2.1-Cre;Ai14, left) and mutant (labeled as ‘cKO’; Nkx2.1-Cre;Prdm16flox/flox;Ai14, right) mice, where cells derived from Nkx2.1-expressing progenitors are labeled by the fluorescent reporter tdTomato (red). Nuclei are counterstained with DAPI (blue). Scale bars, 1 mm. B) Closeup of the septum of WT (left) and cKO (right) samples, as highlighted by white dashed line boxes in A. The main anatomical divisions of the mature septum are indicated by white dashed lines: medial septum (MS), lateral septum (LS), and dorsal (LSd), intermediate (LSi) and ventral (LSv) nuclei within the LS. Scale bar, 500 μm. C) Cartoon representing forebrain coronal sections at the three rostrocaudal positions used in subsequent analyses, and labeled as sections ‘I’, ‘II’ and ‘III’ throughout the article. The septal area is highlighted by red ellipses. D) Quantification of the density of cells positive for tdTomato per mm2 in the lateral septum of WT (green circles, n = 9) and cKO (purple squares, n = 9) mice. E) Quantification of the density of cells positive for tdTomato per mm2 in the medial septum of WT (green circles, n = 5) and cKO (purple squares, n = 5) mice. F) Quantification of the area of the septum relative to the total area of its corresponding coronal brain section in WT (green circles, n = 6) and cKO (purple squares, n = 5) male mice. Measurements are normalized to the corresponding WT average. Unpaired t-tests with Welch’s correction were performed; the p-values are shown above the corresponding compared sets of data: bold typeface indicates statistically significant (p<0.05) differences.
Figure 2:
Figure 2:. The absence of Crhr2-expressing neurons in cKO mice impairs the innervation of the lateral septum by Urocortin-3 axons.
A) Overview coronal images of the septum of P30 WT (left) and cKO (right) mice submitted to in situ hybridization for Crhr2 (gray). Scale bars, 250 μm. B) Closeup view of the white dashed line boxes in A, showing the Crhr2 signal (green) combined with immunofluorescence staining for tdTomato (magenta), in the LS of WT (top) and cKO (bottom) mice. Empty yellow arrowheads indicate examples of cells positive for both Crhr2 and tdTomato, while the cyan arrowhead highlights an example of a Crhr2+, tdTomato– cell. Scale bars, 50 μm. C) Overview coronal images of the septum of P30 WT (left) and cKO (right) mice submitted to immunofluorescence staining for urocortin-3 (gray). Scale bars, 250 μm. D) Closeup view of the white dashed line boxes in C, showing the urocortin-3 signal (UCN-3, green) combined with tdTomato (magenta), in the LS of WT (top) and cKO (bottom) mice. Empty orange arrowheads indicate examples of tdTomato+ cells surrounded by urocortin-3 perineuronal baskets, while the blue arrowhead shows a basket formed around a tdTomato– cell. Scale bars, 50 μm. E) Quantification of the proportion (in %) of urocortin-3 perineuronal baskets surrounding tdTomato+ cells in the LS of WT (green circles, n = 8) and cKO (purple squares, n = 7) mice at P30. F) Quantification of fluorescence intensity in the different LS subnuclei of P30 WT (green circles) and cKO (purple squares) brains where urocortin-3 was detected by immunofluorescence staining. G) Quantification of the density of urocortin-3 baskets per mm2 in the different LS subnuclei of P30 WT (green circles) and cKO (purple squares) mice. Unpaired t-tests with Welch’s correction were performed; the p-values are shown above the corresponding compared sets of data: bold typeface indicates statistically significant (p<0.05) differences. E, F and G correspond to quantifications at the rostrocaudal level defined as section II in Figure 1C.
Figure 3:
Figure 3:. Disrupted PeFAH to lateral septum connectivity in cKO mice.
A) Cartoon illustrating the experimental approach for retrograde monosynaptic circuit tracing from Nkx2.1-lineage neurons in the lateral septum. B) Graph summarizing the distribution of retrogradely labeled cells (represented as % of total mCherry+ cells) in the 10 main sources of synaptic inputs onto LS Nkx2.1-lineage cells. Squares represent male mice (n = 2), and circles female mice (n = 2). LS: lateral septum; MS/DBB: medial septum/diagonal band of Broca; PoA: preoptic area; LH: lateral hypothalamus; hyp: hypothalamus; CA1/2/3: Cornus Ammonis 1/2/3 regions of the hippocampus; Mamm: mammillary region; Thal: thalamus. C-F) Example images of retrogradely labeled neurons in different areas of the brain of an Nkx2.1-Cre mouse subjected to retrograde monosynaptic circuit tracing. The top panels show overview images stained for mCherry (red; expressed by neurons synapsing onto Nkx2.1-lineage cells in the LS) and counterstained with DAPI (blue); bottom panels show a closeup view of the areas highlighted by white dashed boxes in the overviews, displaying the mCherry channel (gray). The regions highlighted are: C) septum (lateral and medial); D) hypothalamus (PeFAH, perifornical area of the anterior hypothalamus); E) CA1 area in the rostro-dorsal hippocampus; F) CA1/CA3 area in the caudo-ventral hippocampus. Scale bars, 500 μm (overviews), 250 μm (closeups). G) Cartoon illustrating the experimental approach for retrograde circuit tracing in WT and cKO mice. CTB-647, cholera toxin beta subunit conjugated to Alexa-647 fluorophore. H) Representative image of the PeFAH of a WT mouse subjected to retrograde circuit tracing. Empty yellow arrowheads indicate the cell bodies of neurons labeled with CTB-647 injected into the LS (inset: injection site). PVN, periventricular nucleus of the hypothalamus. I) Representative image of the PeFAH of a cKO mouse subjected to retrograde circuit tracing (inset: injection site). Note the absence of CTB-647-labeled cell bodies. PVN, periventricular nucleus of the hypothalamus. Scale bars for H and I, 100 μm (main images), 500 μm (insets).
Figure 4:
Figure 4:. Nkx2.1-lineage neurons in the LSd are activated by an acute stressful stimulus.
A) Experimental design: mice were subjected to 30 minutes of forced restraint and sacrificed 1 hour later; neurons firing in response to the anxiogenic stimulus were identified by immunofluorescence staining for c-Fos. Scale bars, 250 μm. B) Examples of coronal sections of the septum of WT (left) and cKO (right) mice after the forced restraint experiment, immunostained for c-Fos (green) and NeuN (blue). C) Closeup view of the white dashed line boxes in B, showing c-Fos (green) and tdTomato (magenta), in the different subnuclei within the LS of WT (left) and cKO (right) mice. Yellow arrowheads indicate examples of cells positive for both c-Fos and tdTomato; cyan arrowheads highlight c-Fos+, tdTomato– cells, and the empty yellow arrowhead shows an example of a c-Fos–, tdTomato+ cell. Scale bars, 50 μm. D) Comparison of the density of c-Fos+ neurons in the LS of untreated controls (‘baseline’, empty symbols; n = 4 WT, green circles; n = 4 cKO, purple squares) and animals subjected to forced restraint (‘restraint’, full symbols; n = 4 WT, green circles; n = 4 cKO, purple squares). E) Proportion of tdTomato+ neurons within the c-Fos+ population in the LS of WT mice, comparing untreated controls (‘baseline’, empty circles, n = 4) and animals subjected to forced restraint (‘restraint’, full circles, n = 4). F) Comparison of the density of c-Fos+ neurons in the LSd of WT (green circles, n = 4) and cKO (purple squares, n = 4) animals subjected to forced restraint. Unpaired t-tests with Welch’s correction were performed; the p-values are shown above the corresponding compared sets of data: bold typeface indicates statistically significant (p<0.05) differences.
Figure 5:
Figure 5:. cKO mice display increased exploratory drive.
A) Experimental design: mice were placed in a cylindrical arena with a single odor inlet near the bottom, and exposed to two consecutive phases, where either a neutral (Blank) or an aversive (TMT) smell was pumped into the arena. B) Occupancy plots showing the average proportion of experiment time spent in each location throughout the arena by WT (n = 15 males, 13 females) or cKO (n = 14 males, 10 females) mice, under blank odor (“Blank”) or anxiogenic (“TMT”) conditions, as well as the difference between both plots (“cKO-WT”), separated by sex (top, males; bottom, females). C) Plot displaying the average occupancy of the area around the odor inlet (within a 40 mm radius) during Blank (gray triangles) and TMT (golden triangles) conditions, separated by sex and genotype. Each line joins the occupancy values of an individual mouse. Bars indicate the average. Note the same range in the y-axis of males and females. Paired t-tests (Blank vs. TMT) and unpaired t-tests (WT vs. cKO) were performed; the p-values are shown above the corresponding compared sets of data: bold typeface indicates statistically significant (p<0.05) differences. D) MoSeq-generated syllable usage in female mice during the Blank portion of the experiment, with syllables most enriched in cKO mice to the left, and in WT to the right. E) Syllable usage in female mice during the TMT portion of the experiment, with syllables most enriched in cKO mice to the left, and in WT to the right. Data points in D and E represent the average ± 95% confidence interval of the proportion (in %) of test time spent using the corresponding syllable. Significantly different syllable usage (indicated by asterisks) was determined using a Kruskal-Wallis test, post-hoc Dunn’s two-sided test with permutation, and multiple comparisons correction using the Benjamini-Hochberg procedure with a false discovery rate of 0.05.

Similar articles

References

    1. Sheehan T.P., Chambers R.A., and Russell D.S. (2004). Regulation of affect by the lateral septum: implications for neuropsychiatry. Brain research. Brain research reviews 46, 71–117. 10.1016/j.brainresrev.2004.04.009. - DOI - PubMed
    1. Besnard A., and Leroy F. (2022). Top-down regulation of motivated behaviors via lateral septum sub-circuits. Mol Psychiatry. 10.1038/s41380-022-01599-3. - DOI - PMC - PubMed
    1. Wirtshafter H.S., and Wilson M.A. (2021). Lateral septum as a nexus for mood, motivation, and movement. Neurosci Biobehav Rev 126, 544–559. 10.1016/j.neubiorev.2021.03.029. - DOI - PubMed
    1. Menon R., Suss T., Oliveira V.E.M., Neumann I.D., and Bludau A. (2022). Neurobiology of the lateral septum: regulation of social behavior. Trends Neurosci 45, 27–40. 10.1016/j.tins.2021.10.010. - DOI - PubMed
    1. Risold P.Y., and Swanson L.W. (1997). Connections of the rat lateral septal complex. Brain Res Brain Res Rev 24, 115–195. 10.1016/s0165-0173(97)00009-x. - DOI - PubMed

Publication types