[Preprint]. 2023 Oct 3:2023.10.02.23296067.
doi: 10.1101/2023.10.02.23296067.

The neuronal chromatin landscape in adult schizophrenia brains is linked to early fetal development

Affiliations

The neuronal chromatin landscape in adult schizophrenia brains is linked to early fetal development

Kiran Girdhar et al. medRxiv. .

Abstract

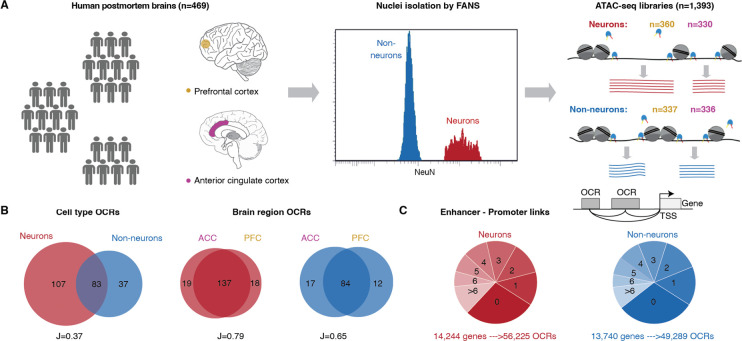
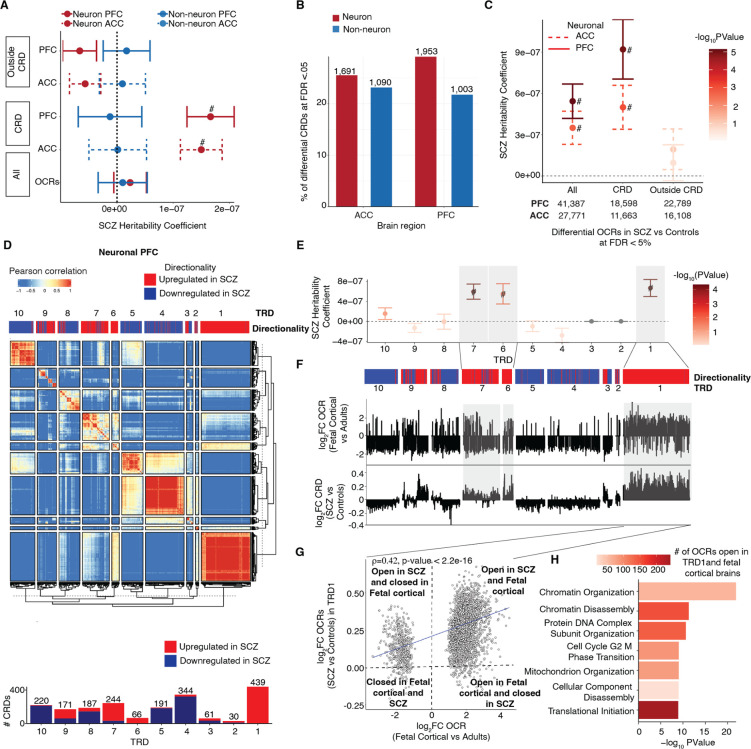
Non-coding variants increase risk of neuropsychiatric disease. However, our understanding of the cell-type specific role of the non-coding genome in disease is incomplete. We performed population scale (N=1,393) chromatin accessibility profiling of neurons and non-neurons from two neocortical brain regions: the anterior cingulate cortex and dorsolateral prefrontal cortex. Across both regions, we observed notable differences in neuronal chromatin accessibility between schizophrenia cases and controls. A per-sample disease pseudotime was positively associated with genetic liability for schizophrenia. Organizing chromatin into cis- and trans-regulatory domains, identified a prominent neuronal trans-regulatory domain (TRD1) active in immature glutamatergic neurons during fetal development. Polygenic risk score analysis using genetic variants within chromatin accessibility of TRD1 successfully predicted susceptibility to schizophrenia in the Million Veteran Program cohort. Overall, we present the most extensive resource to date of chromatin accessibility in the human cortex, yielding insights into the cell-type specific etiology of schizophrenia.


Conflict of interest statement

Competing interests: The authors declare no competing financial interests.

Figures

Figure 1:
Figure 1:. Population-scale chromatin accessibility analysis in the human brain.
A) Brain tissue specimens were obtained from 469 unique donors, comprising individuals with schizophrenia (SCZ) (n=157), BD (n=77) and controls (n=235). Neuronal and non-neuronal nuclei were isolated by FANS and ATAC-seq profiling was performed to generate a total of 1,393 libraries. B) Venn diagram showing cell-type (left) and brain region (right) specificity of identified OCRs. C) Top: Schematic to show enhancer-promoter links. Grey box, light grey box and black arrow represent OCRs, TSS and gene body, respectively. Bottom: the distribution in pie charts show stratification of 19,749 genes annotated to the number of neuronal (shades of red) and non-neuronal (shades of blue) OCRs.
Figure 2:
Figure 2:. Schizophrenia OCRs and inferred schizophrenia stages in PFC neurons.
A) Count of schizophrenia OCRs at FDR < .05 using differential analysis of schizophrenia vs controls for PFC and ACC in neurons and non-neurons. B) Heatmap of enrichment P values of neuropsychiatric and non-neuropsychiatric related GWAS traits. The overlap of OCRs with genetic variants was assessed using LD score regression. ‘#’: significant for enrichment in LD score regression after FDR correction of multiple testing across all tests in the plot (Benjamini–Hochberg test); ‘*’: nominally significant for enrichment. The heritability coefficients of common risk variants that overlap with (1) “Up+Down”: upregulated and downregulated schizophrenia OCRs (41,387(27,771) in PFC(ACC) neurons (red), 8,671(9,405) in PFC(ACC) non-neurons (blue)) (2) “Up”: upregulated schizophrenia OCRs (25,146(15,791) in PFC(ACC) in neurons (red), 3,726(3,075) in PFC(ACC) non-neurons (blue)); and (3) “Down”: dysregulated schizophrenia OCRs (16,241(11,980) in PFC(ACC) neurons (red), 4,945(6,330) in PFC(ACC) non-neurons (blue)). All upregulated (Up) and downregulated (Down) OCRs are with log2FC (schizophrenia versus controls) >0 and <0, respectively. C) Stratification of neuronal PFC samples by clinical diagnosis as a function of inferred disease stage, where early stage (n=1) to late stage (n=6) is from left to right. D) Plot of PRS of neuronal PFC samples calculated using Psychiatric Genomics Consortium (PGC3) schizophrenia GWAS summary statistics, stratified by inferred disease severity stages in neurons from PFC region. Beta estimate and p value are obtained using linear regression model: disease stages ~ PRS + Age + Age2 + Sex. Box plots have lower and upper hinges at the 25th and 75th percentiles and whiskers extending to, at most, 1.5xIQR (interquartile range).
Figure 3:
Figure 3:. Cis-regulatory landscape and trans regulatory domains from hierarchical clustering of neuronal schizophrenia CRDs from the PFC.
A) Schizophrenia heritability coefficients for neurons (red) and for non-neurons (blue) stratified by (1) “All”: all OCRs (neuronal = 391,420 and non-neuronal =260,431), (2) “CRD”: OCRs inside CRDs (neuronal = 145,533(146,148) and non-neuronal 87,222(87918) in PFC(ACC)) (3) “Outside CRD”: OCRs outside CRDs (neuronal = 245,272(245,887) and non-neuronal 173,209(172,513) in PFC(ACC)). B) Bar plot of number of differential CRDs across four datasets identified using a two-stage test at FDR<5%. C) Schizophrenia heritability coefficients for neurons (red) and non-neurons (blue) stratified by (1) “All”: all schizophrenia OCRs (2) “CRD”: schizophrenia OCRs inside schizophrenia CRDs and (3) “Outside CRDs”: schizophrenia OCRs outside schizophrenia CRDs. schizophrenia OCRs are identified from the previous section (see Fig. 2) at FDR 5%. D) Heatmap depicting hierarchical clustering of trans interactions of 1,953 schizophrenia CRDs across 360 samples from the PFC. The clustering results in ten trans regulatory domains (TRDs) using gamma statistics. The directionality annotation bar plot above the heatmap shows upregulation in red (log2SCZ- log2Control >0) and downregulation in navy (log2SCZ- log2Control <0) of schizophrenia neuronal CRDs. Bar plot of Number of up and downregulated schizophrenia neuronal CRDs per TRD from the PFC region. E) Coefficients of schizophrenia heritability stratified by TRDs. F) Top and bottom bar plots show log2FCfetal_cortical (Fetal cortical vs adult controls) and log2FC (schizophrenia vs Controls) of neuronal PFC CRD respectively. G) Spearman correlation of log2FCfetal_cortical compared to log2FC (schizophrenia vs Controls) of neuronal PFC CRDs from TRD1 (n=3,056 OCRs). P value is obtained from Spearman’s rank correlation (ρ) test. H) Functional pathway enrichment of OCRs from neuronal PFC TRD1 that overlap with fetal cortical specific OCRs. The overlap of OCRs with schizophrenia risk variants A), C) and E) were assessed using LD score regression. P values are from LD score regression. ‘#’: significant for enrichment in LD score regression after Benjamini–Hochberg FDR correction for multiple testing across all tests in the plot (FDR < 5%). Error bars show standard error in schizophrenia heritability from LD score regression.
Figure 4:
Figure 4:. Analysis of cell-type specificity of neuronal PFC schizophrenia OCRs in fetal cortical scATAC-seq data.
A) Uniform Manifold Approximation Projection (UMAP) plot of fetal cortical scATAC-seq data from Trevino et al. in which each cell type is colored by Z-scores of schizophrenia OCRs in neuronal PFC TRD1. The cell types include early radial glia (EarlyRG), late radial glia (LateRG), oligodendrocyte progenitor cell/oligodendrocyte (OPC/Oligo), neuronal intermediate progenitor cell (nIPC), oligo intermediate progenitor cell (oIPC), glutamatergic neuron (GluN), interneuron (IN), endothelial cell (EC), microglia (MG), and pericytes (Peric). Distribution of enrichment scores stratified by two major classes of cell types: B) excitatory neurons (nine subtypes of glutamatergic neurons) and C) inhibitory neurons (five subtypes of inhibitory neurons). The color represents the magnitude of coefficient of association of enrichment scores of schizophrenia OCRs from neuronal PFC-TRD1 at each developmental stage separately for each cell types, using the model (enrichment score ~ celltype + (1|sample ID) where cell types are grouped as the cell type of interest vs. all other cell types. * depicts the cell types that are significantly enriched from the latter test and also have higher enrichment than the schizophrenia OCRs outside TRDs. D) Functional pathway analysis conducted on the early and late fetal glutamatergic specific marker genes that are also annotated by schizophrenia OCRs in TRD1. E) Heat map of MAGMA enrichment P values of brain-related and non-brain related GWAS traits and F) Coefficients of enrichment of common schizophrenia risk variants using MAGMA in fetal cell specific marker genes that are also annotated to schizophrenia OCRs within neuronal PFC TRD1. The x-axes in E) and F) are 1) early fetal (pcw16+20) glutamatergic (GluN 1,3,5,8) (magenta), 2) late fetal (pcw21+24) glutamatergic (GluN 6,9) (blue), 3) early+late fetal (pcw16+20+21+24) inhibitory (IN 4) (magenta+blue), 4) late fetal (pcw21+24) inhibitory (IN 3,5) fetal cell types (blue) and all ABC mapped schizophrenia OCRs to genes within neuronal PFC TRD1 (black). ‘#’: significant MAGMA enrichment coefficient after FDR correction of multiple testing across all tests in the plot (Benjamini–Hochberg test); ‘*’: nominally significant for enrichment in E) and F).
Figure 5:
Figure 5:. Trans Regulatory Domain one (TRD1) in PFC and ACC can stratify schizophrenia cases and controls in MVP cohort.
For schizophrenia TRDs: TRD1, TRD6 and TRD7 from PFC region and TRD1, TRD2 from ACC region. A) Plot of logOR from logistic regression of PRS of 203,078 individuals from MVP cohort estimated using the SNPs in OCRs from these TRDs to predict their case-control status. Error bars show standard error in estimating OR from logistic regression. B) Barplot of the average variance explained per variant in estimating PRS of SCZ, BD and MDD individuals (bar contour color is red, blue and green respectively). Bar fill color corresponds to the number of variants considered in each group for PRS estimation (PFC TRDs: 1,388 for TRD1, 139 for TRD6 and 103 for TRD7; ACC TRDs: 815 for TRD1 and 46 for TRD2; PGC3 SCZ: 350,882).

References

    1. Nestler E. J., Peña C. J., Kundakovic M., Mitchell A., Akbarian S., Epigenetic Basis of Mental Illness. Neuroscientist. 22, 447–463 (2016). - PMC - PubMed
    1. Kundakovic M., Champagne F. A., Early-life experience, epigenetics, and the developing brain. Neuropsychopharmacology. 40, 141–153 (2015). - PMC - PubMed
    1. Peña C. J., Bagot R. C., Labonté B., Nestler E. J., Epigenetic signaling in psychiatric disorders. J. Mol. Biol. 426, 3389–3412 (2014). - PMC - PubMed
    1. Wahbeh M. H., Avramopoulos D., Gene-Environment Interactions in Schizophrenia: A Literature Review. Genes. 12 (2021), doi: 10.3390/genes12121850. - DOI - PMC - PubMed
    1. Bryois J., Garrett M. E., Song L., Safi A., Giusti-Rodriguez P., Johnson G. D., Shieh A. W., Buil A., Fullard J. F., Roussos P., Sklar P., Akbarian S., Haroutunian V., Stockmeier C. A., Wray G. A., White K. P., Liu C., Reddy T. E., Ashley-Koch A., Sullivan P. F., Crawford G. E., Evaluation of chromatin accessibility in prefrontal cortex of individuals with schizophrenia. Nat. Commun. 9, 3121 (2018). - PMC - PubMed

Publication types