[Preprint]. 2023 Oct 14:2023.10.13.562147.
doi: 10.1101/2023.10.13.562147.

The H3.3 K36M oncohistone disrupts the establishment of epigenetic memory through loss of DNA methylation

Affiliations

The H3.3 K36M oncohistone disrupts the establishment of epigenetic memory through loss of DNA methylation

Joydeb Sinha et al. bioRxiv. .

Update in

Abstract

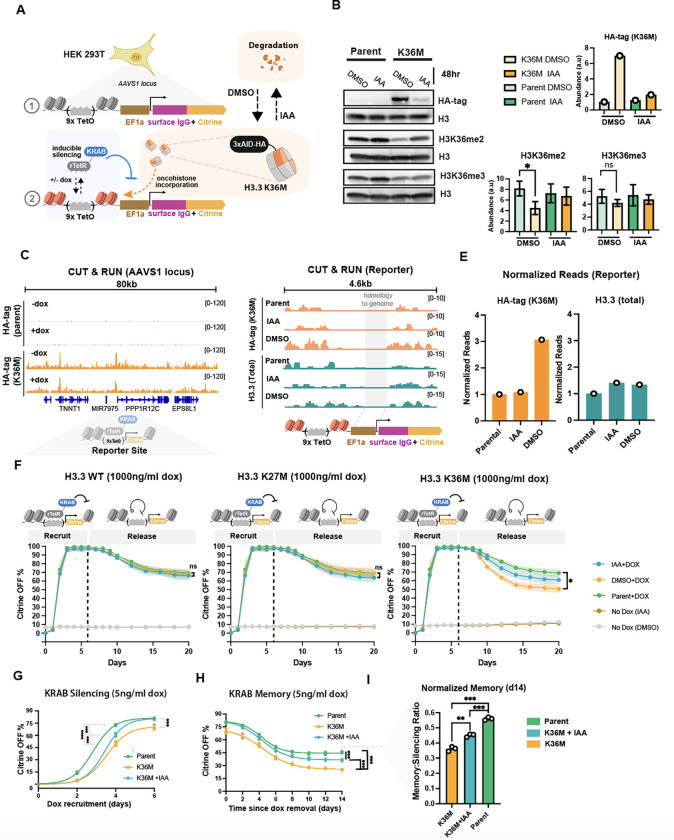
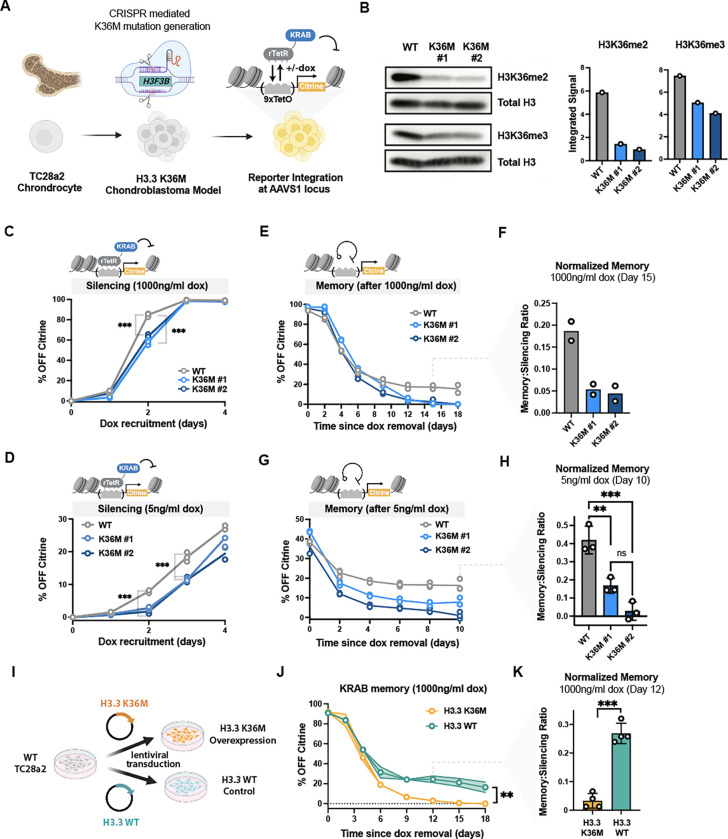
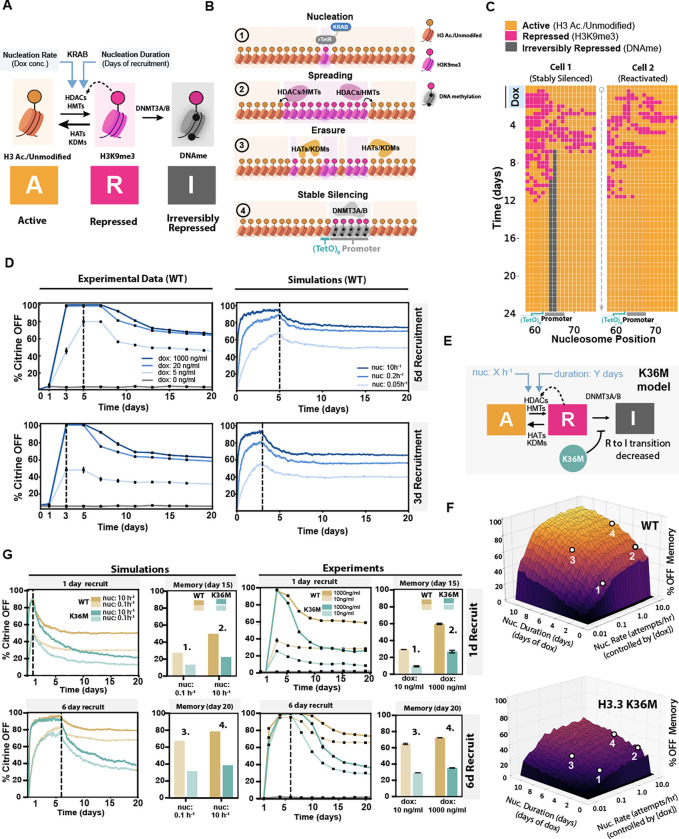
Histone H3.3 is frequently mutated in cancers, with the lysine 36 to methionine mutation (K36M) being a hallmark of chondroblastomas. While it is known that H3.3K36M changes the cellular epigenetic landscape, it remains unclear how it affects the dynamics of gene expression. Here, we use a synthetic reporter to measure the effect of H3.3K36M on silencing and epigenetic memory after recruitment of KRAB: a member of the largest class of human repressors, commonly used in synthetic biology, and associated with H3K9me3. We find that H3.3K36M, which decreases H3K36 methylation, leads to a decrease in epigenetic memory and promoter methylation weeks after KRAB release. We propose a new model for establishment and maintenance of epigenetic memory, where H3K36 methylation is necessary to convert H3K9me3 domains into DNA methylation for stable epigenetic memory. Our quantitative model can inform oncogenic mechanisms and guide development of epigenetic editing tools.


Figures

Fig. 1 |
Fig. 1 |. H3.3 K36M disrupts KRAB mediated establishment and maintenance of epigenetic memory in HEK23T cells.
(A) Schematic of the synthetic constitutive reporter integrated in the AAVS1 locus of HEK293T, to which rTetR-KRAB can be recruited with doxycycline (dox) in the presence or absence of oncohistone incorporation to induce gene silencing. The reporter consists of 9 copies of the TetO binding site upstream of an EF1A promoter and drives the expression of an IgG surface marker (used for magnetic cell separation) and an mCitrine fluorescent protein. The oncohistone is tagged with the AID degron allowing for auxin (IAA) inducible degradation of H3.3 K36M. and an HA tag for detection. (B) Representative western blots with antibodies against HA-tag (for oncohistone expression), as well as histone modifications H3K36me2 and H3K36me3 in parent cells that express the reporter and KRAB but not the oncohistone, and in K36M cells that have all three components: reporter, KRAB and H3.3K36M.IAA was removed for 48 hours and replaced with carrier (DMSO) to allow accumulation of the oncohistone in the K36M. On the right, bar plots indicate abundance as measured by Western blot band intensities with each antibody, normalized to H3 input (data presented as mean +/− STD of n=3 biological replicates). (C) CUT&RUN genome tracks measuring HA-tag signal from H3.3 K36M incorporation within an 80kb domain around the reporter in parental and H3.3 K36M cell lines. Measurements were made in the presence or absence of dox (1000 ng/ml) recruitment of KRAB for 6 days and total reads were normalized using E.coli DNA spike-in. (D) CUT&RUN genome tracks measuring incorporation levels of H3.3 K36M and total histone H3.3 (measuring both endogenous H3.3 and H3.3 K36M) at the AAVS1 reporter in the presence or absence of IAA induced degradation. Values are normalized by total number of reads and shown as counts per million. The EF1a promoter region is shaded gray and not analyzed since it is identical in sequence with the endogenous EF1a promoters. (E) Quantification of normalized reads at the reporter for CUT&RUN genome tracks shown in D. (F) Flow cytometry time courses in HEK293T measuring the mean fraction of Citrine OFF cells upon 6 days of 1000 ng/ml dox recruitment of KRAB and 14 days of memory. Shading represents SEM (n= 3 biological replicates). Dashed line indicates the time of dox removal. Statistical analysis was performed using Welch’s T-test. (G) Flow cytometry time course of low-recruitment KRAB silencing in the absence of IAA (no degradation) in cells expressing H3.3 K36M (orange) and parental cells without the oncohistone (green) at low levels of dox (5ng/ml dox). IAA (50μM) is added (blue curve) to partially degrade H3.3 K36M. n= 3 biological replicates. Statistical analysis was performed using a one-way ANOVA. (H) KRAB memory time course: cells were first silenced at low dox (5ng/ml, as shown in G), then dox was completely removed and the percentage of cells with the citrine reporter off is plotted for 14 days . Same colors and analyses as in panel G.(I) Bar plots quantifying memory data in H where the % of Citrine OFF is normalized at day 14 to the level of each cell line’s level of silencing at day 0 of dox removal (day 6 of silencing). n= 3 biological replicates. Statistical analysis was performed using a one-way ANOVA
Fig. 2 |
Fig. 2 |. KRAB mediated epigenetic memory and silencing speed is reduced in a H3K36M chondroblastoma model.
(A) Schematic describing the workflow to engineer TC28a2 chondrocytes to generate chondroblastoma reporter cell lines: one copy of the endogenous histone H3.3 (H3F3B gene) was edited in two separate clones using CRISPR to generate the K36M mutation. We integrated the Citrine reporter into the AAVS1 locus using TALENs, and delivered TetR-KRAB using lentivirus. (B) Western blots with quantification of band intensities showing levels of H3K36me2 and H3K36me3 (normalized by Total H3) in wildtype TC28a2 cells and two CRISPR edited K36M clones. (C) Flow cytometry time course during 4 days of KRAB recruitment (with 1000ng/ml dox) in TC28a2 cells, with the fraction of Citrine silenced cells quantified over time for WT (gray) and H3.3 K36M TC28a2 reporter clones(n= 3 biological replicates). Statistical analysis was performed using a one-way ANOVA (D) Flow cytometry time course during 4 days of KRAB recruitment with low dox (with 5ng/ml dox) in TC28a2 cells. The fraction of Citrine silenced cells quantified over time for WT and H3.3 K36M TC28a2 reporter clones (n= 3 biological replicates). Statistical analysis was performed using a one-way ANOVA. (E) Flow cytometry time course measuring epigenetic memory in TC28a2 cells, shown as percentage of cells with citrine silenced after 5 days of KRAB recruitment (at 1000ng/ml dox) and release (dox removal) for 18 days. The fraction of Citrine silenced cells is measured after dox removal at day 0 and normalized to the no dox control at each time point (n=2 biological replicates, see methods). (F) Bar plots quantifying normalized epigenetic memory from the time-courses in E by dividing memory (the %Citrine OFF cells at day 15) to the initial silencing (%OFF at day 0) from n=2 biological replicates. (G) Flow cytometry time course measuring epigenetic memory after 6 days of KRAB recruitment (5ng/ml dox) in TC28a2 cells. The fraction of Citrine silenced cells is measured after dox removal at day 0 and normalized to the no dox control at each time point (see methods). n=3 biological replicates. Statistical analysis was performed using a one-way ANOVA. (H) Bar plots quantifying normalized epigenetic memory as a memory-to-silencing ratio from the time-courses in G by normalizing the %Citrine OFF cells at day 15 to the initial %OFF at day 0 (n=3 biological replicates). Statistical analysis was performed using a one-way ANOVA. (I) Schematic describing workflow to overexpress H3.3 (WT) or H3.3 (K36M) in wildtype TC28a2 cells. (J) Epigenetic memory time course after 5 days of KRAB recruitment (1000ng/ml dox) and 18 days of dox release in WT TC28a2 cells transduced with lentivirus consisting of H3.3 or H3.3 K36M overexpression. Shading represents standard deviation at each timepoint (n=4 biological replicates). Statistical analysis was performed using Welch’s T-test. (K) Bar plots quantifying normalized epigenetic memory calculated from the time-courses in J by normalizing memory (the %Citrine OFF cells at day 12) to silencing (the initial %OFF at day 0) from n=4 biological replicates. Statistical analysis was performed using Welch’s T-test.
Fig. 3 |
Fig. 3 |. Loss of epigenetic memory by H3.3 K36M is not due to reduced H3K9me3 deposition.
(A) Schematic describing magnetic cell separation after establishment of epigenetic memory. KRAB was recruited with dox (1000 ng/ml) for 2 days in parental cells and 10 days in K36M cells to generate roughly a 50% OFF memory population after 14 days of release. This OFF population was then sorted for each cell line, and silenced cells were propagated in cell culture to assess maintenance of memory using flow cytometry 2 days and 20 days after sorting. (B) Flow cytometry distributions of Citrine reporter expression during KRAB recruitment in parental and K36M cells for 0 days (no dox, D0), 2 days (D2) and 6 days (D6) with 1000 ng/ml dox. (C) CUT&RUN genome tracks for H3K9me3 during KRAB silencing for the same populations of cells shown in B. Read numbers are normalized by total number of reads and shown as counts per million. (D) Flow cytometry distributions of Citrine expression after enriching the stably silenced memory population by FACS 14 days after KRAB release. (E) CUT & RUN genome tracks for H3K9me3, normalized as in C, during KRAB memory corresponding to the sorted population of cells shown in D. (F) Left: H3K9me3 reads densities at the reporter (AAVS1) and the surrounding 80kb domain in the vicinity of the PPP1R12C gene quantified from genome tracks at the timepoints shown in C&E (n=2 biological replicates). Right: H3K9me3 reads densities from a panel of control genes (n=2 biological replicates). (G) H3K9me3 levels (counts per million per kb) at the AAVS1 locus (PPP1R12C gene) and the entire 80kb domain around the reporter over time in WT and K36M cells upon dox recruitment and release. The release time point is from the sorted memory population in D (n=2 biological replicates). (H) A sequential scatter plot of the dynamics of H3K9me3 versus the fraction of Citrine silent cells from flow cytometry data in Fig. 1F, showing the time evolution of the system in parental (green) and K36M cells (orange) for 0 days, 2 days and 6 days of silencing respectively. The Day 20 memory time point shows H3K9me3 levels for the sorted OFF cells in Fig. D. Percentages of cells OFF (Y-axis) are the mean of 3 biological replicates +/− SEM. H3K9me3 levels (X-axis) are the mean of 2 biological replicates (CUT & RUN from 3C&E).
Fig. 4 |
Fig. 4 |. H3.3 K36M disrupts the deposition of DNA methylation after KRAB recruitment and release.
(A) Schematic describing siRNA perturbations targeting H3K36 methyltransferases in wildtype cells to phenocopy effects of the H3.3 K36M oncohistone. (B) Quantification of global H3K36me2 and H3K36me3 levels by Western blot 48hr post-transfection with siRNA targeting NSD1 or SETD2 respectively (n= 2 biological replicates), normalized first to H3 levels for each condition, and then relative to siRNA control. (C) Flow cytometry time courses measuring epigenetic memory in HEK293T cells treated with siRNA targeting either NSD1 or SETD2 during the memory phase after KRAB recruitment (n = 2 biological replicates), with siRNA delivery at day 0. Cells were silenced by KRAB recruitment with 1000ng/ml dox for 2 days prior to beginning the time course shown. (D) Left: Flow cytometry time courses measuring epigenetic memory in HEK293T cells treated with siRNA targeting de novo methyltransferases DNMT3A and DNMT3B in WT (green) or H3.3 K36M (orange) cells (with siRNAs delivered at day 0 of memory, upon dox removal). Darker color lines represent targeting siRNA and lighter color lines represent non-targeting control siRNA in each cell line (n=3 biological replicates). The black line at day 14 indicates the difference in memory at the endpoint of the experiment. Cells were silenced by KRAB recruitment with 1000ng/ml dox for 2 days prior to beginning the dox removal time course shown. Right: Bar plots quantifying the difference in memory between the DNMT3A/B target siRNA and control siRNA in WT and H3.3 K36M cells at day 14 after dox removal (n=3 biological replicates). Statistical analysis was performed using Welch’s T-test. (E) Flow cytometry histograms of Citrine expression in WT and H3.3 K36M cells before KRAB recruitment (gray, −dox), after 6 days of dox silencing at 1000ng/ml dox (D6 +dox green, left), and 14 days memory after dox removal (20 day time point, right). Cells from these populations were collected for EMseq. (F) Top: Schematic of the AAVS1 reporter indicating regions for which DNA methylation is measured using EMseq. Bottom: % CpG methylation from EMseq plotted along the amplicon corresponding to the promoter region on the reporter upon KRAB recruitment and release at time points corresponding to populations shown in 4H (n=2 biological replicates). Shading represents the standard deviation. (G) Scatter plot measuring the time evolution of the mean %CpG methylation (n=2 replicates) at the promoter from EMseq (from Fig. 4H) and the mean % Citrine OFF from flow cytometry experiments (n=3 replicates taken from Fig. 1F) over time during KRAB silencing and memory. Y-axis error bars represent the SEM of 3 biological replicates. (H) Kinetic model describing steps associated with establishment and maintenance of epigenetic memory in parental and K36M cells In the first step (Establishment), H3K9me3 is converted to DNA methylation. H3.3 K36M cells (bottom) have reduced H3K36me3 and a reduced ability to convert H3K9me3 into DNA methylation (thinner arrow). (I) Schematic describing a possible model consistent with loss of epigenetic memory due to H3.3 K36M loss of H3K36 methylation due to K36M (right) leads to a reduced ability to recruit DNMT3A/B and hence low CpG DNA methylation.
Fig. 5 |
Fig. 5 |. A chromatin spreading model that includes DNA methylation quantitatively predicts decreases in epigenetic memory caused by H3.3 K36M.
(A) Schematic showing three nucleosome states: Active modifications (A, yellow, e.g., H3 acetylated/H3K9 unmodified), Repressive modifications (R, pink, e.g., H3K9me) and Irreversibly Repressive modifications (I, gray, e.g. DNA methylation). Example enzymes that mediate state conversions between nucleosome states are indicated on the black arrows that denote state transitions among the 3 states. KRAB recruitment increases the rates of transition from A to R (at the nucleosome where KRAB is recruited), indicated by the blue arrow. We call this KRAB-mediated increase in A-to-R conversion nucleation; dox concentration and recruitment time increase nucleation rate and duration respectively. (B) Typical time-evolution of the nucleosome array: 1) The system starts with all nucleosomes in the active state (yellow) and upon dox addition KRAB binds at the nucleosome corresponding to the 9XTetO sites to nucleate H3K9me3 (R state conversion, pink). 2) H3K9me3 (R state, pink) spreads from the nucleation site through reader-writer feedback between neighboring nucleosomes away from the nucleation site. 3) Spreading of repressing modifications can be counteracted (“erased”) by direct R to A nucleosome state transitions coming from histone turnover, removal of histone methylation, or deposition of histone acetylation. 4) Nucleosomes at the promoter can be irreversibly silenced (gray) by acquiring DNA methylation. (C) Stable repression is stochastic in individual simulations under the same conditions (rates). Left: Example of one cell with an irreversibly silenced reporter gene due to the acquisition of nucleosomes in I state (gray) at the promoter. Right: Example of another cell whose reporter becomes reactivated (all nucleosomes in the yellow state) after transient silencing. (D) Left: Experimental time-series data showing the fraction of silent cells measured every other day from the time point at which dox has been added for a transient period - either for a total of 5 days (top panel) or 3 days (bottom panel), up to dashed line- and at different concentrations (in ng/mL), as shown in legend of lower panel (n=3 biological replicates). Dox was removed for days to the right of the dashed line. Right: Simulation data showing the fraction of silent reporters (from 1000 simulations) every 20 minutes (in simulation time) for different nucleation rates that were kept constant for either 5 days (top) or 3 days (bottom). Nucleation rates were set to zero for times to the right of the dashed line. (E) Schematic showing the kinetic model used for generating the memory landscapes of parental (WT) cells and oncohistone cells in F. Input variables are the nucleation rate (varied on a log-scale from 0h-1 to 10h-1) and nucleation days (varied from 0 to 11, in steps of 0.5 days). The oncohistone simulations were performed with the same parameters but with 75% of randomly chosen nucleosomes being blocked for R to I transitions to mimic the rate-reducing effect of the oncohistone on de novo DNA methylation. (F) Memory-landscapes of reporter gene in parental cells (top) and H3.3K36M oncohistone cells (bottom) showing the fraction of silent cells at simulation day 14 as a function of nucleation-rate (in attempts/hour) and nucleation duration (in days). (G) Left: Simulation time courses performed with nucleation rates of 0.1h-1 (transparent) and 10h-1 (nontransparent) and with 1 (top) and 6 days (bottom) of nucleation for oncohistones (blue) and WT cells (mustard), respectively. Barplots show the fraction of silenced cells at memory day 14. Right: Experimental time courses performed with 10 ng/mL (transparent) and 1000 ng/mL (nontransparent) of dox for 1 (top) and 6 days (bottom) for oncohistones (blue) and parental WT cells (mustard), respectively. Barplots show the fraction of silenced cells at memory day 14.

References

    1. Bird A. (2002). DNA methylation patterns and epigenetic memory. Genes Dev. 16, 6–21. 10.1101/gad.947102. - DOI - PubMed
    1. Probst A.V., Dunleavy E., and Almouzni G. (2009). Epigenetic inheritance during the cell cycle. Nat. Rev. Mol. Cell Biol. 10, 192–206. 10.1038/nrm2640. - DOI - PubMed
    1. Kim M., and Costello J. (2017). DNA methylation: an epigenetic mark of cellular memory. Exp. Mol. Med. 49, e322. 10.1038/emm.2017.10. - DOI - PMC - PubMed
    1. Halley-Stott R.P., and Gurdon J.B. (2013). Epigenetic memory in the context of nuclear reprogramming and cancer. Brief. Funct. Genomics 12, 164–173. 10.1093/bfgp/elt011. - DOI - PMC - PubMed
    1. Yang J.-H., Hayano M., Griffin P.T., Amorim J.A., Bonkowski M.S., Apostolides J.K., Salfati E.L., Blanchette M., Munding E.M., Bhakta M., et al. (2023). Loss of epigenetic information as a cause of mammalian aging. Cell 186, 305–326.e27. 10.1016/j.cell.2022.12.027. - DOI - PMC - PubMed

Publication types