[Preprint]. 2023 Oct 3:2023.10.03.560700.
doi: 10.1101/2023.10.03.560700.

Post-ischemic inactivation of HIF prolyl hydroxylases in endothelium promotes maladaptive kidney repair by inducing glycolysis

Affiliations

Post-ischemic inactivation of HIF prolyl hydroxylases in endothelium promotes maladaptive kidney repair by inducing glycolysis

Ratnakar Tiwari et al. bioRxiv. .

Update in

Abstract

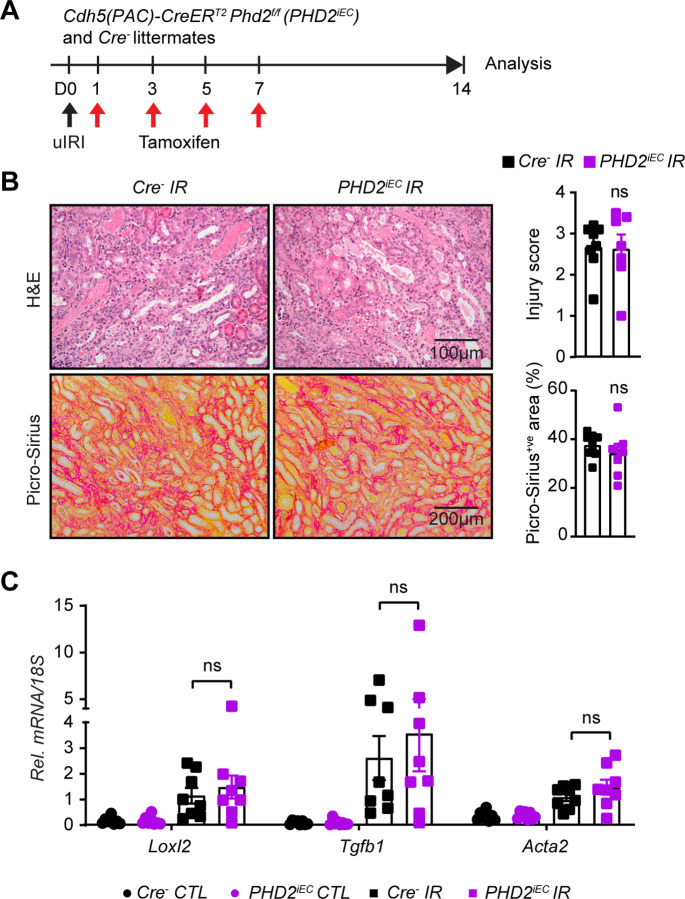
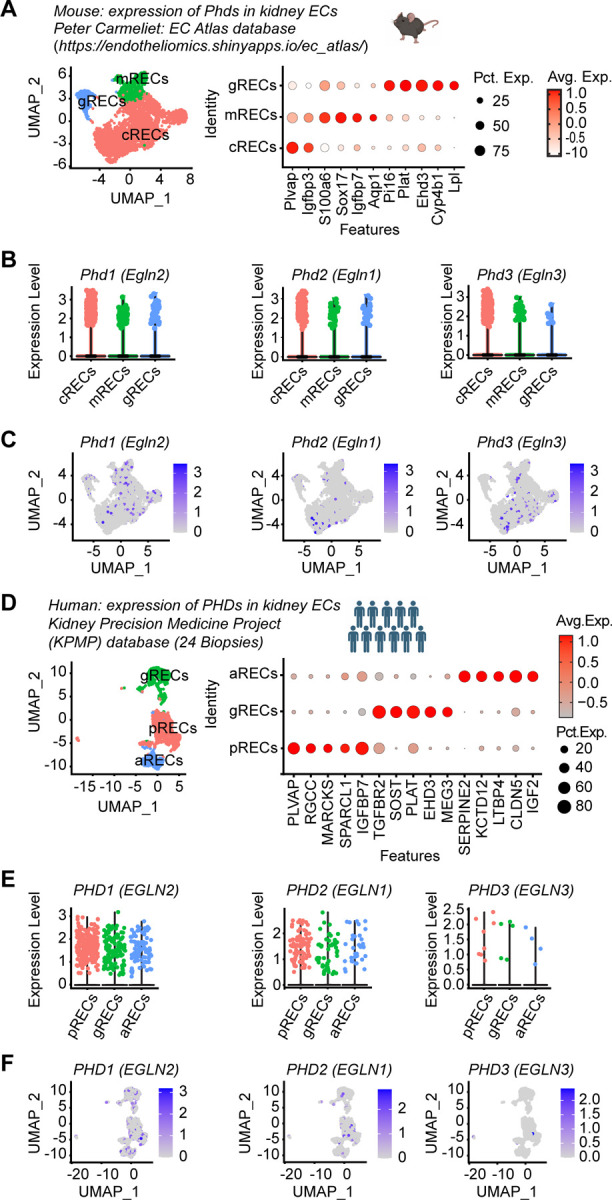
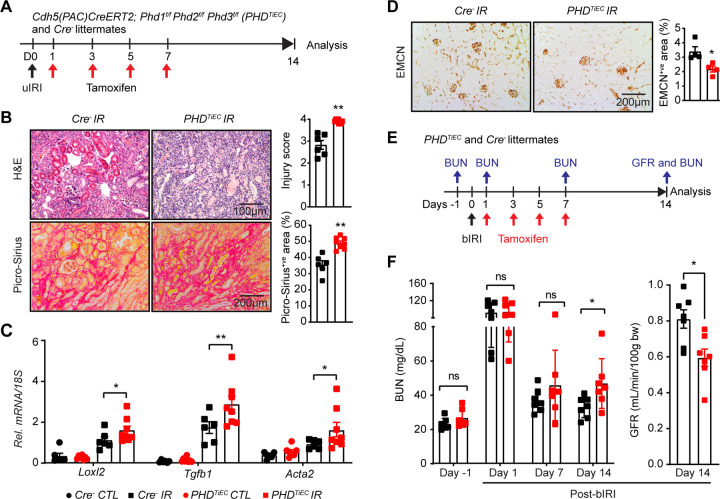
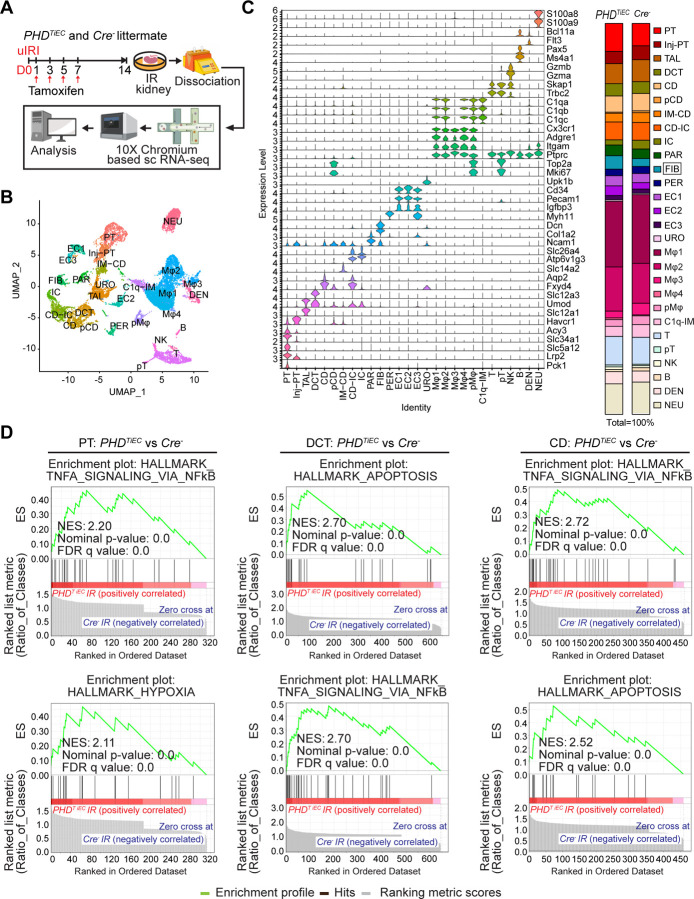
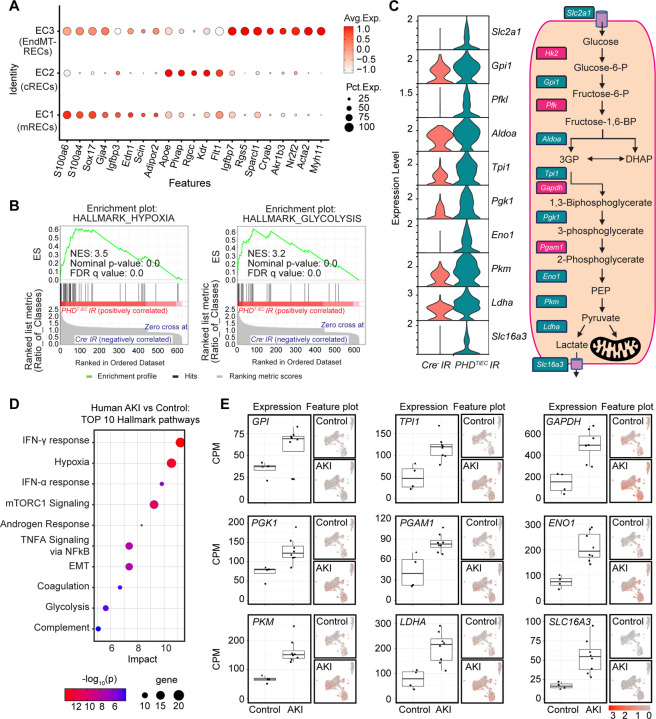
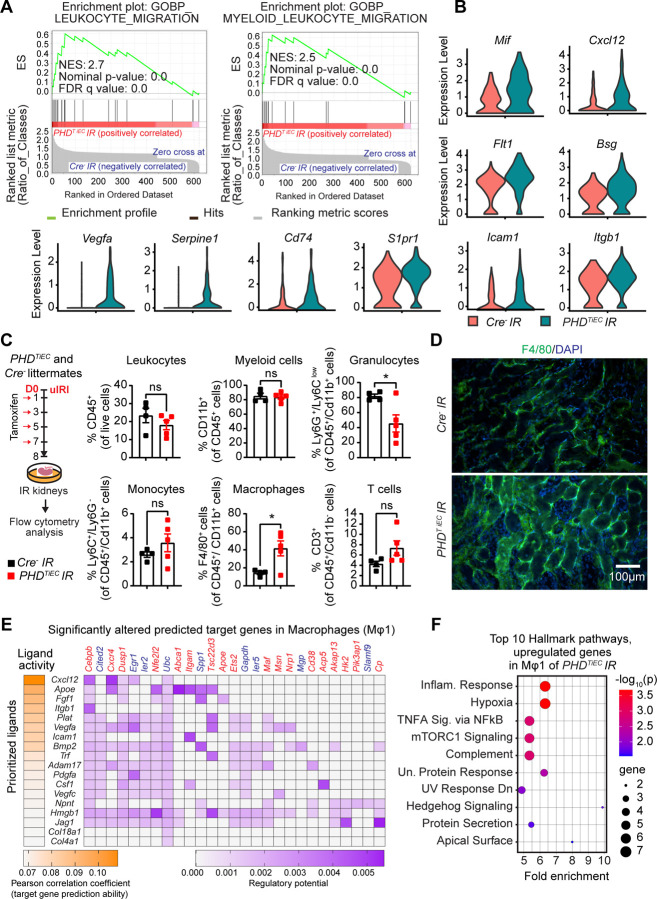
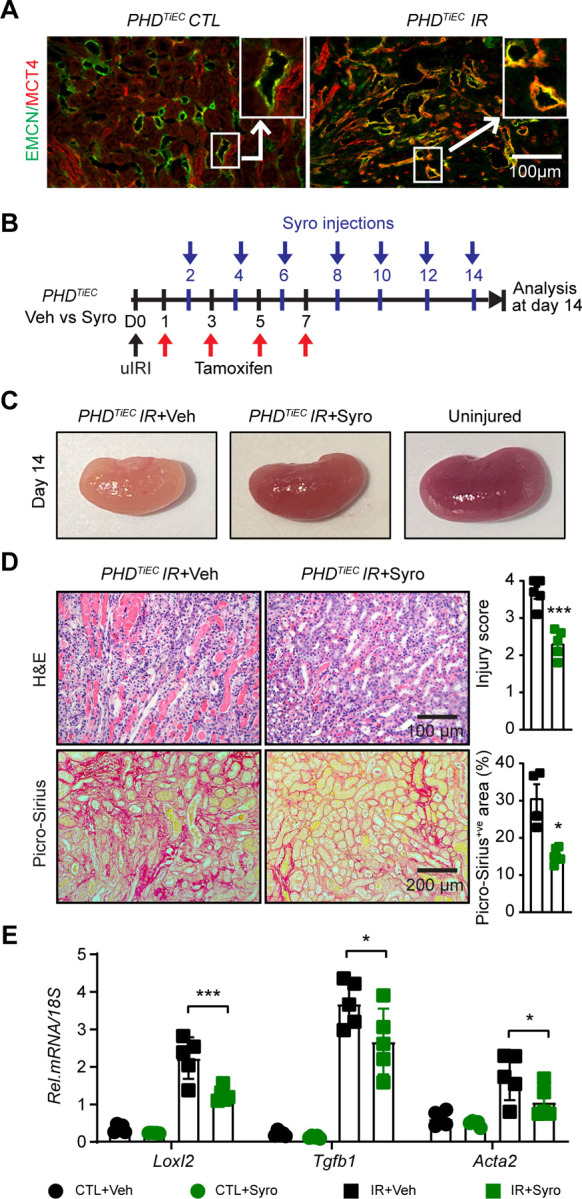
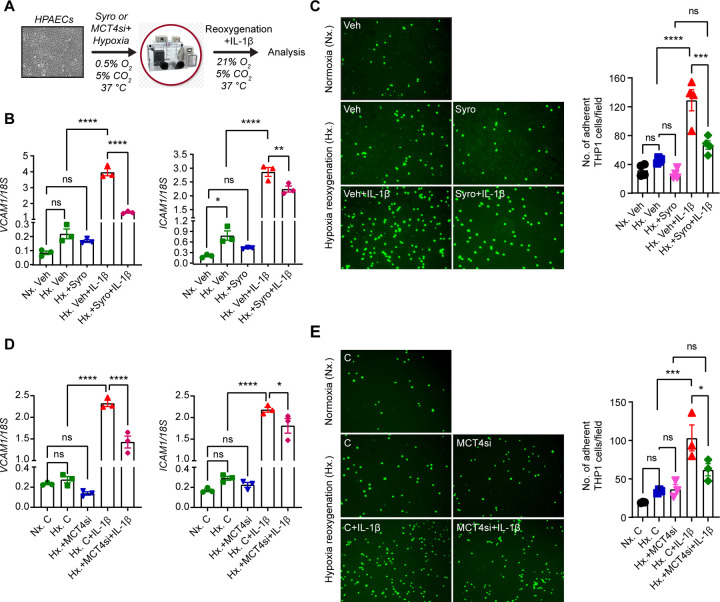
Ischemic acute kidney injury (AKI) is common in hospitalized patients and increases the risk for chronic kidney disease (CKD). Impaired endothelial cell (EC) functions are thought to contribute in AKI to CKD transition, but the underlying mechanisms remain unclear. Here, we identify a critical role for endothelial oxygen sensing prolyl hydroxylase domain (PHD) enzymes 1-3 in regulating post-ischemic kidney repair. In renal endothelium, we observed compartment-specific differences in the expression of the three PHD isoforms in both mice and humans. We found that post-ischemic concurrent inactivation of endothelial PHD1, PHD2, and PHD3 but not PHD2 alone promoted maladaptive kidney repair characterized by exacerbated tissue injury, fibrosis, and inflammation. Single-cell RNA-seq analysis of the post-ischemic endothelial PHD1, PHD2 and PHD3 deficient (PHDTiEC) kidney revealed an endothelial glycolytic transcriptional signature, also observed in human kidneys with severe AKI. This metabolic program was coupled to upregulation of the SLC16A3 gene encoding the lactate exporter monocarboxylate transporter 4 (MCT4). Strikingly, treatment with the MCT4 inhibitor syrosingopine restored adaptive kidney repair in PHDTiEC mice. Mechanistically, MCT4 inhibition suppressed pro-inflammatory EC activation reducing monocyte-endothelial cell interaction. Our findings suggest avenues for halting AKI to CKD transition based on selectively targeting the endothelial hypoxia-driven glycolysis/MCT4 axis.


Conflict of interest statement

DECLARATION OF INTERESTS The authors declare that they have no conflict of interest.

Figures

Figure 1.
Figure 1.. Post-ischemic inactivation of endothelial PHD2 does not alter post-ischemic kidney injury.
(A) Experimental scheme illustrates the timing of unilateral renal artery clamping, tamoxifen administration and analysis. (B) Representative images of H&E and Picro-Sirius red stained sections from day 14 post-ischemic kidneys of PHD2iEC mutants and their Cre littermates. Right panels show tubular injury score (Top) and semi-quantitative analysis of Picro-Sirius red+ve area in the indicated geno-types. Scale bars indicate 100 μm and 200 μm for H&E and Picro-Sirius red images, respectively. (C) mRNA levels of Loxl2, Tgfb1 and Acta2 in IR and CTL kidneys from PHD2iEC mice and their Cre controls at day 14 after unilateral IRI. All bars show mean ± SEM. For (B), unpaired t-test with Welch’s correction was used. For (C), statistics were determined using one-way ANOVA with Sidak correction for multiple comparisons. *, P <0.05; ns, not statistically significant. uIRI, unilateral ischemia reperfusion injury; CTL, contralateral; IR, kidney subjected to uIRI; Rel., relative.
Figure 2.
Figure 2.. scRNA-seq analysis shows differential expression of PHD1, PHD2 and PHD3 in kidney ECs in mouse and humans.
(A-C) scRNA-seq analysis of RECs extracted from mouse EC Atlas database (https://endotheliomics.shinyapps.io/ec_at-las/). (A) Uniform manifold approximation and projection (UMAP) plot shows three EC clusters; cortical RECs (cRECs), medullary RECs (mRECs) and glomerular RECs (gRECs). Dot plot displays gene expression patterns of cluster-enriched markers. Violin plots (B) and feature plots (C) show the expression of Phd1 (Egln2), Phd2 (Egln1) and Phd3 (Egln3) in murine RECs. (D-F) scRNA-seq analysis of RECs extracted from normal human kidney biopsies (n=24). (D) UMAP plot shows arteriolar RECs (aRECs), glomerular RECs (gRECs) and peritubular RECs (pRECs). Dot plot illustrates gene expression patterns of cluster-en-riched markers. Violin plots (E) and feature plots (F) show the expression of PHDs in different RECs clusters.
Figure 3.
Figure 3.. Post-ischemic simultaneous inactivation of endothelial PHD1, 2, and 3 promotes maladaptive kidney repair.
(A) Scheme illustrating the experimental strategy applied for unilateral renal IRI (uIRI) studies. PHDTiEC mice and their Cre littermates were subjected to 25 minutes of unilateral renal artery clamping. Treatment with tamoxifen was started on day 1 post uIRI involving 4 IP doses given every other day. Mice were sacrificed for histopathological and molecular analysis on day 14 post uIRI. (B) Representative images of H&E and Picro-Sirius red stained sections as well as tubular injury score and semi-quantitative analysis of Picro-Sirius red+ve area on day 14 post-ischemic kidneys from PHDTiEC mice and Cre littermates. Scale bars indicate 100 μm and 200 μm for H&E and Picro-Sirius red images, respectively. (C) mRNA levels of Loxl2, Tgfb1 and Acta2 in IR and CTL kidneys from PHDTiEC mice or their Cre controls at day 14 after uIRI. (D) Representative images of EMCN immunostaining and semiquantitative analysis of EMCN+ve peritubular capillary area on day 14 post-ischemic kidneys from PHDTiEC mice and Cre littermates. (E) Scheme depicting the experimental workflow for bilateral renal IRI (bIRI) studies. PHDTiEC mice and their Cre littermates were subjected to 23 minutes of bilateral renal artery clamping followed by tamoxifen treatment as described in A. Serum BUN levels were measured on 1 day prior to bIRI (baseline) and on days 1, 7 and 14 post bIRI. GFR was measured by FITC-sinistrin clearance on day 14 post bIRI using the MediBeacon transdermal GFR monitor system. (F) Serum BUN levels at different time points and GFR measurements on day 14 post bIRI. All bars show mean ± SEM of each group (n=4–8). For (B), (D) and (F), statistics were determined by unpaired t-test with Welch’s correction. For (C), one-way ANOVA with Sidak correction for multiple comparisons was used. *, P< 0.05; **, P< 0.01; ns, not statistically significant. CTL, contralateral kidney; IR, kidney subjected to IRI; bIRI, bilateral IRI; Rel., relative.
Figure 4.
Figure 4.. scRNA-seq analysis reveals the cellular landscape of day 14 post-ischemic kidneys of PHDTiEC and control mice.
(A) Scheme illustrating the experimental strategy applied for scRNA-seq analysis. A PHDTiEC mouse and a Cre littermate were subjected to 25 minutes of unilateral renal artery clamping. Treatment with tamoxifen was started on day 1 post uIRI and involved 4 IP doses given every other day. Mice were sacrificed for scRNA-seq analysis on day 14 post uIRI. IR kidneys were isolated and single cell suspension was prepared and used for scRNA-seq analysis (n=1 per genotype). (B) Uniform manifold approximation and projection (UMAP) plot representation of the cell classification in day 14 post-ischemic kidneys from PHDTiEC and Cre mice. (C) Violin plots display characteristic marker genes for each identified cell population. Right side bar plot shows cell proportions in day 14 post-ischemic kidneys from Cre and PHDTiEC mice. Highlighted is the increased proportion of fibroblasts in PHDTiEC post-ischemic kidney compared to Cre control. Proximal tubule (PT), Injured proximal tubule (Injured-PT), Thick ascending limb (TAL), Distal convoluted tubule (DCT), Collecting duct (CD), Proliferating CD (pCD), Inner medullary collecting duct (IM-CD), Collecting duct-intercalated cells (CD-IC), Intercalated cells (IC), Parietal cells (PAR), Fibroblasts (FIB), Pericytes (PER), Endothelial cells 1–3 (EC1–3), Urothelial cells (URO), Macrophages 1–4 (Mφ1–4), Proliferating macrophages (pMφ), C1q (C1qa, C1qb and C1qc) expressing immune cells (C1q-IM), T cells (T), Proliferating T cells (pT), Natural killer cells (NK), B cells (B), Dendritic cells (DEN), and Neutrophils (NEU). (D) Top 2 enriched Hallmark pathways emerged in GSEA (gene set enrichment analysis) hallmark analysis of differentially expressed genes (DEGs) for PT, DCT and CD clusters of PHDTiEC post-ischemic kidney as compared to Cre control.
Figure 5.
Figure 5.. Post-ischemic endothelial PHD inactivation induces a hypoxia and glycolysis gene signature in mRECs.
(A) Dot plot visualization shows the expression of marker genes used to identify cRECs, mRECs and EndMT-RECs clusters. (B) GSEA in mRECs of PHDTiEC kidney compared to control. Among the most highly enriched Hallmark pathways were Hypoxia and Glycolysis. (C) Violin plots show significantly upregulated glycolytic genes in mRECs of PHDTiEC compared to control. Pathway diagram summarizes the functions of up-regulated genes (marked by teal boxes) in glycolysis. (D-E) snRNA-seq analysis of human kidney tissue from patients with severe AKI and controls (n=6–8). Analysis was performed on publicly available snRNA-seq data from Christian Hinze et al (39). (D) Bubble chart for top 10 enriched Hallmark pathways of upregulated DEGs in kidney ECs from patients with severe AKI compared to controls. (E) Box plots show the expression of glycolytic genes in kidney ECs in controls vs AKI patients. The expression levels of glycolytic genes were extracted from the online interface provided by Christian Hinze et al (https://shiny.mdc-berlin.de/humAKI). CPM, normalized counts per million; cRECs, cortical renal ECs; mRECs, medullary renal ECs; EndMT-RECs, renal ECs expressing mesenchymal markers.
Figure 6.
Figure 6.. Post-ischemic inactivation of endothelial PHDs induces EC derived pro-inflammatory responses.
(A) GSEA plots show significant enrichment for GO-biological processes (GOBP) of leukocyte migration and myeloid leukocyte migration in mRECs of PHDTiEC post-ischemic kidney compared to control. (B) Violin plots display the expression levels of pro-inflammatory genes associated with core enrichment in GOBP-leukocyte migration and myeloid leukocyte migration in mRECs of PHDTiEC compared to control. (C) Shown is the experimental strategy for flow cytometry analysis. Eight days after uIRI, post-ischemic kidneys from PHDTiEC and Cre control mice were harvested, and flow cytometry analysis of immune cells was performed (n=4–5). Data are represented as mean ± SEM. Statistics were determined by unpaired t-test with Welch’s correction. (D) Representative images of immunofluorescence staining for F4/80 (green) and nuclear DAPI staining (blue) of day 8 post-ischemic kidneys from PHDTiEC and Cre control mice. Images were captured using a Nikon Ti2 Widefield fluorescence microscope. Scale bar indicates 100 μm. (E) Shown is NicheNet analysis of mRECs communication with macrophage Mφ1 cluster in day 14 post-IRI kidney of PHDTiEC mutant compared to control. Top prioritized ligands expressed by mRECs (senders) and target genes that are significantly altered (red,upregulated genes; blue,downregulated genes) in the macrophages Mφ1 (receivers). The interaction pairs were derived from the NicheNet data sources and analysis. (F) Hallmark analysis of significantly upregulated genes in Mφ 1 cluster of post-ischemic PHDTiEC kidney compared to Cre control. Top 10 pathways are shown. *, P <0.05; ns, not statistically significant.
Figure 7.
Figure 7.. Post-IRI treatment with the MCT4 inhibitor syrosingopine restores adaptive kidney repair in PHDTiEC mice.
(A) Representative images of immunofluorescence staining for MCT4 (red) and EMCN (green) of contralateral and day 14 post-ischemic kidneys from PHDTiEC mice. Zoom-in panels show the increased expression of MCT4 in EMCN+ve cells in PHDTiEC post-ischemic kidney. Images were captured using a Nikon Ti2 Widefield fluorescence microscope. Scale bar, 100 μm. (B) Scheme shows the experimental protocol used. PHDTiEC mice were subjected to 25 minutes of unilateral renal artery clamping. Tamoxifen was started on day 1 post uIRI and was given every other day until day 7 post uIRI. Treatment with syrosingopine was started at day 2 post uIRI and was given every other day until day 14, when mice were sacrificed for histopathological and molecular analysis. (C) Representative images of uninjured kidney compared to day 14 post-ischemic kidneys treated with vehicle, or syrosingopine. All mice are PHDTiEC mutants. (D) Representative images of H&E and Picro-Sirius red stained day 14 post-ischemic kidneys from vehicle-vs syrosingopine-treated PHDTiEC mutants. Right: Tubular injury score and semiquantitative analysis of Picro-Sirius red+ve area of day 14 post-ischemic kidneys for the indicated experimental groups. Scale bars indicate 100 μm and 200 μm for H&E and Picro-Sirius red images, respectively. (E) mRNA levels of Loxl2, Tgfb1 and Acta2 in CTL and IR kidneys from vehicle or syrosingopine-treated PHDTiEC mice on day 14 after uIRI. Data are represented as mean ± SEM. For (D), statistics were determined by unpaired t-test with Welch’s correction. For (E), statistics were determined using one-way ANOVA with Sidak correction for multiple comparisons. n=4–5; *, P< 0.05; ***, P< 0.001. uIRI, unilateral IRI; CTL, contralateral kidney; IR, kidney subjected to IRI; Veh, vehicle; Syro, syrosingopine.
Figure 8.
Figure 8.. Syrosingopine or MCT4 knockdown suppresses the expression of EC adhesion molecules in HPAECs activated by Hypoxia/Reoxygenation and IL-1β.
(A) Experimental scheme for HPAECs subjected to 0.5% O2 for 18 hours in the presence of syrosingopine (5 µM) or MCT4 siRNA followed by reoxygenation for 8 hours in the presence of IL-1β (1 ng/ml). (B) mRNA levels of VCAM1 and ICAM1 in syrosingopine-vs vehicle-treated HPAECs, that were activated by Hypoxia/Reoxygenation and IL-1β. (C) THP1 monocyte adhesion to inflamed ECs. THP1 monocyte cells, labeled with Green CMFDA Dye, were introduced on a monolayer of HPAECs that had been subjected to the indicated experimental conditions. Following a 90-minute incubation period, floating cells were washed away and adhered THP1 cells were visualized using a fluorescent microscope and subsequently quantified. Representative images of fluorescent THP1 cells attached to ECs in different experimental groups are presented. Scale bar, 200 μm. (D) mRNA expression of VCAM1 and ICAM1 in HPAECs transfected with control or MCT4 siRNA and subjected to Hypoxia/Reoxygenation and IL-1β (E) THP1 monocyte adhesion to inflamed ECs. Labeled THP1 cells were introduced on a monolayer of HPAECs that had been subjected to the indicated experimental conditions. Following incubation, adhered THP1 cells were visualized quantified as in C. Representative images of fluorescent THP1 cells attached to ECs in different experimental conditions are presented. Scale bar, 200 μm. Data are represented as mean ± SEM. Statistics were determined by one-way ANOVA with Sidak correction for multiple comparisons. n=3–4; *, P < 0.05; **, P <0.01; ***, P <0.001; ****, P < 0.0001; ns, not statistically significant. Nx, Normoxia; Hx, Hypoxia/Reoxygenation; Veh, vehicle; Syro, syrosingopine; C, negative control siRNA; MCT4si, MCT4siRNA.

References

    1. Hoste EA, Bagshaw SM, Bellomo R, Cely CM, Colman R, Cruz DN, et al. Epidemiology of acute kidney injury in critically ill patients: the multinational AKI-EPI study. Intensive Care Med. 2015;41(8):1411–23. - PubMed
    1. Ronco C, Bellomo R, and Kellum JA. Acute kidney injury. Lancet. 2019;394(10212):1949–64. - PubMed
    1. Uchino S, Kellum JA, Bellomo R, Doig GS, Morimatsu H, Morgera S, et al. Acute renal failure in critically ill patients: a multinational, multicenter study. JAMA. 2005;294(7):813–8. - PubMed
    1. Chawla LS, Eggers PW, Star RA, and Kimmel PL. Acute Kidney Injury and Chronic Kidney Disease as Interconnected Syndromes. N Engl J Med. 2014;371(1):58–66. - PMC - PubMed
    1. Ferenbach DA, and Bonventre JV. Mechanisms of maladaptive repair after AKI leading to accelerated kidney ageing and CKD. Nat Rev Nephrol. 2015;11(5):264–76. - PMC - PubMed

Publication types