[Preprint]. 2023 Oct 10:2023.10.09.561474.
doi: 10.1101/2023.10.09.561474.

Multidimensional Analysis of the Adult Human Heart in Health and Disease using Hierarchical Phase-Contrast Tomography (HiP-CT)

Affiliations

Multidimensional Analysis of the Adult Human Heart in Health and Disease using Hierarchical Phase-Contrast Tomography (HiP-CT)

J Brunet et al. bioRxiv. .

Update in

Abstract

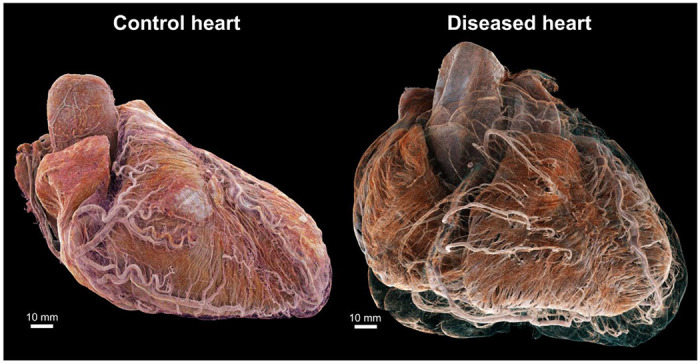
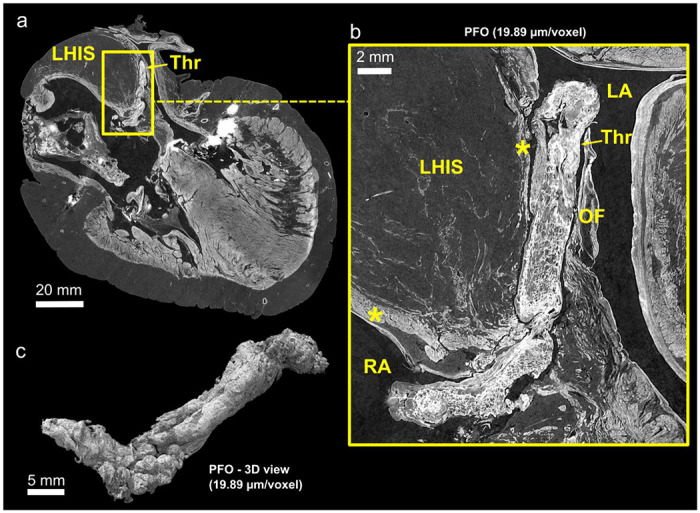
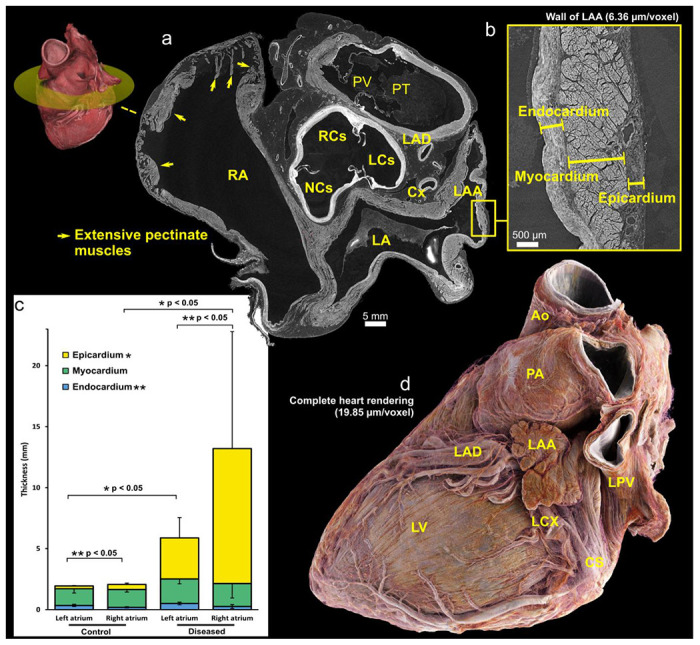
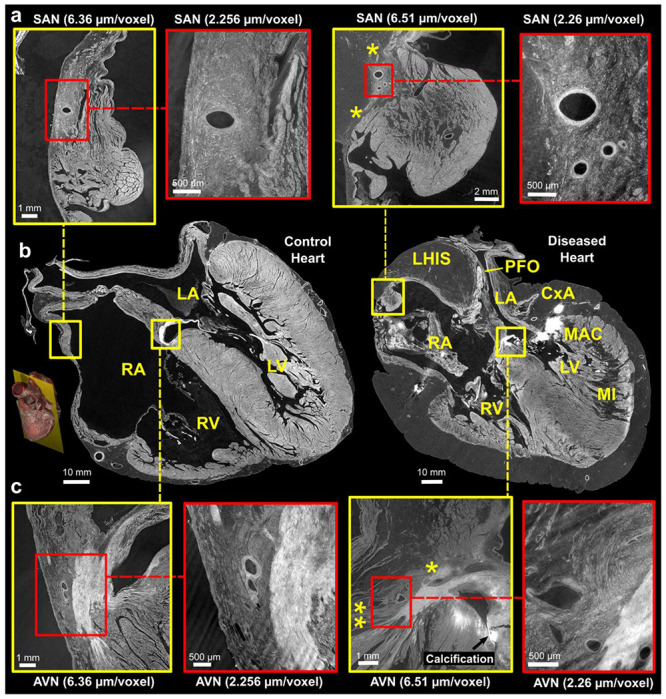
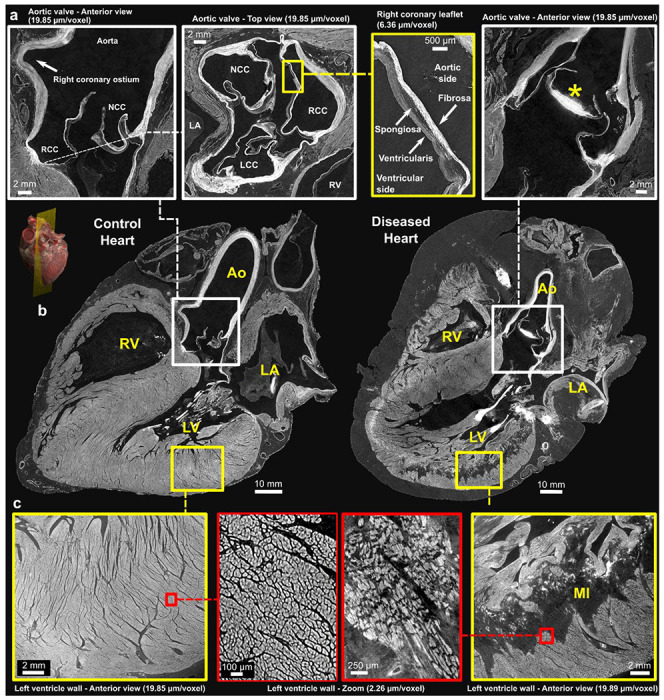
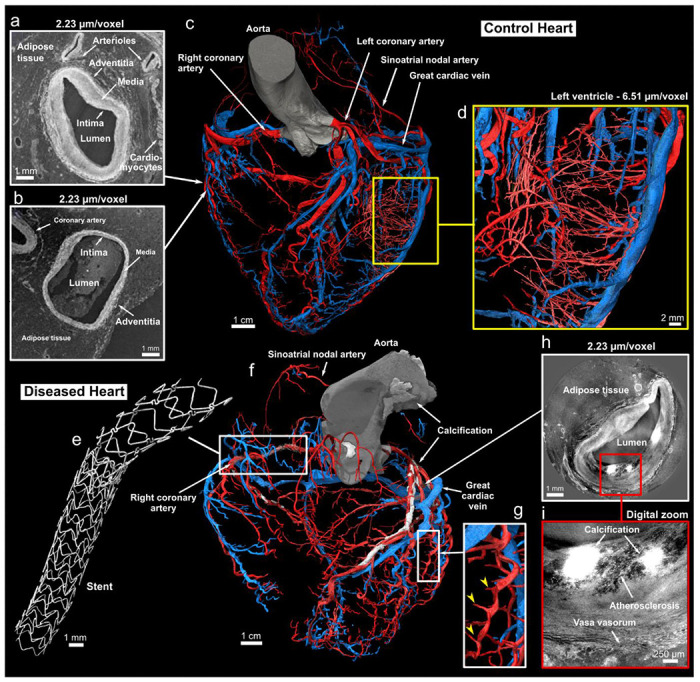
Cardiovascular diseases (CVDs) are a leading cause of death worldwide. Current clinical imaging modalities provide resolution adequate for diagnosis but are unable to provide detail of structural changes in the heart, across length-scales, necessary for understanding underlying pathophysiology of disease. Hierarchical Phase-Contrast Tomography (HiP-CT), using new (4th) generation synchrotron sources, potentially overcomes this limitation, allowing micron resolution imaging of intact adult organs with unprecedented detail. In this proof of principle study (n=2), we show the utility of HiP-CT to image whole adult human hearts ex-vivo: one 'control' without known cardiac disease and one with multiple known cardiopulmonary pathologies. The resulting multiscale imaging was able to demonstrate exemplars of anatomy in each cardiac segment along with novel findings in the cardiac conduction system, from gross (20 um/voxel) to cellular scale (2.2 um/voxel), non-destructively, thereby bridging the gap between macroscopic and microscopic investigations. We propose that the technique represents a significant step in virtual autopsy methods for studying structural heart disease, facilitating research into abnormalities across scales and age-groups. It opens up possibilities for understanding and treating disease; and provides a cardiac 'blueprint' with potential for in-silico simulation, device design, virtual surgical training, and bioengineered heart in the future.


Conflict of interest statement

Competing interests The authors declare no competing interests.

Figures

Fig. 1:
Fig. 1:
3D cinematic renderings of the normal (left) and abnormal (right) hearts in attitudinal position, i.e., as they would sit in the chest. The epicardial fat has been removed digitally to show the different course of the coronary vasculature between the two hearts. In the control, the coronary vasculature sits relatively close to the epicardial surface while in the disease heart, it is distant from the epicardium due to a thick layer of epicardial fat, while still being ‘anchored’ to the myocardium by smaller penetrating arteries. This gives rise to an unusual spiral configuration of the coronary arteries (see also Fig. 6g)
Figure 2:
Figure 2:
(a), Cross section of thrombus protruding through a patent foramen ovale in the diseased heart at 20 μm/voxel. The characteristic ‘hourglass-shaped’ due to the lipomatous hypertrophy of the atrial septum (LHAS) can be observed. (b), Digital zoom centred on the thrombus better showing its heterogeneous structure, and showing extra-cardiac fat distending the inter-atrial groove between two thin layers of atrial myocardium (yellow stars). (c), 3D view of the thrombus after segmentation. The cylindrical shape and heterogeneous structure is consistent with an organising, pre-mortem deep vein thrombus, which has embolised into the oval fossa LA - left atrium; RA - right atrium; LHIAS - Lipomatous Hypertrophy of the Inter-Atrial Septum; Thr – Thrombus; OF - Oval Fossa; * - atrial myocardium
Figure 3:
Figure 3:
(a), Short axis views of base of control heart with a 3D view indicating the location of the cross-section. (b) Cross-sections of high-resolution local tomography scans of the left atrial appendage wall of the control heart with a voxel size of 2.2 μm/voxel showing endocardial, myocardial and epicardial layers. (c), Graph showing 2D measurements of the atrial wall layers in left and right atria for both control and diseased hearts. The thickness measurements were obtained manually at ten distinct locations along the atrial wall. Statistical analysis revealed significant differences (p < 0.05) in the thickness of the left and right atrial endocardium for both control and diseased hearts. Similarly, significant differences (p < 0.05) in the epicardial thickness between control and diseased hearts were observed for both the left and right atria which may be due primarily to extent of epicardial fat. (d), 3D rendering of the control heart, with epicardial fat ‘removed’ digitally by thresholding images. The neck of the appendage can be seen running over the circumflex coronary artery – a key landmark for interventional closure of the left atrial appendage with devices used in the setting of atrial fibrillation, refractory to medical therapy for rate control, and with contra-indication to oral anticoagulants. CS – Coronary sinus; LA – Left atrium; LAA – Left atrial appendage; LAD – Left anterior descending (superior interventricular) coronary artery; LCS – Left coronary sinus; LCX – Left circumflex coronary artery; LV = Left ventricle; NCS – Non-coronary sinus; PA – Pulmonary artery; PT – Pulmonary trunk; PV – Pulmonary valve; RA – Right atrium; RCS – Right coronary sinus
Figure 4:
Figure 4:
Comparison of control and pathological hearts - (b) Four-chamber slices of at an imaging resolution of 20 ^m/voxel, with locations of the sinus node (SN) and atrioventricular nodes (AVN) highlighted. A 3D rendering provides a visualization of the imaging plane in which these views were created. Zoom images of the SAN and A VN, taken from adjacent slices, are shown in (a) and (c), respectively. The yellow squares indicate images captured at a resolution of 6.5 μm/voxel, while the red squares indicate images captured at a higher resolution of 2.2 μm/voxel. The yellow stars in the diseased heart SAN indicate attenuated connections with working atrial myocardium running from the side of the SAN through epicardial fat and in AVN indicate connections of AVN with RA vestibule (**potential slow pathway) and attenuated connection with atrial septum (* potential fast pathway). LA - Left Atrium, RA - Right Atrium, LV - Left Ventricle, RV - Right Ventricle, MI - Myocardial Infarction, MAC - Mitral Annular Calcification, LHIS - Lipomatous Hypertrophy of the Inter-Atrial Septum, PFO - Patent Foramen Ovale. Note: The left atrium appears collapsed in both hearts.
Figure 5:
Figure 5:
Comparison of control and pathological hearts – (b) Long-axis view of control and diseased hearts at imaging resolution of 20 μm/voxel. A 3D rendering provides a visualization of the imaging plane in which these views were created which is equivalent to a parasternal-long axis section. Zoomed-in images of the aortic valve and left ventricular wall are shown in (a) and (c), respectively. The yellow squares indicate images captured at a resolution of 6.5 μm/voxel, while the red squares indicate images captured at a higher resolution of 2.2 μm/voxel. The different layers of the aortic valve, the fibrosa, spongiosa, and ventricularis, can be clearly delimited along with calcification of the non-coronary leaflet in the diseased heart (*). The arrangement of the cardiomyocytes is also clearly seen in (c) with altered structure and darker areas consistent with replacement fibrosis within an extensive myocardial infarction. Ao - Aorta, LA - left Atrium, RA - Right Atrium, LV - left Ventricle, RV - Right Ventricle; MI - Myocardial Infarction, NCC - Non-Coronary Cusp, RCC - Right Coronary Cusp, LCC - Left Coronary Cusp. Note: The left atrium appears collapsed in both hearts.
Figure 6:
Figure 6:
Coronary arterial and venous system of the control and diseased hearts. (a) and (b), Cross-sections of high-resolution local tomography scans of the acute marginal artery in (a) and an acute marginal vein in (b) with a voxel size of 2.2 μm/voxel. The location of both cross-sections related to the arterial and venous coronary trees is indicated with the white arrows. Arrows indicate the layers composing the arterial and venous wall: the tunica intima, media, and adventitia. The darker tissue around the coronaries is adipose tissue, while the brighter tissue is myocytes. Segmentation of the control (c) and diseased (f) arterial (rendered in red) and venous (rendered in blue) coronary trees made from 20 μm/voxel HiP-CT images (anterior view). In (c), a yellow rectangle shows a digital zoom on the left ventricular wall with segmentation of the pre-capillary arterioles in the left ventricular free wall made from a local tomography scan with 6.5 μm/voxel. Arrows indicate main coronary arteries and veins. (d), Magnified view of the arteriolar segmentation in the left ventricular free wall. (e), Digital zoom on one of the two stents present in (f). (g), Digital zoom in (f) showing the marked spiral tortuosity of epicardial coronary arteries, the yellow arrows indicating how the penetrating coronary arteries act as anchor points. (h), Cross-sections of a high-resolution local tomography scan of the left descending coronary artery showing atherosclerosis with calcification. (i), Digital zoom in (h) to better show the atherosclerosis and calcification present in the arterial wall.

Similar articles

References

    1. Wilkins E, Wilson L, Wickramasinghe K, Bhatnagar P, Leal J, Luengo-Fernandez R, et al. European cardiovascular disease statistics 2017. Eur Heart Netw. 2017;
    1. Dieleman JL, Cao J, Chapin A, Chen C, Li Z, Liu A, et al. US Health Care Spending by Payer and Health Condition, 1996–2016. JAMA. 2020. Mar 3;323(9):863. - PMC - PubMed
    1. Zugwitz D, Fung K, Aung N, Rauseo E, McCracken C, Cooper J, et al. Mitral Annular Disjunction Assessed Using CMR Imaging. JACC Cardiovasc Imaging. 2022. Nov;15(11):1856–66. - PMC - PubMed
    1. Haugaa KH, Aabel EW. Mitral Annular Disjunction: Normal or Abnormal. JACC Cardiovasc Imaging. 2022. Nov;15(11):1867–9. - PubMed
    1. Dejea H, Bonnin A, Cook AC, Garcia-Canadilla P. Cardiac multi-scale investigation of the right and left ventricle ex vivo: a review. Cardiovasc Diagn Ther. 2020. Oct;10(5):1701–17. - PMC - PubMed

Publication types