[Preprint]. 2023 Oct 13:2023.10.13.561693.
doi: 10.1101/2023.10.13.561693.

Microbiota-dependent indole production is required for the development of collagen-induced arthritis

Affiliations

Microbiota-dependent indole production is required for the development of collagen-induced arthritis

Brenda J Seymour et al. bioRxiv. .

Update in

Abstract

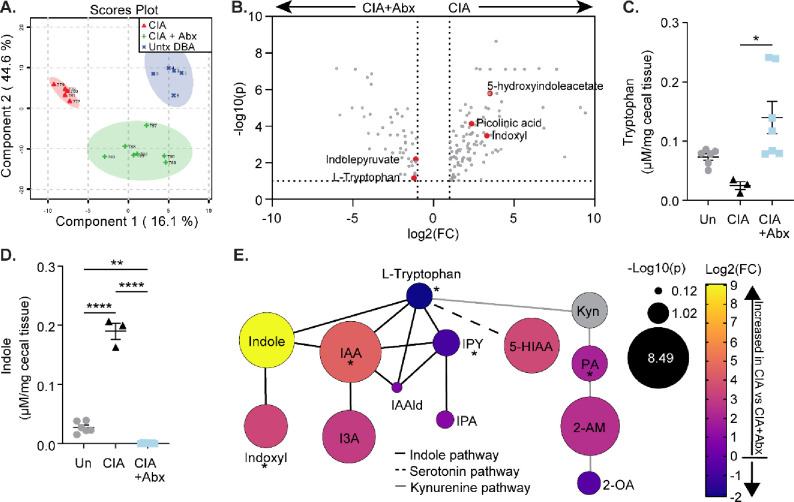
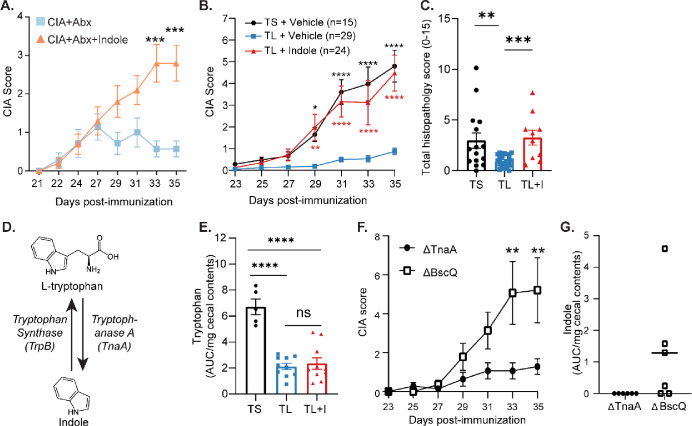
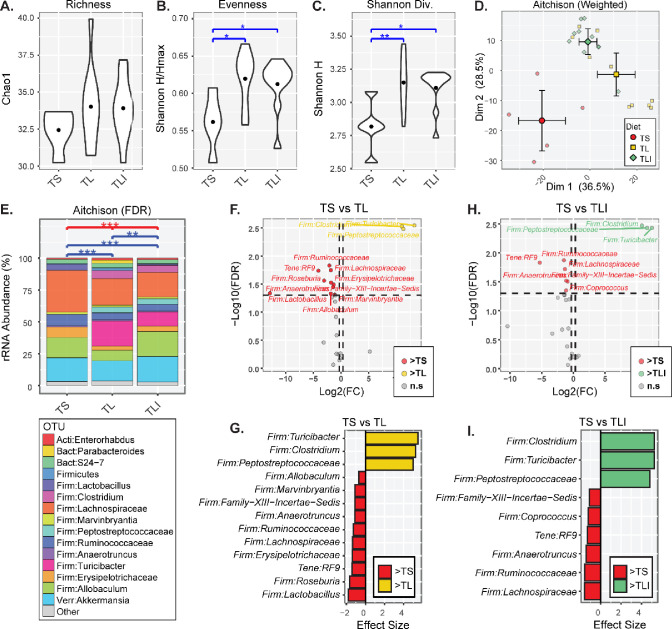
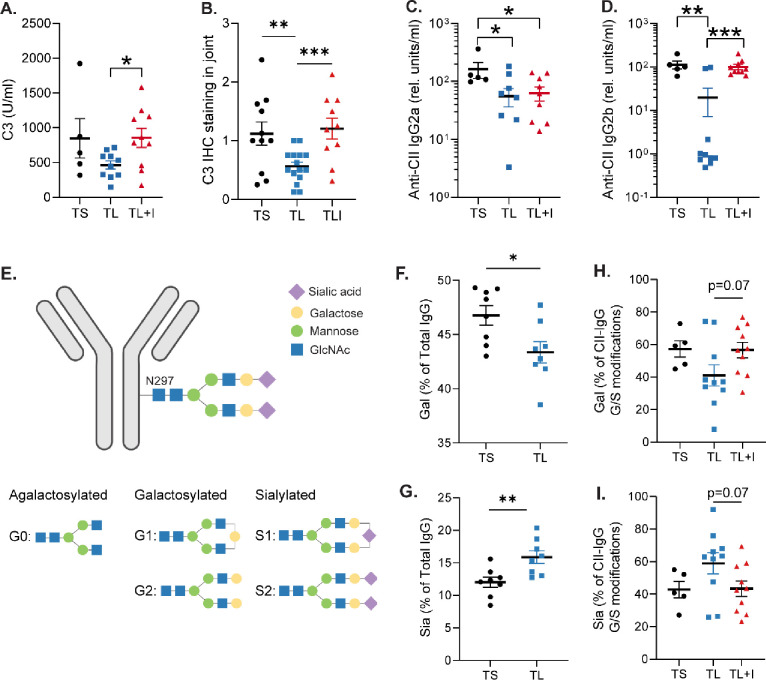
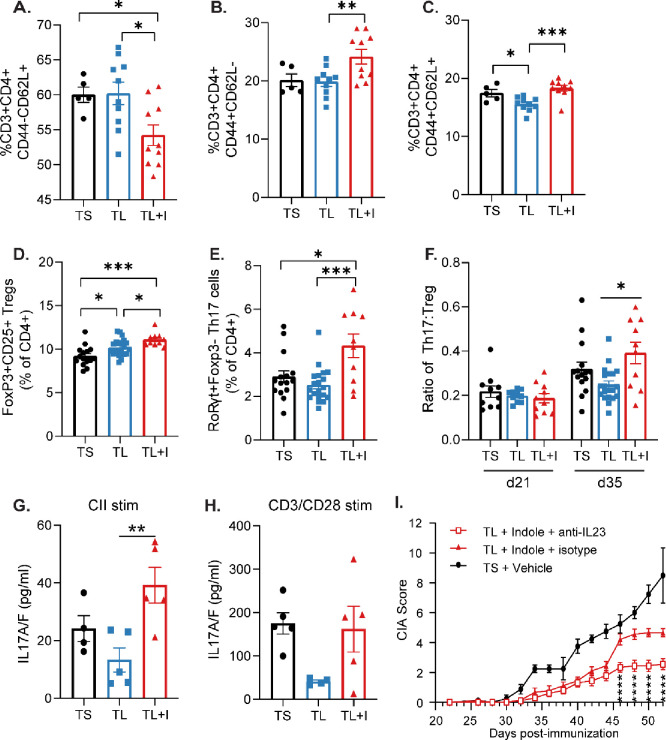
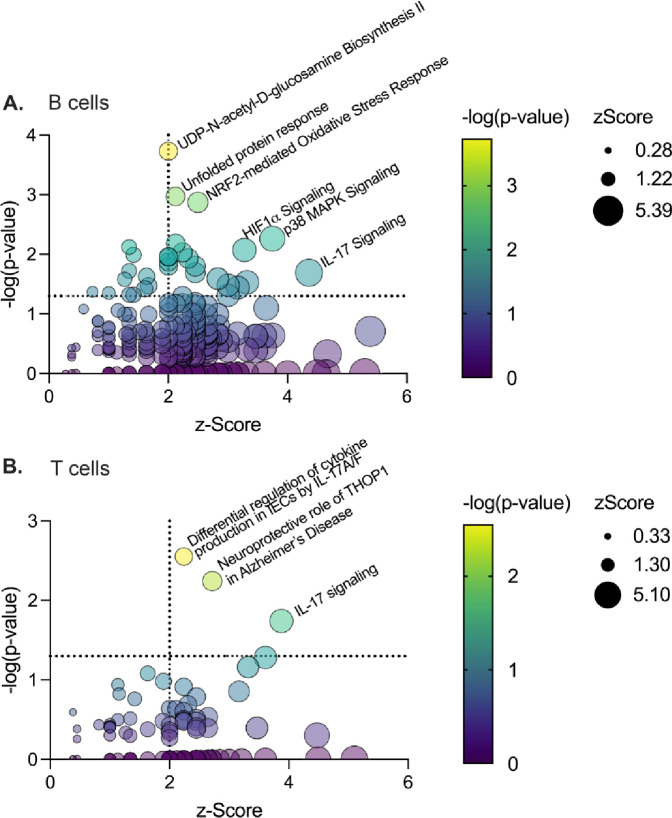
Altered tryptophan catabolism has been identified in inflammatory diseases like rheumatoid arthritis (RA) and spondyloarthritis (SpA), but the causal mechanisms linking tryptophan metabolites to disease are unknown. Using the collagen-induced arthritis (CIA) model we identify alterations in tryptophan metabolism, and specifically indole, that correlate with disease. We demonstrate that both bacteria and dietary tryptophan are required for disease, and indole supplementation is sufficient to induce disease in their absence. When mice with CIA on a low-tryptophan diet were supplemented with indole, we observed significant increases in serum IL-6, TNF, and IL-1β; splenic RORγt+CD4+ T cells and ex vivo collagen-stimulated IL-17 production; and a pattern of anti-collagen antibody isotype switching and glycosylation that corresponded with increased complement fixation. IL-23 neutralization reduced disease severity in indole-induced CIA. Finally, exposure of human colon lymphocytes to indole increased expression of genes involved in IL-17 signaling and plasma cell activation. Altogether, we propose a mechanism by which intestinal dysbiosis during inflammatory arthritis results in altered tryptophan catabolism, leading to indole stimulation of arthritis development. Blockade of indole generation may present a novel therapeutic pathway for RA and SpA.


Conflict of interest statement

Conflict-of-interest statement: the authors have declared that no conflict of interest exists.

Figures

Figure 1:
Figure 1:. Intestinal metabolomics profiling identifies microbiome-mediated alterations in the tryptophan pathway in mice with CIA.
CIA was induced in male 6-week-old DBA/1J mice and cecal contents were harvested at day 35 from mice with CIA (n=3–5), mice with CIA and depleted from microbiota by antibiotic administration after day 21 (CIA+Abx, n=7), or untreated DBA/1J mice (Un, n=5). (A-B) LC-MS/MS was used to screen 244 metabolites. (A) PLSDA plot of CIA vs CIA+Abx vs Un. (B) Volcano plot of CIA+Abx (left) vs CIA (right). (C-D) HPLC was used to quantify Trp pathway metabolites indicated on the y-axis in μM. All data were reported as individual mice (symbols) and mean ±SEM (bars) after normalization to weight (mg) of cecal contents. *, p<0.05; ***, p<0.001; ****, p<0.0001 as determined one-way ANOVA with Tukey’s multiple comparisons test. (E) Graphical representation of Trp metabolism pathways, showing Trp metabolites identified in the LC-MS/MS analysis (A-B) and HPLC analysis (C-D). Log2(fold change) was calculated for CIA vs CIA+Abx and is represented in color gradient from yellow (more increased in CIA) to blue (more increased in CIA+Abx). The size of each circle represents −log10(pvalue) of an unpaired t-test between CIA vs CIA+Abx. IAA, indole-3-acetic acid; I3A, indole-3-carboxaldehyde; IPY, indolepyruvate; IPA, indolepropionic acid; 5-HIAA, 5-hydroxyindoleacetate; Kyn, L-kynurenine; IAAld, indole-3-acetaldehyde; PA, picolinic acid; 2-AM, 2-aminomuconate; 2-OA, 2-oxoadipate. Asterisk (*) denotes trends in metabolites that were also observed in Isolate 7-colonized mice. Line color denotes pathway: black, indole; dashed, serotonin; grey, kynurenine.
Figure 2.
Figure 2.. Indole is required for CIA.
(A) CIA was induced in male 6-week-old DBA/1J mice. On days 21–35, mice were treated with antibiotics ± 0.1 mg/ml indole in the drinking water. N=10 (Abx+Indole); N=7 (CIA+Abx). (B) Male 6-week-old DBA/1J mice were fed a TL or TS diet starting at day −1 through the duration of the experiment. Following induction of CIA, mice were treated with indole (200μl of a 10mM solution) or vehicle control (0.33% methanol) by oral gavage every other day starting on day 0. Arthritis scores were assessed every other day from day 21–35. N=29 (TL+Vehicle); N=24 (TL+Indole); N=15 (TS+Vehicle) pooled from three independent experiments. Red asterisks: TL+Indole vs TL+Vehicle; black asterisks: TS+Vehicle vs TL+Vehicle. TS+Vehicle vs TL+Indole was not statistically significant. (C) The sum of the inflammation, pannus, and bone erosion score of H&E stained paws is plotted as the total histology score (maximum score of 15). N=10–20 from two independent experiments. (D) Schematic of Trp breakdown into indole by bacterial Tryptophanase A, and Trp synthesis from indole by bacterial Tryptophan synthase. (E) HPLC analysis of Trp in cecal contents from mice with CIA at day 35, plotted as area under the curve (AUC), normalized to weight (mg) of cecal contents. N=5–10 from one experiment. (F) Male 6-week-old germ-free DBA/1 mice were colonized with E. coli BW25113 mutants (ΔtnaA or ΔBcsQ) with 108 CFU by oral gavage on day −7 before CIA induction. N=7 per group. (G) HPLC analysis of indole in cecal contents from CIA mice colonized with either ΔtnaA or ΔBcsQ at CIA day 35. Indole levels were plotted as AUC/mg cecal content weight. Data are reported as mean ± SEM. *, p<0.05; **, p<0.01; ***, p<0.001; ****, p < 0.0001 as determined by two-way ANOVA with Bonferroni adjustment for multiple comparisons (A, B, F) and unpaired t-test (C, E, G).
Figure 3.
Figure 3.. Indole minimally affects bacterial dysbiosis imparted by a TL diet during CIA.
Male 6-week-old DBA/1J mice were fed a TL or TS diet starting at day −1 through the duration of the experiment. CIA was induced and indole (200ul of a 10mM solution) or vehicle control (0.33% methanol) was added by oral gavage every other day starting on day 0. On day 35, fecal pellets were harvested, genomic DNA isolated, and 16S rRNA sequencing was utilized to assess microbial diversity. (A-C) Alpha diversity indices are shown for each group (TS = TS+Vehicle (n=5); TL = TL+Vehicle (n=10); TLI = TL+Indole (n=10)). Differences between groups were assessed by ANOVA: *, p<0.05 and **,p<0.01. (D) PCoA in which smaller, lighter symbols represent individual mice and large, darker symbols represent group means + 95% confidence intervals for PC1 and PC2. (E) Bar charts showing mean distributions of taxa for each group. Taxa with relative abundances <1.0% were collapsed into the “Other” category to simplify the figure. Differences in beta-diversity between groups were assessed using PERMANOVA tests with the weighted Aitchison dissimilarity index: **, p<0.01; ***, p<0.001; and ****, p<0.0001. (F-I) Volcano and effect size plots generated by ANOVA-like differential expression (ALDEx2) analysis indicate taxa that were significantly enriched or depleted (FDR-corrected p-value < 0.05) in mice with CIA on one diet compared to another: TS+Vehicle vs TL+Vehicle (F-G), TL+Vehicle vs TL+Indole (H-I).
Figure 4.
Figure 4.. Indole alters the cytokine profile in CIA.
Male 6-week-old DBA/1J mice were fed a TL or TS diet starting at day −1 through the duration of the experiment. Following induction of CIA, mice were treated with indole (200μl of a 10mM solution) or vehicle control (0.33% methanol) by oral gavage every other day starting on day 0. (A-F) Terminal serum was collected at days 14, 21, and at the plateau of disease (day 35–50) from mice with CIA fed a TL or TS diet and treated with indole (200ul of a 10mM solution) or vehicle control (0.33% methanol) and analyzed by an 8-plex immunoassay (Mesoscale). To account for experiment-to-experiment variability, serum cytokine concentrations (as denoted on the y-axis) were normalized to the mean of the TS+Vehicle group for each experiment/timepoint. N=4–8 (day 14), 10 (day 21), and 16–28 (day 35–50) pooled from nine independent experiments and plotted as individual mice (symbols) and mean ±SEM (bars). *, p<0.05; **, p<0.01; ***, p<0.001 and ****, p<0.0001 by unpaired t-test.
Figure 5.
Figure 5.. Indole alters complement activation, IgG subclass, and glycosylation.
Male 6-week-old DBA/1J mice were fed a TL or TS diet starting at day −1 through the duration of the experiment. Following induction of CIA, mice were treated with indole (200μl of a 10mM solution) or vehicle control (0.33% methanol) by oral gavage every other day starting on day 0. (A) Day 35 serum was evaluated by ELISA for C3 binding to anti-CII IgG. N=5–10 from one independent experiment. (B) FFPE joints were stained for complement C3 by immunohistochemistry and staining intensity was scored. Each datapoint represents the average complement deposition score of all 4 paws for one mouse (maximum score = 3). N=10–20 per group pooled from two independent experiments. (C-D) Day 35 serum was evaluated by ELISA for anti-CII IgG2a (C) and anti-CII IgG2b (D). N=5–10 per group from one independent experiment. (E) Diagram of possible glycosylation patterns on N297 of the IgG Fc domain. Blue circles = N-acetylglucosamine; green circles = mannose; yellow circles = galactose; purple diamonds = sialic acid. (F-G) Total IgG was purified from serum and IgG glycosylation patterns were assessed by liquid chromatography with mass spectrometry (LC-MS/MS). % Galactosylation (Gal) and % Sialylation (Sia), were plotted, respectively. Galactosylation and Sialylation were calculated as a % of all glycoforms (G0, G1, G2, S1, and S2). N=10 per group from one independent experiment. (H-I) In a separate experiment, anti-CII IgG was purified using CII-linked CNBr Sepharose 4B beads. IgG glycosylation patterns were assessed by LC-MS/MS. Galactosylation and sialylation are potted as % of G1, G2, S1, and S2 glycoforms only. N=5–10 per group from one representative experiment. For all panels, values are plotted as individual mice (symbols) and mean ± SEM (bars). *, p<0.05; **, p<0.01; ***, p<0.001; ****, p < 0.0001 as determined by unpaired t-test.
Figure 6.
Figure 6.. Indole skews towards Th17 cells.
Male 6-week-old DBA/1J mice were fed a TL or TS diet starting at day −1 through the duration of the experiment. Following induction of CIA, mice were treated with indole (200μl of a 10mM solution) or vehicle control (0.33% methanol) by oral gavage every other day starting on day 0. Spleens were harvested at day 35 for analysis by flow cytometry. (A) Splenic Tnaïve (CD44−CD62L+) as % of CD4+ T cells. (B) Splenic Teffector (CD44+CD62L−) as % of CD4+ T cells. (C) Splenic TCM (CD44+CD62L+) as % of CD4+ T cells. N=5–10 per group from one independent experiment for panels A-C. (D) Splenic FoxP3+RORγt−CD25+ Tregs are plotted as the percent of total CD4+ T cells. (E) Splenic CD3+CD4+FoxP3−RORγt+ Th17 cells are plotted as the percent of total CD4+ T cells. (F) Ratio of splenic Th17 to Treg cells at CIA days 21 and 35. N=10–20 per group from two independent experiments (day 35) (panels D-F) and n=10 per group (day 21) from one independent experiment (Panel F). (G-H) Total splenocytes from CIA day 35 were harvested and re-stimulated with bovine type II collagen (G) or CD3/CD28 Dynabeads (H); supernatant was saved and IL17A/F was measured by MSD. N=5 per group from one independent experiment. (I) TL+Indole treated mice received IP injections of 100μg of anti-IL23p19 or isotype (anti-HRP) on CIA days 0, 7, 14, and 21 and CIA severity monitored. N=10 (TL+Indole+anti-IL-23), N=10 (TL+Indole+Isotype), and N=5 (TS+Vehicle). Asterisks show the comparison between TL+Indole+Isotype vs TL+Indole+anti-IL23. For all panels, values are plotted as individual mice (symbols) and mean ± SEM (bars). *, p<0.05; **, p<0.01; ***, p<0.001; ****, p < 0.0001 as determined by unpaired t-test (panels A-H) or two-way ANOVA with Bonferroni adjustment for multiple comparisons (panel I).
Figure 7.
Figure 7.. Indole-stimulated human intestinal cells also highlight changes in function.
LPMCs isolated from healthy human colon tissue were stimulated with 1 mM indole or vehicle for 4hr. CD19+ B cells and CD3+ T cells were flow sorted, and RNA was isolated for RNAseq. Differentially expressed pathways (indole vs vehicle) were identified with Ingenuity Pathway Analysis for (A) CD19+ B cells and (B) CD3+ T cells. N=5 paired samples.

References

    1. Yu X.-H., et al., Systematic Evaluation of Rheumatoid Arthritis Risk by Integrating Lifestyle Factors and Genetic Risk Scores. Frontiers in Immunology, 2022. 13. - PMC - PubMed
    1. Li Z., et al., Polygenic Risk Scores have high diagnostic capacity in ankylosing spondylitis. Annals of the Rheumatic Diseases, 2021. 80(9): p. 1168–1174. - PMC - PubMed
    1. Deane K.D., et al., Genetic and environmental risk factors for rheumatoid arthritis. Best Practice & Research Clinical Rheumatology, 2017. 31(1): p. 3–18. - PMC - PubMed
    1. Clemente J.C., Manasson J., and Scher J.U., The role of the gut microbiome in systemic inflammatory disease. Bmj, 2018. 360: p. j5145. - PMC - PubMed
    1. Maeda Y., et al., Dysbiosis Contributes to Arthritis Development via Activation of Autoreactive T Cells in the Intestine. Arthritis & Rheumatology, 2016. 68(11): p. 2646–2661. - PubMed

Publication types