[Preprint]. 2023 Oct 13:2023.10.12.562142.
doi: 10.1101/2023.10.12.562142.

Parkinsonism Sac domain mutation in Synaptojanin-1 affects ciliary properties in iPSC-derived dopaminergic neurons

Affiliations

Parkinsonism Sac domain mutation in Synaptojanin-1 affects ciliary properties in iPSC-derived dopaminergic neurons

Nisha Mohd Rafiq et al. bioRxiv. .

Update in

Abstract

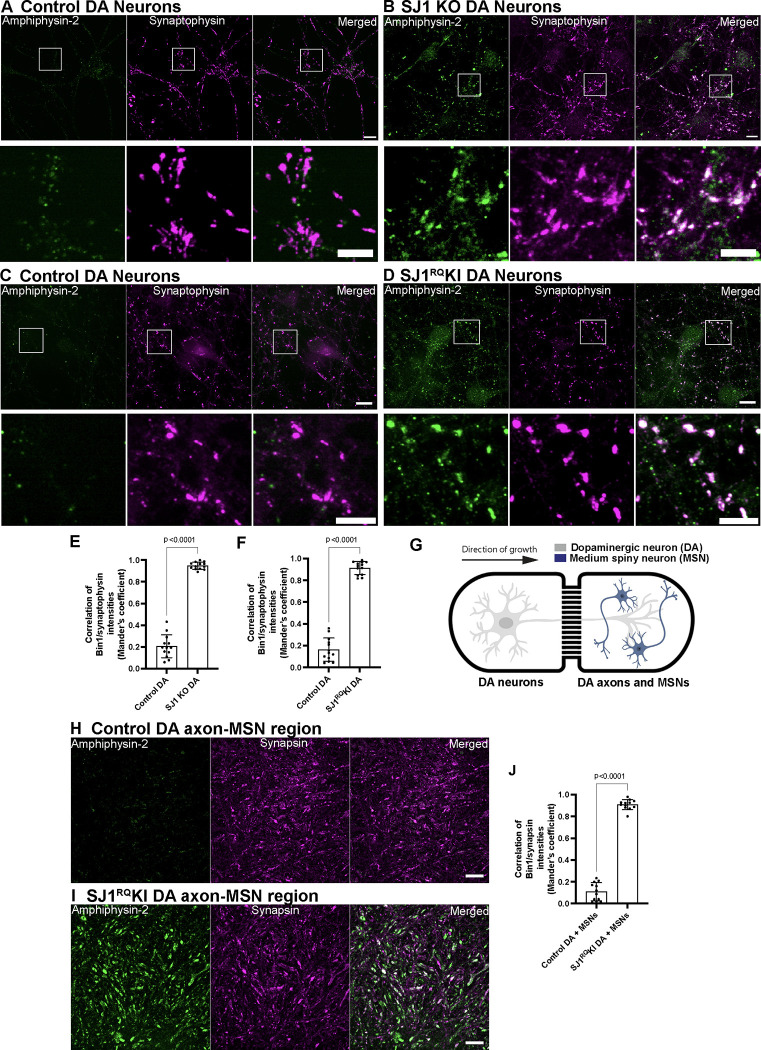
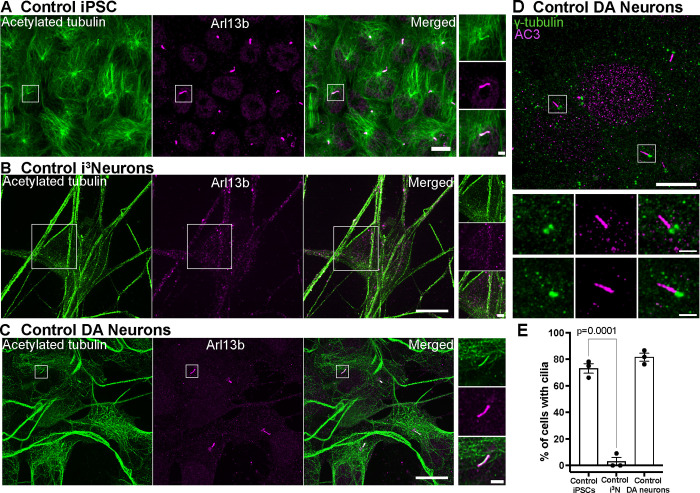
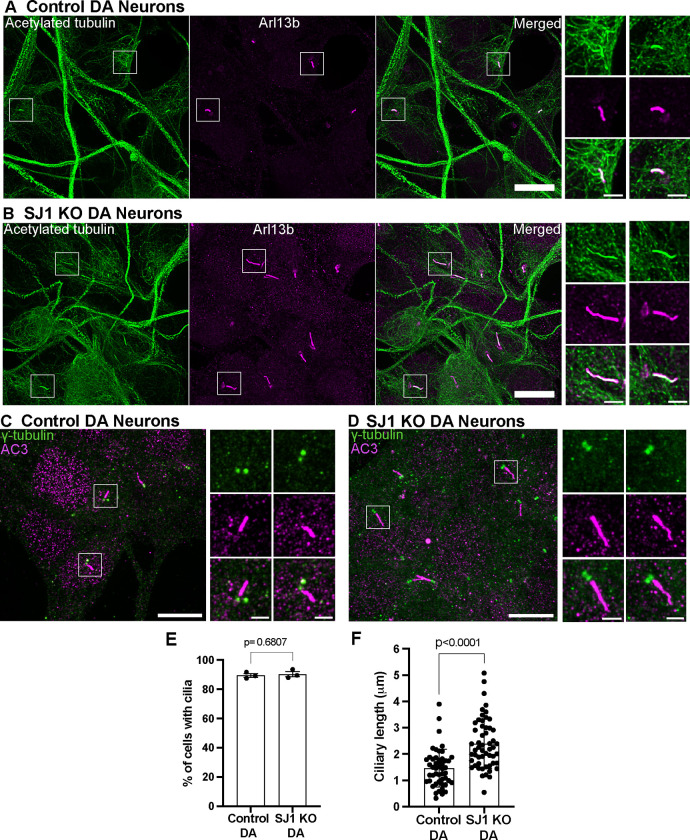
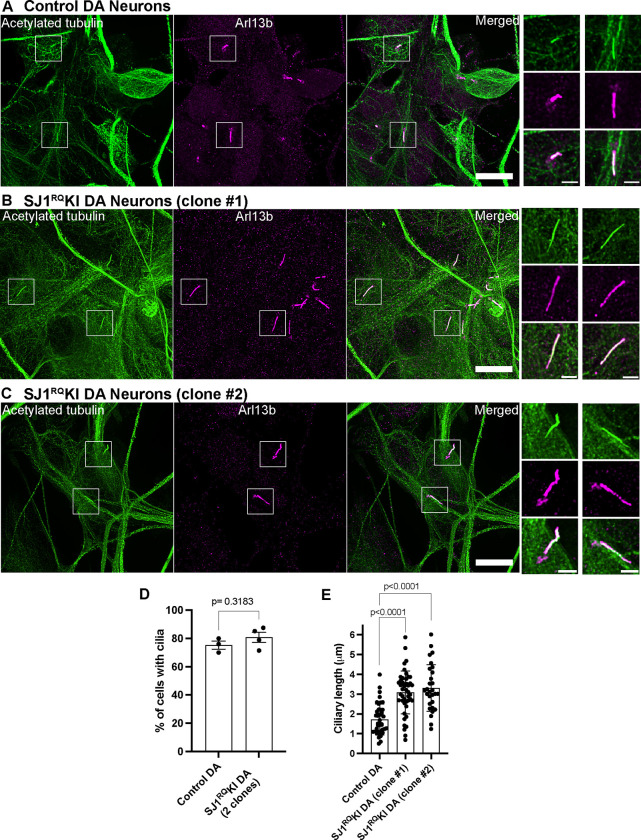
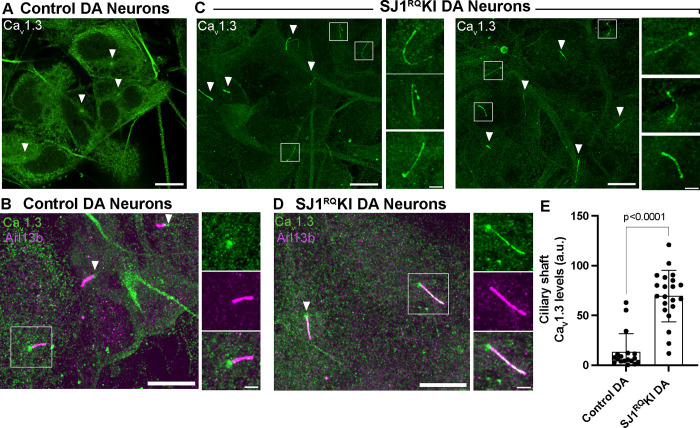
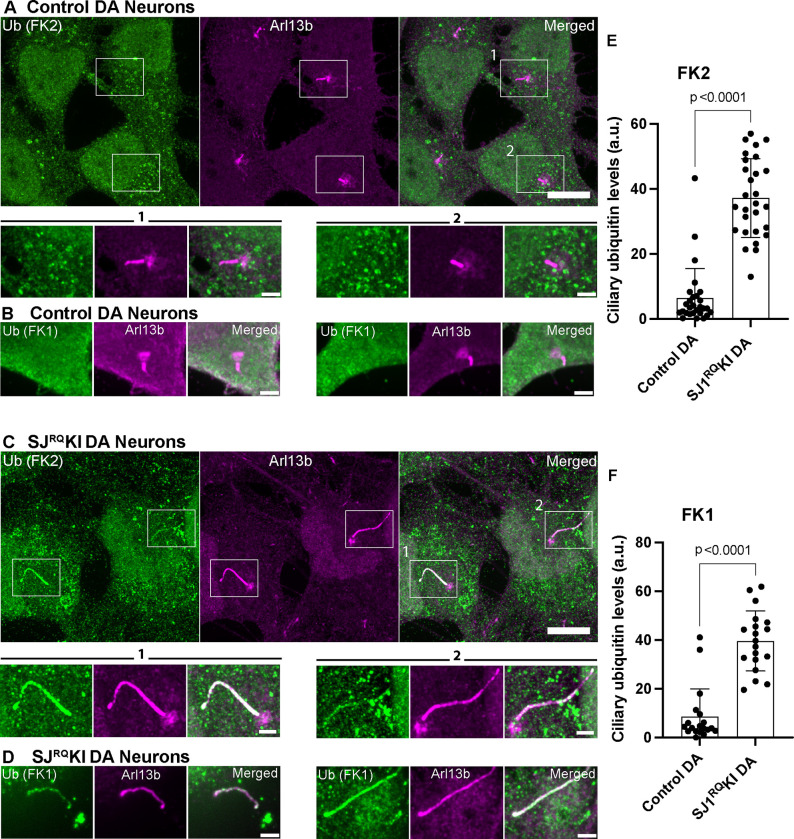
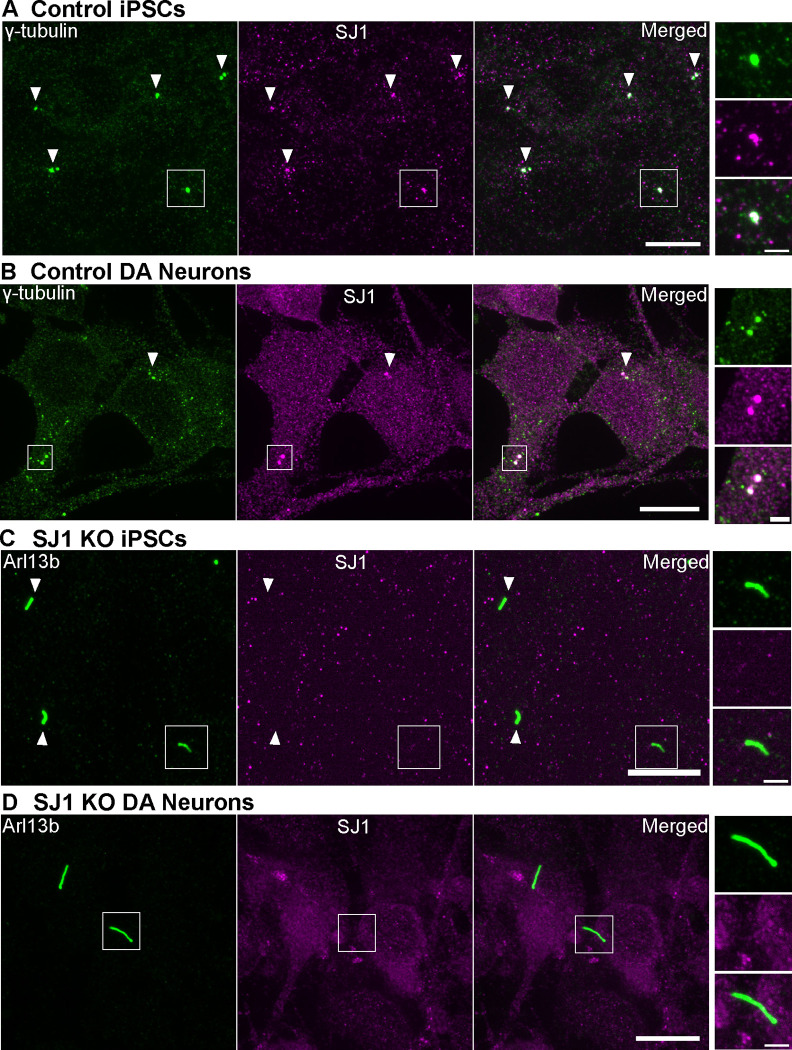
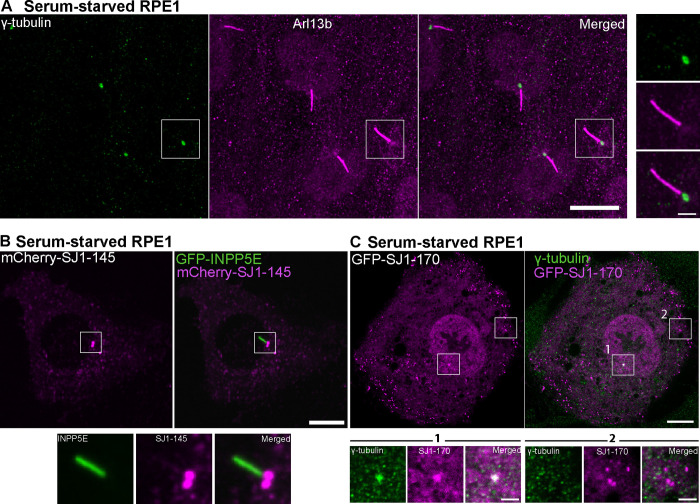
Synaptojanin-1 (SJ1) is a major neuronal-enriched PI(4,5)P2 4- and 5-phosphatase implicated in the shedding of endocytic factors during endocytosis. A mutation (R258Q) that impairs selectively its 4-phosphatase activity causes Parkinsonism in humans and neurological defects in mice (SJ1RQKI mice). Studies of these mice showed, besides an abnormal assembly state of endocytic factors at synapses, the presence of dystrophic nerve terminals selectively in a subset of nigro-striatal dopamine (DA)-ergic axons, suggesting a special lability of DA neurons to the impairment of SJ1 function. Here we have further investigated the impact of SJ1 on DA neurons using iPSC-derived SJ1 KO and SJ1RQKI DA neurons and their isogenic controls. In addition to the expected enhanced clustering of endocytic factors in nerve terminals, we observed in both SJ1 mutant neuronal lines increased cilia length. Further analysis of cilia of SJ1RQDA neurons revealed abnormal accumulation of the Ca2+ channel Cav1.3 and of ubiquitin chains, suggesting an impaired clearing of proteins from cilia which may result from an endocytic defect at the ciliary base, where a focal concentration of SJ1 was observed. We suggest that SJ1 may contribute to the control of ciliary protein dynamics in DA neurons, with implications on cilia-mediated signaling.

Keywords: Primary cilia; calcium signaling; centriole; neurodegenerative disease; ubiquitin.


Figures

Figure 1:
Figure 1:. SJ1 KO and SJ1RQKI iPSC-derived DA neurons show presynaptic clustering of amphiphysin-2
(A-D) Fluorescence images of control (A, C), SJ1 KO (B) and SJ1RQKI (D) DA neurons (day 50–55) immunolabeled with antibodies directed against amphiphysin-2 (green) and synaptophysin, a presynaptic marker, (magenta). SJ1 KO neurons and the corresponding controls are derived WTC11 iPSCs, while SJ1RQKI neurons and corresponding controls are derived from KOLF2.1 iPSCs (Scale bars, 10 μm). High magnifications of boxed areas are shown below each panel (Scale bars, 5 μm). Note the striking enhancement of amphiphysin-2 immunoreactivity that overlaps with synaptophysin-positive structures in SJ1 KO and SJ1RQKI DA neurons, relative to controls. (E and F) Quantification of amphiphysin-2 clustering intensities shown in A-D, represented as mean ± S.D., pooled from at least two independent experiments (n ≥ 10 cells per experiment). (G) Diagram showing a schematic view of iPSC-derived DA (day 55) and iPSC-derived medium spiny neurons (MSNs) (from Brainxell cells, day 7 post-thaw) co-cultured in the microfluidic device. (H and I) Immunofluorescence images of amphiphysin-2 (green) and synapsin (magenta) immunoreactivities in the MSN containing chamber of neuronal co-cultures generated with control (H) or SJ1RQKI DA neurons (I) (Scale bars, 10 μm). (J) Quantification of fluorescence intensity of amphiphysin-2 puncta in the MSN containing chamber (mean ± S.D. from two independent experiments; n ≥ 20 regions per experiment).
Figure 2:
Figure 2:. iPSC-derived DA neurons have primary cilia
(A-C) Fluorescence images of undifferentiated iPSCs (A), i3Neurons (day 19, B) and iPSC-derived DA neurons (day 30, D)(all from KOLF2.1 iPSCs) immunolabeled with antibodies directed against acetylated α-tubulin (green) and Arl13b (magenta)(Scale bars, 10 μm). High magnification images of the boxed areas in A-C are shown on the right (Scale bars, 2 μm). iPSCs have primary cilia but cilia are no longer present in i3Neurons, while they are still present in DA neurons. (D) Fluorescence images of DA neurons immunolabeled with antibodies against γ-tubulin (green) and the neuronal-specific primary cilia marker, adenylate cyclase type III (AC3, magenta), confirming the neuronal properties of these neurons. (F) Percentage of cells with cilia (mean ± S.E.M.) from three independent experiments; n ≥ 20 cells per experiment).
Figure 3:
Figure 3:. Abnormal ciliary length in SJ1 KO iPSC-derived DA neurons relative to control iPSC-derived DA neurons
(A-D) Fluorescence images of control (A and B) and SJ1 KO (C and D) DA neurons (day 30) immunolabeled with antibodies against acetylated α-tubulin (green), Arl13b (magenta) or γ-tubulin (green) and the neuronal-specific primary cilia marker, AC3 (magenta)(Scale bars, 10 μm). High magnification of the boxed areas in A-D are shown on the right of each panel (Scale bars, 2 μm). (E-F) Percentage of ciliated cells (E) and cilia length (F) of control and SJ1 KO DA neurons represented as mean ± S.D. (data pooled from three independent experiments; n ≥ 10 cells per experiment).
Figure 4:
Figure 4:. Abnormal ciliary length also in iPSC-derived SJ1RQKI iPSC-derived DA neurons
(A-D) Fluorescence images of control (A) and SJ1RQKI (B and C) DA neurons (day 30) derived from two KOLF2.1 iPSC clones immunolabeled with antibodies directed against acetylated α-tubulin (green) and Arl13b (magenta)(Scale bars, 10 μm). High magnifications of the boxed areas in A-C is shown on the right of each panels (Scale bars, 2 μm). (D and E) Percentage of ciliated cells (D) in control and SJ1RQKI DA neurons represented as mean ± S.E.M. (from three independent experiments in which control neurons were grown in parallel with either mutant clone or both clones) (n ≥ 10 cells per experiment). (E) Ciliary length of the same control and SJ1RQKI DA neurons used for panel D represented (mean ± S.D.) n ≥ 10 cells per experiment.
Figure 5:
Figure 5:. Accumulation of Cav1.3 in the ciliary shaft of SJ1RQKI iPSC-derived DA neurons
(A and B) Immunofluorescence images of control iPSC-derived DA neurons demonstrating that the shaft of cilia (labeled by Arl13b; magenta) is negative for Cav1.3, which only shows some accumulation at their base (arrowheads). (C and D) Immunofluorescence images of iPSC-derived SJ1RQKI DA neurons demonstrating robust labeling for Cav1.3 (green) along the shaft of Arl13b-positive (magenta) cilia. (Scale bars, 10 μm; cropped areas: 2 μm). (E) Quantification of ciliary Cav1.3 immunoreactivity on the ciliary shaft of control and SJ1RQKI DA neurons (mean ± S.D. pooled from three independent experiments; n ≥ 20 cells per experiment).
Figure 6:
Figure 6:. Accumulation of ubiquitin conjugates in cilia of iPSC-derived SJ1RQKI DA neurons
(A-C) Fluorescence images of control (A, B) and SJ1RQKI (C, D) DA neurons (day 30) immunolabeled with antibodies directed against lysine 63-linked ubiquitin chains (FK2 or FK1 antibodies, as indicated) (green) and Arl13b (magenta)(Scale bars, 10 μm). For FK2 both low and high magnifications of the boxed areas are shown (Scale bars, 2 μm) while for FK1 only high magnifications are shown. (E and F) Quantification of FK2 and FK1 immunoreactivities in the ciliary shaft of control and SJ1RQKI DA neurons. Results for FK2 reflect mean ± S.D. pooled from four independent experiments (n ≥ 15 cells per experiment). Results for FK1 reflect mean ± S.D. pooled from three independent experiments (n ≥ 15 cells per experiment).
Figure 7:
Figure 7:. Presence of a pool of SJ1 at the ciliary base of iPSCs and iPSC-derived DA neurons
(A and B) Fluorescence images of control (A) iPSCs and (B) iPSC-derived DA neurons immunolabeled with antibodies directed against γ-tubulin (green) and SJ1 (magenta) showing overlap of spots of SJ1 immunoreactivity in control but not in SJ1 KO cells. (C and D) Fluorescence image of SJ1 KO iPSCs and iPSC-derived SJ1 KO DA neurons (day 30) immunolabeled with antibodies against Arl13b (green) and SJ1 (magenta) showing lack of SJ1 staining at the base of cilia. High magnifications of boxed areas in (A-D) are shown at right. (Scale bars, 10 μm; cropped areas: 2 μm).
Figure 8:
Figure 8:. Exogenously expressed tagged-SJ1 labels the base of cilia
(A) Fluorescence image of RPE1 serum-starved for 48 hours and immunolabeled with antibodies against γ-tubulin (green) and Arl13b (magenta) show primary cilia assemblies. (B) Live fluorescence image of serum-starved RPE1 cell expressing mCherry-SJ1-145 (neuronal isoform, magenta) and GFP-INPP5E (green, a ciliary marker) showing localization of SJ1 at the ciliary base. The boxed area is shown at high magnification below the main figure. (C) Fluorescence image of serum-starved RPE1 expressing GFP-SJ1-170 (non-neuronal isoform, magenta) and immunolabeled with antibodies against γ-tubulin (green) showing overlap of the two proteins on a single perinuclear spot (boxed area 1). Boxed area 2 shows that while puncta of GFP-SJ1-170 are also observed elsewhere in the cell, these puncta do not overlap with g-tubulin. (Scale bars, 10 μm; cropped areas: 2 μm).

Similar articles

References

    1. Alessi D. R. and Sammler E. (2018). “LRRK2 kinase in Parkinson’s disease.” Science 360(6384): 36–37. - PubMed
    1. Anvarian Z., Mykytyn K., Mukhopadhyay S., Pedersen L. B. and Christensen S. T. (2019). “Cellular signalling by primary cilia in development, organ function and disease.” Nat Rev Nephrol 15(4): 199–219. - PMC - PubMed
    1. Bartolome A., Heiby J. C., Dau T., Fraia D. D., Heinze I., Kirkpatrick J. M. and Ori A. (2022). “ProteasomeID: quantitative mapping of proteasome interactomes and substrates for in vitro and in vivo studies.” bioRxiv: 2022.2008.2009.503299.
    1. Bielas S. L., Silhavy J. L., Brancati F., Kisseleva M. V., Al-Gazali L., Sztriha L., Bayoumi R. A., Zaki M. S., Abdel-Aleem A., Rosti R. O., Kayserili H., Swistun D., Scott L. C., Bertini E., Boltshauser E., Fazzi E., Travaglini L., Field S. J., Gayral S., Jacoby M., Schurmans S., Dallapiccola B., Majerus P. W., Valente E. M. and Gleeson J. G. (2009). “Mutations in INPP5E, encoding inositol polyphosphate-5-phosphatase E, link phosphatidyl inositol signaling to the ciliopathies.” Nat Genet 41(9): 1032–1036. - PMC - PubMed
    1. Blauwendraat C., Nalls M. A. and Singleton A. B. (2020). “The genetic architecture of Parkinson’s disease.” Lancet Neurol 19(2): 170–178. - PMC - PubMed

Publication types