[Preprint]. 2023 Oct 9:2023.10.06.561062.
doi: 10.1101/2023.10.06.561062.

TMEM65 regulates NCLX-dependent mitochondrial calcium efflux

Affiliations

TMEM65 regulates NCLX-dependent mitochondrial calcium efflux

Joanne F Garbincius et al. bioRxiv. .

Update in

  • TMEM65 regulates and is required for NCLX-dependent mitochondrial calcium efflux.
    Garbincius JF, Salik O, Cohen HM, Choya-Foces C, Mangold AS, Makhoul AD, Schmidt AE, Khalil DY, Doolittle JJ, Wilkinson AS, Murray EK, Lazaropoulos MP, Hildebrand AN, Tomar D, Elrod JW. Garbincius JF, et al. Nat Metab. 2025 Apr;7(4):714-729. doi: 10.1038/s42255-025-01250-9. Epub 2025 Apr 8. Nat Metab. 2025. PMID: 40200126 Free PMC article.

Abstract

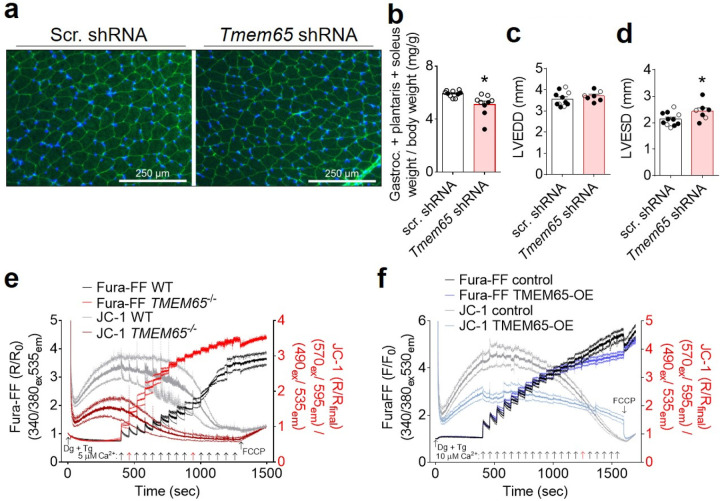
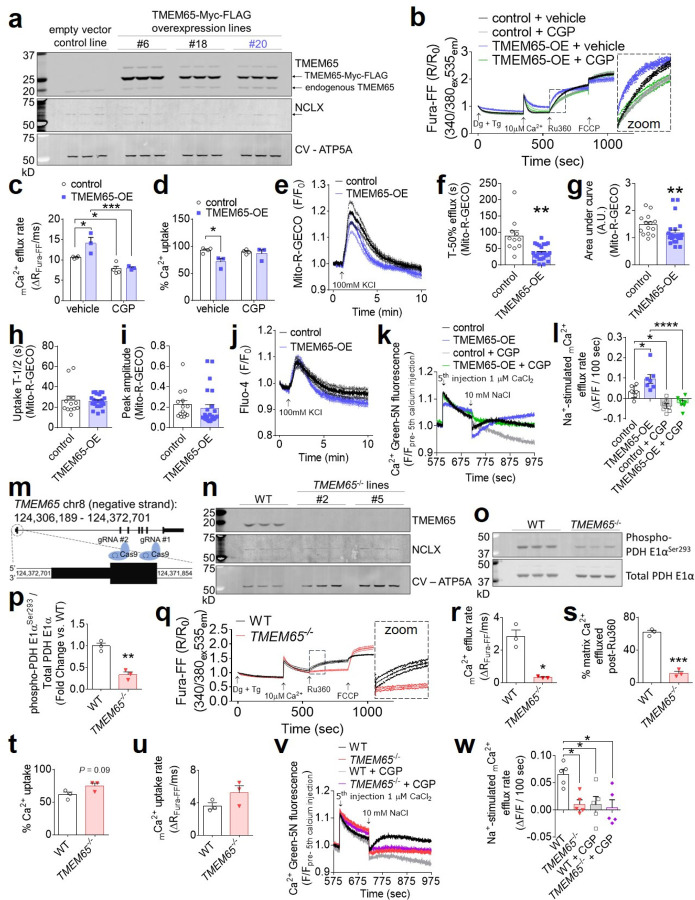
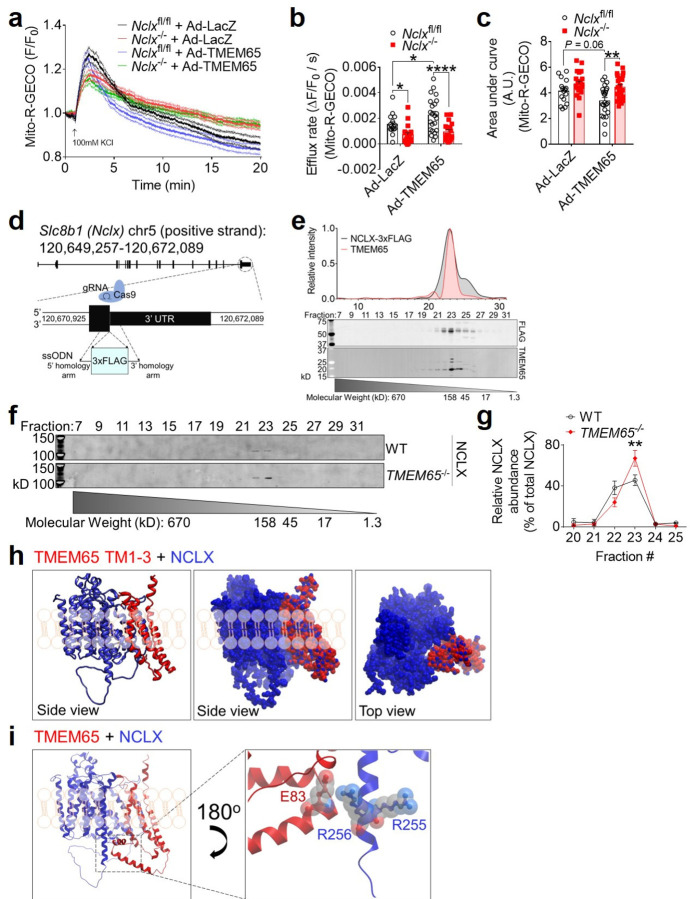
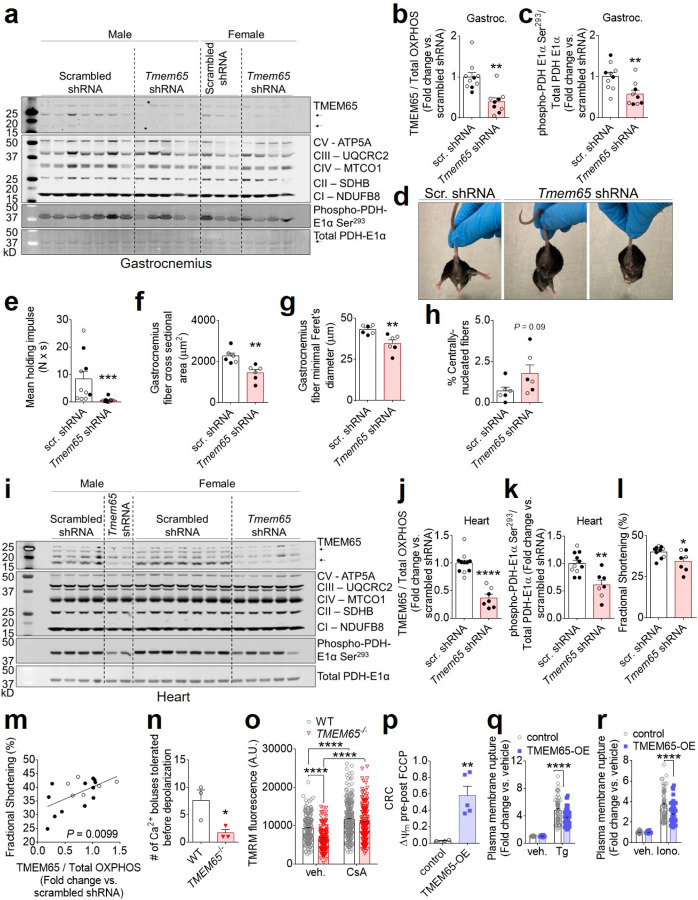
The balance between mitochondrial calcium (mCa2+) uptake and efflux regulates ATP production, but if perturbed causes energy starvation or mCa2+ overload and cell death. The mitochondrial sodium-calcium exchanger, NCLX, is a critical route of mCa2+ efflux in excitable tissues, such as the heart and brain, and animal models support NCLX as a promising therapeutic target to limit pathogenic mCa2+ overload. However, the mechanisms that regulate NCLX activity remain largely unknown. We used proximity biotinylation proteomic screening to identify the NCLX interactome and define novel regulators of NCLX function. Here, we discover the mitochondrial inner membrane protein, TMEM65, as an NCLX-proximal protein that potently enhances sodium (Na+)-dependent mCa2+ efflux. Mechanistically, acute pharmacologic NCLX inhibition or genetic deletion of NCLX ablates the TMEM65-dependent increase in mCa2+ efflux. Further, loss-of-function studies show that TMEM65 is required for Na+-dependent mCa2+ efflux. Co-fractionation and in silico structural modeling of TMEM65 and NCLX suggest these two proteins exist in a common macromolecular complex in which TMEM65 directly stimulates NCLX function. In line with these findings, knockdown of Tmem65 in mice promotes mCa2+ overload in the heart and skeletal muscle and impairs both cardiac and neuromuscular function. We further demonstrate that TMEM65 deletion causes excessive mitochondrial permeability transition, whereas TMEM65 overexpression protects against necrotic cell death during cellular Ca2+ stress. Collectively, our results show that loss of TMEM65 function in excitable tissue disrupts NCLX-dependent mCa2+ efflux, causing pathogenic mCa2+ overload, cell death and organ-level dysfunction, and that gain of TMEM65 function mitigates these effects. These findings demonstrate the essential role of TMEM65 in regulating NCLX-dependent mCa2+ efflux and suggest modulation of TMEM65 as a novel strategy for the therapeutic control of mCa2+ homeostasis.

Keywords: NCLX; TMEM65; calcium; mitochondria; sodium.


Conflict of interest statement

Competing Interests: None

Figures

Extended Data Fig. 1:
Extended Data Fig. 1:. Validation of mitochondrial localization of NCLX-BioID2-HA fusion protein.
Western blots showing progressive digestion of mitochondria from AC16 cardiomyocytes expressing NCLX-BioID2HA with increasing concentrations of trypsin. Arrow indicates ~25-kD BioID2-HA moiety. WCL, whole cell lysate; Cyto, cytosolic fraction. CypD, cyclophilin D. O.M.M., outer mitochondrial membrane; I.M.M., inner mitochondrial membrane.
Extended Data Fig. 2:
Extended Data Fig. 2:. Effects of TMEM65 overexpression on mCa2+ and cytosolic Ca2+ handling.
a-b, Densitometric quantifications of western blots shown in Fig. 2a. c, Western blots for pyruvate dehydrogenase (PDH) phosphorylation status in control and stable TMEM65-Myc-FLAG overexpression lines (TMEM65-OE). d, Densitometric quantification of PDH phosphorylation normalized to total PDH. (n = 3/group; **P<0.01, ****P<0.0001 by one-way ANOVA with Dunnett’s post-hoc test). e, mCa2+ uptake rate for permeabilized cell experiments shown in Fig. 2b. (n = 4 for empty vector control, 3 for TMEM65-OE. **P<0.01 by one-way ANOVA with Sidak’s post-hoc test). f, Western blotting of AC16 cardiomyocytes transduced for 24 hours with adenovirus encoding human TMEM65. MOI, multiplicity of infection. Dashed line is to aid in visualizing separate conditions. g, Pooled traces for AC16 cardiomyocytes transduced with adenovirus encoding LacZ (Ad-LacZ) or human TMEM65 (Ad-TMEM65), showing extramitochondrial bath Ca2+ (Fura-FF). 4 million cells were permeabilized with digitonin (Dg) in the presence of thapsigargin (Tg), then administered a single 10µM Ca2+ bolus, with subsequent additions of the mitochondrial calcium uniporter inhibitor Ru360 and FCCP as indicated. (n = 3/group). Inset shows initial mCa2+ efflux phase. mCa2+ efflux rate over the first 25 seconds following addition of Ru360 (h); % of matrix Ca2+ effluxed post-Ru360 (i); and % net mCa2+ uptake following 10µM Ca2+ bolus (j). (n = 3/genotype; *P< 0.05 by unpaired t-test). k, Western blotting of C2C12 myoblasts transduced for 24 hours with adenovirus encoding human TMEM65. l, Pooled traces for 2million mouse C2C12 skeletal myoblasts with acute transduction of Ad-LacZ or Ad-TMEM65, in the presence or absence of the NCLX inhibitor CGP-37157 (CGP), showing extramitochondrial bath Ca2+ (Fura-FF) as in (g) (n = 3/group). mCa2+ efflux rate over the first 25 seconds following addition of Ru360 (m), % of matrix Ca2+ effluxed post-Ru360 (n); % net mCa2+ uptake following the 10µM Ca2+ bolus (o), and initial mCa2+ uptake rate for the first 25 seconds following the Ca2+ peak (p). (n = 3/group. ***P< 0.001, ****P<0.0001 vs. WT by two-way ANOVA with Sidak’s post-hoc test. All comparisons n.s. for panels o and p). Time to 50% decay (q) and half rise time (r) of KCl-evoked cytosolic Ca2+ transients as measured by Fluo-4 fluorescence in intact AC16 cardiomyocytes for experiment shown in Fig. 2j. (n= 9 cells/group. n.s. in all cases by unpaired t-test). s, peak amplitude of KCl-evoked cytosolic Ca2+ transients for experiment shown in Fig. 2j. (n = 9 cells/group. n.s. by Mann-Whitney test).
Extended Data Fig. 3:
Extended Data Fig. 3:. Validation of NCLX-3xFLAG mouse and stages in modeling TMEM65-NCLX interaction.
a, Chromatogram of sequencing confirming proper in-frame insertion of DNA encoding the NCX-3xFLAG epitope tag prior to the stop codon of the endogenous mouse Nclx gene. b, Genotyping gel showing pups heterozygous (+/-) or homozygous (+/+) for the 3xFLAG knock-in. c, Western blots validating solubilization and specific detection of NCLX-3xFLAG protein (arrow) in isolated adult mouse heart mitochondria. Amido black staining for total protein is shown as a loading control. d, Absorbance at 280nm for gel filtration standards separated by size-exclusion chromatography. e, Standard curve of elution fraction vs. known molecular weight for gel filtration standards separated by size-exclusion chromatography. The equation shows the fit of the standards to a one-phase exponential decay. f, In silico molecular modeling showing interactions between individual TMEM65 transmembrane (TM) domains (red) and NCLX (blue).
Extended Data Fig. 4:
Extended Data Fig. 4:. Phenotypic consequences of altered TMEM65 expression.
a, Representative images showing WGA labelling (green) and nuclear staining with DAPI (blue) in cross sections of the gastrocnemius muscle at 24 weeks of age. scr., scrambled. b, Total mass of the gastrocnemius + soleus + plantaris muscle, dissected as a unit, normalized to total body mass at 24 weeks of age. Open symbols represent male mice, filled symbols represent female mice. (n = 10 mice + scrambled shRNA, 9 mice + Tmem65 shRNA, *P<0.05 by unpaired t-test with Welch’s correction). Left ventricular end diastolic dimension (LVEDD) (c) and left ventricular end systolic dimension (LVESD) (d) as measured by echocardiography in mice at 6 weeks of age (n = 11 mice + scrambled shRNA, 7 mice + Tmem65 shRNA. *P<0.05 unpaired t-test). e, Pooled traces showing extramitochondrial bath Ca2+ (Fura-FF) and mitochondrial membrane potential (JC-1) in permeabilized WT and TMEM65−/− AC16 cardiomyocytes in response to repeated additions of 5µM Ca2+ (arrows). Red arrows indicate the Ca2+ bolus typically triggering permeability transition in each genotype. (n = 3 replicates/genotype). f, Pooled traces showing extramitochondrial bath Ca2+ (Fura-FF) and mitochondrial membrane potential (JC-1) in permeabilized control or TMEM65-OE AC16 cardiomyocytes in response to repeated additions of 10µM Ca2+ (arrows). Red arrow indicates Ca2+ bolus triggering permeability transition in control cells. (n = 4 replicates for empty vector controls, 5 replicates for TMEM65-OE).
Fig. 1:
Fig. 1:. In vitro proximity biotinylation screen identifies TMEM65 as a member of the NCLX interactome.
a, Schematic of human NCLX-BioID2-HA fusion protein. IMS, intermembrane space. b, Western blotting of cellular fractions of AC16 cardiomyocytes transiently transfected with a plasmid encoding NCLX-BioID2-HA. MCU and VDAC served as mitochondrial markers. WCL, whole cell lysate; Cyto, cytosolic fraction, Mito, mitochondrial fraction. c, Expression of BioID2-HA and NCLX-BioID2-HA fusion protein and resulting cellular biotinylation. d, Summary of mass spectrometry results from proximity biotinylation screen in AC16 cardiomyocytes. Overlapping region of Venn diagram represents known or predicted mitochondrial proteins according to the IMPI, the biotinylation of which were enriched in NCLX-BioID2-HA samples compared to BioID2-HA negative controls. e, Immunofluorescence staining of AC16 cardiomyocytes transiently transfected with TMEM65-Myc-FLAG. Tom20 served as a mitochondrial marker. f, Western blots showing cellular fractionation and mitochondrial localization of exogenously expressed TMEM65-Myc-FLAG protein (arrows) in AC16 cardiomyocytes. g, Tmem65 mRNA expression in adult male (open symbols) and female (filled symbols) mouse tissues (n = 8 mice).
Fig. 2:
Fig. 2:. Gain of TMEM65 function enhances and loss of TMEM65 impairs sodium-dependent mitochondrial calcium efflux.
a, Western blotting of AC16 cardiomyocytes stably transduced with control empty vector or TMEM65-Myc-FLAG. Corresponding densitometric quantifications are shown in Extended Data Fig. 2 a–b. Line #20 (blue) was used in subsequent experiments. b, Pooled traces for AC16 cardiomyocytes with stable overexpression of TMEM65-Myc-FLAG (TMEM65-OE) or empty vector control, in the presence or absence of the NCLX inhibitor CGP-37157 (CGP), representing extramitochondrial bath Ca2+ (Fura-FF). 2 million cells were permeabilized with digitonin (Dg) in the presence of thapsigargin (Tg), then administered a single 10µM Ca2+ bolus, with subsequent additions of the mitochondrial calcium uniporter inhibitor Ru360 and FCCP as indicated. (n = 4 for control, 3 for TMEM65-OE). Inset shows initial mCa2+ efflux phase. mCa2+ efflux rate over the first 25 seconds following addition of Ru360 (c) and % net mCa2+ uptake following the 10µM Ca2+ bolus (d). (n = 4 for control, 3 for TMEM65-OE. *P< 0.05, **P<0.01, ***P< 0.001, by one-way ANOVA with Sidak’s post-hoc test). e, Pooled traces showing KCl-evoked mitochondrial Ca2+ transients as measured by Mito-R-GECO fluorescence in intact AC16 cardiomyocytes. (n = 14 cells for empty vector control, 24 cells for TMEM65-OE). f, Time to 50% efflux for mCa2+ transients (n = 11 cells for empty vector control, 24 cells for TMEM65-OE; **P< 0.01 by unpaired t-test with Welch’s correction). g, Area under the curve for mCa2+ transients (n = 14 cells for empty vector control, 24 cells for TMEM65-OE; **P< 0.01 by Mann-Whitney test). h, Half rise time of mCa2+ transients (n = 13 cells for empty vector control, 24 cells for TMEM65-OE, n.s. by Mann-Whitney test). i, Peak amplitude of mCa2+ transients. (n = 14 cells for empty vector control, 24 cells for TMEM65-OE, n.s. by Mann-Whitney test). j, Pooled traces showing KCl-evoked cytosolic Ca2+ transients as measured by Fluo-4 fluorescence in intact AC16 cardiomyocytes. (n = 9 cells/group). k, Mean of pooled traces for plate reader mCa2+ flux assays with permeabilized AC16 cells. Traces show extramitochondrial Ca2+ (Ca2+ Green 5N fluorescence), beginning with addition of the final of 5 consecutive 1-µM Ca2+ boluses, followed by stimulation of mCa2+ efflux by the addition of 10mM NaCl. GCP, CGP-37157. Error bars were omitted for clarity. (n = 7/group). l, Quantification of Na+-stimulated and CGP-sensitive mCa2+ efflux (n = 7/group, *P<0.05, ****P<0.001 by 1-way ANOVA with Tukey’s post-hoc test). m, Approach for CRISPR/Cas9-mediated disruption of TMEM65. n, Western blot confirming loss of TMEM65 protein expression in clonal AC16 cardiomyocyte lines following CRISPR/Cas9-mediated gene editing. o, Western blots for pyruvate dehydrogenase (PDH) phosphorylation status in wild-type (WT) and TMEM65−/− AC16 cardiomyocytes. p, Densitometric quantification of PDH phosphorylation normalized to total PDH. (n = 3/group; **P<0.01 by unpaired t-test). q, Pooled traces for WT and TMEM65−/− AC16 cardiomyocytes showing extramitochondrial bath Ca2+ (Fura-FF). 4 million cells were permeabilized with digitonin (Dg) in the presence of thapsigargin (Tg), then administered a single 10µM Ca2+ bolus, with subsequent additions of the mitochondrial calcium uniporter inhibitor Ru360 and FCCP as indicated. (n = 3/group). r, mCa2+ efflux rate over the first 25 seconds following addition of Ru360. (n = 3/group, *P<0.05 by unpaired t-test with Welch’s correction). Percent of matrix Ca2+ effluxed post-Ru360 (s); % net mCa2+ uptake following the 10µM Ca2+ bolus (t); and mCa2+ uptake rate over the first 25 seconds following the Ca2+ peak (u). (n = 3 group. ***P< 0.001 by unpaired t-test). v, Mean of pooled traces for plate reader mCa2+ flux assays with permeabilized AC16 cells as in (k). Error bars were omitted for clarity. (n = 5/group). w, Quantification of Na+-stimulated and CGP-sensitive mCa2+ efflux (n = 5/group, *P<0.05 by 1-way ANOVA with Tukey’s post-hoc test).
Fig. 3:
Fig. 3:. TMEM65 and NCLX interact functionally and physically.
a, Pooled traces showing KCl-evoked mCa2+ transients as measured by Mito-R-GECO fluorescence in intact Nclxfl/fl and Nclx−/− mouse embryonic fibroblasts after transduction with Ad-LacZ or Ad-TMEM65 (n = 16 cells for Nclxfl/fl + Ad-LacZ; 21 for Nclx−/− + Ad-LacZ; 23 for Nclxfl/fl + Ad-TMEM65; 24 for Nclx−/− + Ad-TMEM65). mCa2+ efflux rate measured over the first 60 seconds following the peak of the mitochondrial Ca2+ transient (b), and area under the curve (c) for mCa2+ transients shown in panel (a). (n = 16 cells for Nclxfl/fl + Ad-LacZ; 21 for Nclx−/− + Ad-LacZ; 23 for Nclxfl/fl + Ad-TMEM65; 24 for Nclx−/− + Ad-TMEM65; *P<0.05; **P<0.01; ****P<0.0001 by 2-way ANOVA with Sidak’s post hoc test). d, CRISPR-Cas9 knock-in strategy to insert a 3xFLAG epitope tag after the final sense codon of the mouse Slc8b1 gene. ssODN, single-stranded oligodeoxynucleotide. e, Western blotting showing molecular weight fraction distribution of NCLX-3xFLAG and TMEM65 after size-exclusion chromatography of isolated mouse heart mitochondria. Chromatogram and molecular weight standard curve for gel filtration standards of known molecular weight are shown in Extended Data Fig. 3d–e. f, Western blotting showing molecular weight fraction distribution of endogenous NCLX after size-exclusion chromatography of isolated WT and TMEM65−/− AC16 cardiomyocyte mitochondria. g, quantification of NCLX signal intensity across fractions shown in panel (f), normalized to total NCLX signal intensity. (n = 3 / genotype; **P<0.01 by 2-way ANOVA with Sidak’s post-hoc test. h, In silico molecular modeling showing predicted interaction between NCLX (blue) and the transmembrane domains (TM1–3) of TMEM65 (red). Modeling places NCLX adjacent to the longest transmembrane helix of NCLX, depicted in ribbon and space-filling views. i, Superimposing the structure of full-length, mature mitochondrial TMEM65 onto the model shown in panel (h) predicts electrostatic interaction between the soluble domain of TMEM65 and the positively-charged regulatory region of NCLX’s longest transmembrane helix that includes R255 and R256.
Figure 4:
Figure 4:. Loss of TMEM65 expression impairs striated muscle function and predisposes to mCa2+-overload-induced cell death, while TMEM65 overexpression protects against Ca2+-induced cell death.
a, Western blots confirming reduction in TMEM65 protein expression in gastrocnemius muscle of 24-week-old mice injected as neonates with AAV9-Tmem65 shRNA. Dashed lines are to aid in visualizing separate conditions. b, Densitometric quantification of gastrocnemius muscle TMEM65 expression, normalized to total OXPHOS complexes (CI-CV). Male mice are shown in open symbols, female mice are shown in filled symbols. scr., scrambled. (n = 10 mice + scrambled shRNA, 9 mice + Tmem65 shRNA, **P<0.01 by Mann-Whitney test). c, Densitometric quantification of gastrocnemius PDH phosphorylation normalized to total PDH. (n = 10 mice + scrambled shRNA, 9 mice + Tmem65 shRNA, **P<0.01 by unpaired t-test). d, Representative images showing abnormal hindlimb positioning and/or clasping in Tmem65 knockdown (KD) mice at 14 weeks of age. scr., scrambled. e, Mean holding impulse representing performance of mice on 4-limb wire hang test at 24 weeks of age. (n = 10 mice + scrambled shRNA, 9 mice + Tmem65 shRNA. ***P<0.001 by Mann-Whitney test). Fiber cross-sectional-area (f), minimal Feret’s diameter (g), and % centrally nucleated fibers (h) for the gastrocnemius muscle. (n = 6 mice / group. **P<0.01 by unpaired t-test). i, Western blots confirming reduction in TMEM65 protein expression in the hearts of Tmem65 KD mice at 6 weeks of age. Dashed lines are to aid in visualizing separate conditions. Densitometric quantification of heart TMEM65 expression, normalized to total OXPHOS complexes (CI-CV) (j), and densitometric quantification of heart PDH phosphorylation normalized to total PDH (k) (n = 11 mice + scrambled shRNA, 7 mice + Tmem65 shRNA. **P<0.01, ****P<0.0001 by unpaired t-test). l, Left ventricular fractional shortening measured by echocardiography in mice at 6 weeks of age (n = 11 mice + scrambled shRNA, 7 mice + Tmem65 shRNA. *P<0.05 by unpaired t-test). m, Linear regression showing positive correlation between left ventricular fractional shortening and TMEM65 protein expression, as measured in mice with scrambled shRNA (n = 11) and mice with Tmem65 shRNA (n = 7). n, Number of Ca2+ boluses tolerated prior to spontaneous mitochondrial depolarization and release of matrix Ca2+ for the calcium retention capacity assay in permeabilized AC16 cells shown in Extended Data Fig. 4e (n = 3/genotype. *P<0.05 by unpaired t-test). o, TMRM staining intensity as a marker of mitochondrial membrane potential in cells incubated acutely with vehicle (veh.) or cyclosporine A (CsA). (n = 170 cells for WT + vehicle; 140 cells for TMEM65−/− + vehicle; 225 cells for WT + CsA; 178 cells for TMEM65−/− + CsA. ****P<0.0001 by two-way ANOVA with Sidak’s post-hoc test). p, Magnitude of drop in JC-1 fluorescence ratio upon addition of FCCP, corresponding to mitochondrial membrane potential after the final Ca2+ addition, for calcium retention capacity (CRC) assay in permeabilized AC16 cells shown in Extended Data Fig. 4f. (n = 4 replicates for empty vector control, 5 replicates for TMEM65-OE; **P<0.01 by unpaired t-test with Welch’s correction). q, Plasma membrane rupture as measured by Sytox green staining, as an indicator of cell death in response to 24-hour treatment with thapsigargin (Tg). (n = 56 for control + vehicle; 60/group for control + Tg, TMEM65-OE + vehicle, and TMEM65-OE + Tg; ****P<0.001 by 2-way ANOVA with Sidak’s post-hoc test). r, Plasma membrane rupture in response to 24-hour treatment with ionomycin (Iono.) (n =55 for control + vehicle; 60/group for control + Iono., TMEM65-OE + vehicle, and TMEM65-OE + Iono.; ****P<0.001 by 2-way ANOVA with Sidak’s post-hoc test).

References

    1. Palty R. et al. NCLX is an essential component of mitochondrial Na+/Ca2+ exchange. Proceedings of the National Academy of Sciences of the United States of America 107, 436–441, doi:10.1073/pnas.0908099107 (2010). - DOI - PMC - PubMed
    1. Palty R. et al. Lithium-calcium exchange is mediated by a distinct potassium-independent sodium-calcium exchanger. J Biol Chem 279, 25234–25240, doi:10.1074/jbc.M401229200 (2004). - DOI - PubMed
    1. Luongo T. S. et al. The mitochondrial Na(+)/Ca(2+) exchanger is essential for Ca(2+) homeostasis and viability. Nature 545, 93–97, doi:10.1038/nature22082 (2017). - DOI - PMC - PubMed
    1. Jadiya P. et al. Neuronal loss of NCLX-dependent mitochondrial calcium efflux mediates age-associated cognitive decline. iScience 26, 106296, doi:10.1016/j.isci.2023.106296 (2023). - DOI - PMC - PubMed
    1. Garbincius J. F. et al. Enhanced NCLX-dependent mitochondrial Ca(2+) efflux attenuates pathological remodeling in heart failure. Journal of molecular and cellular cardiology 167, 52–66, doi:10.1016/j.yjmcc.2022.03.001 (2022). - DOI - PMC - PubMed

Publication types