[Preprint]. 2023 Oct 9:2023.10.09.561581.
doi: 10.1101/2023.10.09.561581.

A Cell Atlas of Thoracic Aortic Perivascular Adipose Tissue: a focus on mechanotransducers

Affiliations

A Cell Atlas of Thoracic Aortic Perivascular Adipose Tissue: a focus on mechanotransducers

Janice M Thompson et al. bioRxiv. .

Update in

Abstract

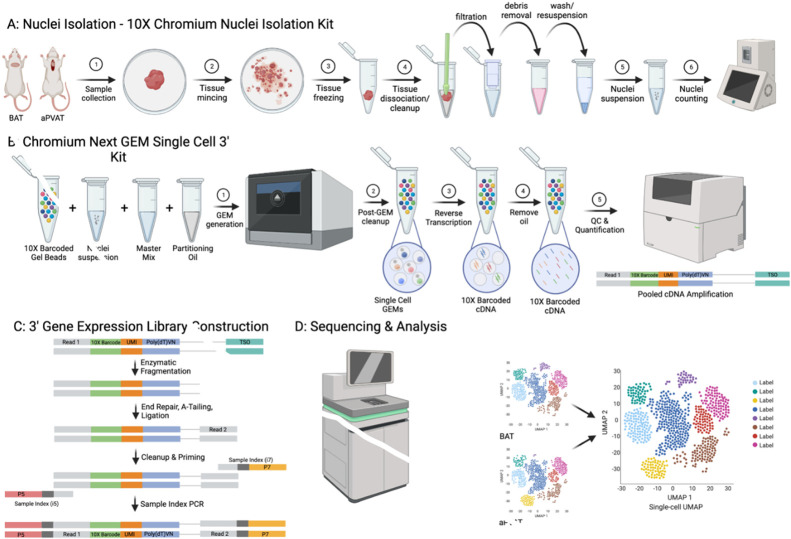
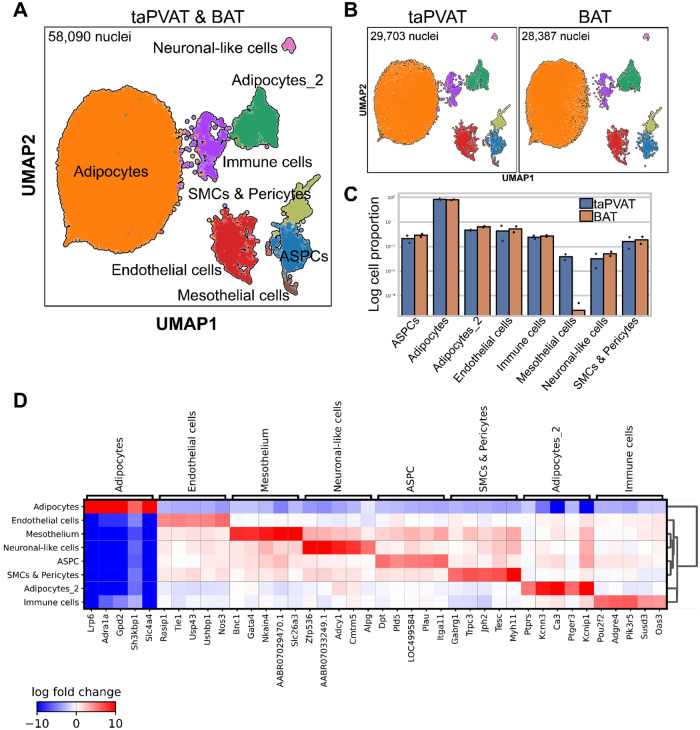
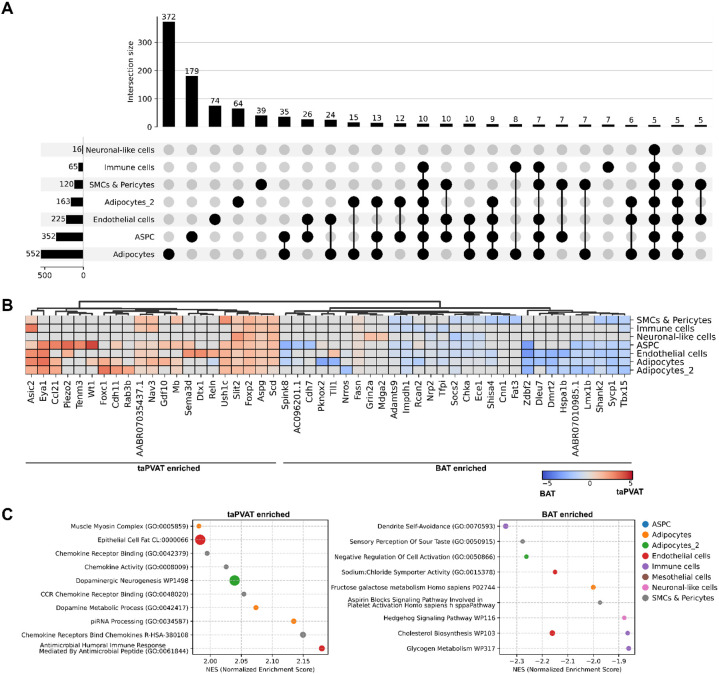
Perivascular adipose tissue (PVAT) is increasingly recognized for its function in mechanotransduction. To examine the cell-specificity of recognized mechanotransducers we used single nuclei RNA sequencing (snRNAseq) of the thoracic aorta PVAT (taPVAT) from male Dahl SS rats compared to subscapular brown adipose tissue (BAT). Approximately 30,000 nuclei from taPVAT and BAT each were characterized by snRNAseq, identifying 8 major cell types expected and one unexpected (nuclei with oligodendrocyte marker genes). Cell-specific differential gene expression analysis between taPVAT and BAT identified up to 511 genes (adipocytes) with many (≥20%) being unique to individual cell types. Piezo1 was the most highly, widely expressed mechanotransducer. Presence of PIEZO1 in the PVAT was confirmed by RNAscope® and IHC; antagonism of PIEZO1 impaired the PVAT's ability to hold tension. Collectively, the cell compositions of taPVAT and BAT are highly similar, and PIEZO1 is likely a mechanotransducer in taPVAT.

Keywords: Dahl SS rat; Perivascular adipose tissue; Piezo1; brown adipose tissue; mechanotransduction; single-nuclei RNA sequencing.


Conflict of interest statement

DECLARATION OF INTERESTS The authors declare no competing interests and no use of AI in the writing of this manuscript.

Figures

Figure 1.
Figure 1.. Procedure overview used to derive transcript data to inform cell-based clusters.
(A) Nuclear isolation from taPVAT and BAT from male Dahl SS rat. (B) Use of Chromium Next GEM Single Cell 3’ kit to produce amplified cDNA. (C) Construction of a 3’ gene expression library. (D) Sequencing and analyses of cell-based clusters (see STAR Methods for more details). All panels of the workflow overview figure were created using BioRender and some parts of the diagram were modified from the 10X Chromium Nuclei Isolation Kit and Chromium Next GEM Single Cell 3’ Kits user guide.
Figure 2.
Figure 2.. Characterization of the male Dahl SS rat taPVAT and BAT adipose tissue depots.
(A) UMAP visualization of nuclei from the taPVAT and BAT following integration using scVI and manual annotation of cell types. (B) UMAP visualization for nuclei from each individual adipose tissue depot. (C) Relative proportion of each cell type for each adipose tissue depot. Proportions are shown on a log scale for comparison of high abundance and low abundance cell types. Bars represent the mean values while individual points represent the proportions in individual samples. (D) Top 5 marker genes for each cell type (listed at top of diagram) identified common to both taPVAT and BAT.
Figure 3.
Figure 3.. Comparison of taPVAT and BAT adipose tissue depot gene expression.
(A) UpSet plot of differentially expressed genes (∣fold-change∣ ≥ 2, adjusted p-value ≤ 0.05) for individual cell types between taPVAT and BAT. The total number of differentially expressed genes for each cell type is shown as horizontal bars on the left and the intersecting list of differentially expressed genes for the cell types markers by a black dot is shown as vertical bar. (B) Heatmap of the top 5 taPVAT and BAT enriched genes. (C) Top 10 enriched functional groups determined using GSEApy (see STAR Methods) where a positive NES (top) represents taPVAT enriched functions and negative NES (bottom) represents BAT enriched functions.
Figure 4.
Figure 4.. Analysis of mechanotransduction related gene expression.
(A) Dot plot of the most highly expressed mechanotransduction genes in taPVAT and BAT. Dot size represents the percent of nuclei expressing the gene and the color intensity represents the expression level. The mesothelium of BAT is shaded in grey to indicate that values may appear higher than expected as only 1 nucleus was present for this tissue. (B) Cell-specific enrichment of mechanotransduction related GO terms (see STAR Methods). (C) UMAP visualization of expression for Ddr2, Slc12a2, Piezo1, and Piezo2. (D) Heatmap of fold-change for differentially expressed mechanotransduction related genes (∣fold-change∣ ≥ 2, adjusted p-value ≤ 0.05).
Figure 5.
Figure 5.. The mechanotransducer Piezo1 is expressed in and functionally serves PVAT of the thoracic aorta.
(A) Brightfield of Piezo1 mRNA ZZ-probe detection (RNAScope) in the thoracic aorta of the Dahl SS male rat. Arrows indicate positive dot detection. P = PVAT (anterior), A = adventitia, M = Media. Horizontal bar indicates 50 micrometers. To the right are tissue-specific positive (+) controls for housekeeping gene Peptidylprolyl isomerase B (PPIB) and negative (−) controls for bacterial gene Diaminopimelate (DapB). Images are representative of three male rats. (B) Fluorescent immunohistochemical detection of PVAT. Images of sections incubated with (1st full image) and without primary (2nd full image) PIEZO1 antibody. P = PVAT (anterior), M = Media, L = Lumen, E = Endothelium. Far right images are of the kidney nephron tubule epithelium staining for Piezo1 in the presence (top) and absence (bottom) of PIEZO1 primary antibody. Representative of three male rats. (C) Left: Representative tracing of the response of the aorta (top) or its surrounding ring of PVAT (bottom) to a 4 gram passive tension addition in the absence (black) or presence of PIEZO1 inhibitor GsMTx4 (5 μM). Right: Quantifies tension relaxed to after application of a baseline tension of 2 grams (no inhibitors present); after addition of 2 grams tension to achieve 4 grams total (after 1 hour incubation with vehicle/inhibitor); and after addition of 4 grams tension to achieve 8 grams total (after reincubation with vehicle/inhibitor). Bars are means ± SEM with individual scattered values. Asterisk (*) marks statistically significant (p<0.05) differences within group members as marked by lines.
Figure 6.
Figure 6.. Adipocyte stem and progenitor cells subtypes in PVAT from Dahl SS.
(A) Expression dot plot of ASPC marker genes Dcn, Fbn1, Cd34, and Pdgfra in individual cell types for taPVAT and BAT combined. The dot size represents the percent of genes expressing the gene while the color represents the mean expression. (B) UMAP visualization of re-integrated ASPCs as described in STAR Method. Nuclei were reclustered using Leiden clustering at a resolution of 0.1 identifying a total of 3 subpopulations. (C) Top 5 markers genes for each ASPC Leiden cluster with a minimum ∣fold-change∣ of 2. Only 2 genes met the threshold criteria for cluster 0. (D) Median expression and distribution of expression for previously identified markers Bmper, Pi16, and Gdf10 are shown as violin plots for each Leiden cluster identified in panel B. Piezo1 expression is also shown for each Leiden cluster.

References

    1. Soltis E.E., and Cassis L.A. (1991). Influence of perivascular adipose tissue on rat aortic smooth muscle responsiveness. Clin Exp Hypertens A 13, 277–296. 10.3109/10641969109042063. - DOI - PubMed
    1. Ahmad M.F., Ferland D., Ayala-Lopez N., Contreras G.A., Darios E., Thompson J., Ismail A., Thelen K., Moeser A.J., Burnett R., et al. (2019). Perivascular Adipocytes Store Norepinephrine by Vesicular Transport. Arterioscler Thromb Vasc Biol 39, 188–199. 10.1161/ATVBAHA.118.311720. - DOI - PMC - PubMed
    1. Szasz T., Bomfim G.F., and Webb R.C. (2013). The influence of perivascular adipose tissue on vascular homeostasis. Vasc Health Risk Manag 9, 105–116. 10.2147/VHRM.S33760. - DOI - PMC - PubMed
    1. Watts S.W., Flood E.D., Garver H., Fink G.D., and Roccabianca S. (2020). A New Function for Perivascular Adipose Tissue (PVAT): Assistance of Arterial Stress Relaxation. Sci Rep 10, 1807. 10.1038/s41598-020-58368-x. - DOI - PMC - PubMed
    1. Fitzgibbons T.P., Kogan S., Aouadi M., Hendricks G.M., Straubhaar J., and Czech M.P. (2011). Similarity of mouse perivascular and brown adipose tissues and their resistance to diet-induced inflammation. Am J Physiol Heart Circ Physiol 301, H1425–1437. 10.1152/ajpheart.00376.2011. - DOI - PMC - PubMed

Publication types