[Preprint]. 2023 Oct 10:2023.10.08.561337.
doi: 10.1101/2023.10.08.561337.

The fitness cost of spurious phosphorylation

Affiliations

The fitness cost of spurious phosphorylation

David Bradley et al. bioRxiv. .

Update in

  • The fitness cost of spurious phosphorylation.
    Bradley D, Hogrebe A, Dandage R, Dubé AK, Leutert M, Dionne U, Chang A, Villén J, Landry CR. Bradley D, et al. EMBO J. 2024 Oct;43(20):4720-4751. doi: 10.1038/s44318-024-00200-7. Epub 2024 Sep 10. EMBO J. 2024. PMID: 39256561 Free PMC article.

Abstract

The fidelity of signal transduction requires the binding of regulatory molecules to their cognate targets. However, the crowded cell interior risks off-target interactions between proteins that are functionally unrelated. How such off-target interactions impact fitness is not generally known, but quantifying this is required to understand the constraints faced by cell systems as they evolve. Here, we use the model organism S. cerevisiae to inducibly express tyrosine kinases. Because yeast lacks bona fide tyrosine kinases, most of the resulting tyrosine phosphorylation is spurious. This provides a suitable system to measure the impact of artificial protein interactions on fitness. We engineered 44 yeast strains each expressing a tyrosine kinase, and quantitatively analysed their phosphoproteomes. This analysis resulted in ~30,000 phosphosites mapping to ~3,500 proteins. Examination of the fitness costs in each strain revealed a strong correlation between the number of spurious pY sites and decreased growth. Moreover, the analysis of pY effects on protein structure and on protein function revealed over 1000 pY events that we predict to be deleterious. However, we also find that a large number of the spurious pY sites have a negligible effect on fitness, possibly because of their low stoichiometry. This result is consistent with our evolutionary analyses demonstrating a lack of phosphotyrosine counter-selection in species with bona fide tyrosine kinases. Taken together, our results suggest that, alongside the risk for toxicity, the cell can tolerate a large degree of non-functional crosstalk as interaction networks evolve.


Figures
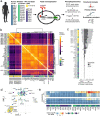
Figure 1
Figure 1. Expression of human tyrosine kinases in yeast and detection of their substrates using mass spectrometry.
a) Inducible expression of human tyrosine kinases from a genomic landing pad in S. cerevisiae, followed by data-independent acquisition (DIA) mass spectrometry. After phosphoproteomics, the impact of phosphorylation on protein structure, on fitness, and evolution is analysed. pY: full-length tyrosine kinase, pYd: tyrosine kinase domain, vSRC: WT VSRC and its mutants, pS/pT: full-length serine and threonine kinases. b) Correlated phosphorylation profiles (Pearson’s correlation coefficient) between all kinases tested, based upon the median phosphosite intensity (pS/pT/pY) across technical replicates. c) Number of up- and downregulated pY (dark grey) and pS/pT (light grey) sites per kinase. Up- and down-regulation for each WT kinase is with respect to the kinase-dead mutant. d) Separation of phosphorylation profiles (per kinase) in two dimensions using the tSNE dimensionality-reduction method e) Relative phosphosite abundance log2 (WT/dead) for each kinase, with respect to the phosphoacceptor identity (S, T, Y) and whether or not the phosphosite is a member of the core phosphoproteome in S. cerevisiae that is found to be phosphorylated in many conditions (Leutert et al, 2023).
Figure 2
Figure 2. Structural overview of spurious phosphorylation across the proteome
a) Use of AlphaFold2 structural models to calculate the relative solvent accessibility (RSA) and disorder of spurious phosphosites. b) The relative solvent accessibility (RSA) of spurious phosphosites generated by full-length tyrosine kinases (pY), tyrosine kinase domains (pYd), WT vSRC and vSRC mutants (vSRC), and the endogenous yeast pS/pT sites reported in (Leutert et al, 2023) (pST). The red dashed line corresponds to the cut-off for buried residues set at an RSA of 0.2 c) The percentage of phosphosites that map to ordered regions for the pY, pYd, vSRC, and pST groups. d) For each of the tested kinases, the number of spurious pY sites (WT-dead) predicted to destabilise the protein fold (intramolecular) or at least one protein-protein interface (intermolecular), on the basis of a ΔΔG threshold of 2 kcal/mol. e) For the pY, pYd, vSRC, and pST groups, the number of unique interfaces (per phosphosite) found in structural models (PDB, homology, or AF2) (left), or predicted from machine learning (right) (Meyer et al, 2018). f) Structural profile of all unique pY phosphosites detected in this study. g) The total number of unique pY sites that map to the protein kinase domain, represented by the AF2 model of the cyclin-dependent kinase Pho85. h) The total number of unique pY sites that map to the Ras GTPase domain (including predicted destabilising pY), represented by the AF2 model of Gsp1. i) The spurious phosphosite Rho1 pY71 is predicted to destabilise the Rho1-Sec3 interaction with a ΔΔG of 2.4 kcal/mol (PDB: 3a58).
Figure 3
Figure 3. Measuring the fitness effect of human kinase expression (WT-dead) in yeast.
a) Colony size is used as a proxy for fitness and the difference in area under the growth curve (AUC) between the WT kinase and the kinase-dead mutant is used to infer the fitness effect of spurious phosphorylation. b) The fitness for each kinase tested, represented by the WT-dead fitness defect across 41 conditions. More negative AUC values (WT-dead) indicate greater toxicity. The colours of the dots indicate the statistical significance of the fitness score: dark blue indicates P<0.001, light blue indicates P<0.05, and grey indicates non-significance c) volcano plot of WT-dead AUC (x-axis) against the FDR-adjusted p value for the significance of the difference between the WT and kinase-dead mutant. pY: full-length tyrosine kinase, pYd: tyrosine kinase domain, vSRC: vSRC and mutants, pST: serine/threonine kinases. d) correlation between WT-dead fitness inferred from colony sizes (x-axis), and relative growth between the kinase and empty landing-pad control (y-axis). The relative frequencies were log-scaled and taken at the final time point (72 hours) of the competition assay (see Methods). Strains that grow worse than the control have negative relative frequencies. e) correlation between the number of spurious pY (per kinase) and the minimum fitness (WT-dead) across conditions for all non-redundant kinases tested here f) correlation between the number of spurious pY (per kinase) and the minimum fitness (WT-dead) across conditions for WT vSRC and the vSRC mutants tested here g) scatter plot for the predicted effect of spurious pY on protein structure (ΔΔG) and predicted effect on the basis of sequence conservation (ΔΔE). More destabilising pY have higher ΔΔGs and and more conserved Y positions have values closer to 1. All unique spurious pY are included. h) distribution of stoichiometries for vSRC pY substrates (n=116) and EPHB1 pY substrates (n=122), where significant phosphosite regulation was inferred (q < 0.01, see Methods). i) For EPHB1, the predicted effect of spurious pY on protein structure (ΔΔG) and predicted effect on the basis of sequence conservation (ΔΔE) for all sites with inferred stoichiometries. Higher inferred stoichiometries are given in dark green and lower inferred stoichiometries are given in light green.
Figure 4
Figure 4. Conservation between spurious pY in yeast and native pY in human.
a) Human-yeast conservation at the whole protein level. ‘Yeast pY’ – number of unique spurious pY proteins in yeast, excluding any native pY proteins. ‘Yeast pY: human (observed)’ – number of observed unique spurious pY proteins in yeast with at least one ortholog in human. ‘Yeast pY: human (expected)’ – number of expected unique spurious pY proteins in yeast with at least one ortholog in human b) Human-yeast conservation at the level of whole protein pY phosphorylation. ‘Yeast pY: human’ – number of observed unique spurious pY proteins in yeast with at least one ortholog in human. ‘Yeast pY: human pY (observed)’ – number of observed unique spurious pY proteins in yeast with at least one ortholog in human that is Y-phosphorylated. ‘Yeast pY: human pY (expected)’ – number of expected unique spurious pY proteins in yeast with at least one ortholog in human that is Y-phosphorylated. c) conservation of kinase-substrate relationships (KSRs) between human and yeast. Top row (blue) is the proportion conserved relative to the sample size of known KSRs in humans. Bottom row (yellow) is the proportion conserved relative to the sample size of KSRs found in this study for yeast. d) Relative frequency (summing to 1) of Pfam domain phosphorylation in yeast (x-axis) and human (y-axis). Abundance is given in the units of log10(parts per million). Scatter plot includes only domains supported by at least 5 unique pY sites in either human or yeast. e) conservation of spurious pY phosphorylation between paralog pairs for paralog-specific peptides (see Methods). Single: phosphorylated on one paralog-specific peptide but not the homologous position. Pair: phosphorylated on both paralog-specific peptides at homologous Y positions. f) site-specific (i.e. alignment-based) conservation between spurious pY and human native pY. As a percentage of all unique yeast spurious pY (yeast pY, yellow), all unique yeast spurious pY with at least one human ortholog (yeast pY: human, blue), all unique yeast spurious pY with at least one pY-phosphorylated human ortholog (yeast pY: human pY (observed), purple), and all unique yeast spurious pY with at least one pY-phosphorylated human ortholog with x100 randomisations of the human pY positions. g-i) For yeast non-pY Y residues, spurious pY residues, native pY residues, human non-pY Y residues, and human pY residues, distribution of surface accessibility (RSA), percentage mapping to predicted ordered regions, and the percentage predicted to be destabilising for the protein fold (using a threshold of ΔΔG > 2 kcal/mol).
Figure 5
Figure 5. Testing for counter-selection against spurious pY residues in animal species.
a) Correlation between the number of predicted tyrosine kinases and proteomic Y content (relative frequency) for 20 animal species (blue) and 6 fungal species (yellow). b) Correlation between the number of predicted tyrosine kinases and proteomic Y content (relative frequency) after applying a phylogenetic correction (phylogenetically independent contrasts, (Felsenstein, 1985)). The left panel represents buried tyrosine (RSA < 0.2) proteome-wide and the right panel surface residues (RSA > 0.4) proteome-wide. The species and kinases analysed are the same as in panel a. c) Percentage of amino acid deserts (observed - expected) for all 20 canonical amino acids. An amino acid desert is defined as a protein where more than 50% of the protein length is missing the amino acid. The percentage observed is compared to the percentage calculated for 100 simulated proteomes (see Methods). Animal species in blue, fungal species in yellow. d) Top: correlation between the number of predicted tyrosine kinases (per species) and percentage of tyrosine deserts (observed - expected). Bottom: correlation between the number of predicted tyrosine kinases as a fraction of the total number of kinases (per species) and percentage of tyrosine deserts (observed - expected). e) A schematic for testing Y counter-selection at the level of individual sites in multiple sequence alignments (MSAs). For each unique spurious pY, orthologs are extracted, the ortholog sequences are aligned, a phylogenetic tree is constructed, and a profile of amino acid preference is inferred on the basis of the MSA and phylogenetic tree. Animal species in blue, fungal species in yellow. f) Difference between the inferred preference for Y in fungal species and metazoa species, calculated as their difference in equilibrium frequencies (π) by the Pelican software (Duchemin et al, 2023). The results are given for pY and non-pY tyrosines and separated according to their solvent accessibility (buried: RSA > 0.2, intermediate: 0.2 < RSA < 0.4, exposed: RSA > 0.4). Results only given for sites with significant changes in amino acid profile (between animals and fungi) at an adjusted p-value < 0.05. Distributions (pY and non-pY) compared using a Kolmogorov-Smirnov two-tailed test. g) Example of a protein (NOP7) with predicted counter-selection against Y (Y64) in animal species. Inferred Y preferences (0-1) are represented by Yfungi and Ymetazoa. A small sample of representative species are shown for the fungal and metazoan clades.

Similar articles

References

    1. Adams CC, Jakovljevic J, Roman J, Harnpicharnchai P & Woolford JL Jr (2002) Saccharomyces cerevisiae nucleolar protein Nop7p is necessary for biogenesis of 60S ribosomal subunits. RNA 8: 150–165 - PMC - PubMed
    1. Ahler E, Register AC, Chakraborty S, Fang L, Dieter EM, Sitko KA, Vidadala RSR, Trevillian BM, Golkowski M, Gelman H, et al. (2019) A Combined Approach Reveals a Regulatory Mechanism Coupling Src’s Kinase Activity, Localization, and Phosphotransferase-Independent Functions. Mol Cell 74: 393–408.e20 - PMC - PubMed
    1. Akdel M, Pires DEV, Pardo EP, Jänes J, Zalevsky AO, Mészáros B, Bryant P, Good LL, Laskowski RA, Pozzati G, et al. (2022) A structural biology community assessment of AlphaFold2 applications. Nat Struct Mol Biol 29: 1056–1067 - PMC - PubMed
    1. Almirantis Y, Charalampopoulos P, Gao J, Iliopoulos CS, Mohamed M, Pissis SP & Polychronopoulos D (2019) On overabundant words and their application to biological sequence analysis. Theor Comput Sci 792: 85–95 - PMC - PubMed
    1. Bachman JA, Sorger PK & Gyori BM (2022) Assembling a corpus of phosphoproteomic annotations using ProtMapper to normalize site information from databases and text mining. bioRxiv: 822668

Publication types