[Preprint]. 2023 Oct 5:2023.10.03.559514.
doi: 10.1101/2023.10.03.559514.

Synovial macrophage diversity and activation of M-CSF signaling in post-traumatic osteoarthritis

Affiliations

Synovial macrophage diversity and activation of M-CSF signaling in post-traumatic osteoarthritis

Alexander J Knights et al. bioRxiv. .

Update in

Abstract

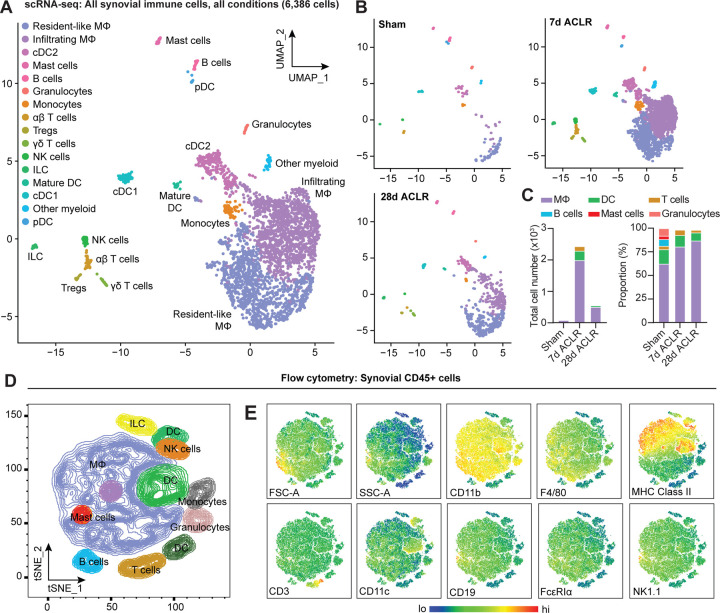
Objective: Synovium is home to immune and stromal cell types that orchestrate inflammation following a joint injury; in particular, macrophages are central protagonists in this process. We sought to define the cellular and temporal dynamics of the synovial immune niche in a mouse model of post-traumatic osteoarthritis (PTOA), and to identify stromal-immune crosstalk mechanisms that coordinate macrophage function and phenotype.

Design: We induced PTOA in mice using a non-invasive tibial compression model of anterior cruciate ligament rupture (ACLR). Single cell RNA-seq and flow cytometry were used to assess immune cell populations in healthy (Sham) and injured (7d and 28d post-ACLR) synovium. Characterization of synovial macrophage polarization states was performed, alongside computational modeling of macrophage differentiation, as well as implicated transcriptional regulators and stromal-immune communication axes.

Results: Immune cell types are broadly represented in healthy synovium, but experience drastic expansion and speciation in PTOA, most notably in the macrophage portion. We identified several polarization states of macrophages in synovium following joint injury, underpinned by distinct transcriptomic signatures, and regulated in part by stromal-derived macrophage colony-stimulating factor signaling. The transcription factors Pu.1, Cebpα, Cebpβ, and Jun were predicted to control differentiation of systemically derived monocytes into pro-inflammatory synovial macrophages.

Conclusions: We defined different synovial macrophage subpopulations present in healthy and injured mouse synovium. Nuanced characterization of the distinct functions, origins, and disease kinetics of macrophage subtypes in PTOA will be critical for targeting these highly versatile cells for therapeutic purposes.

Keywords: Immune cells; Macrophages; Osteoarthritis; Single-cell RNA-sequencing; Synovium.


Conflict of interest statement

Competing interests The authors have no competing interests to declare.

Figures

Figure 1.
Figure 1.. Diverse immune cell types are present in healthy and injured synovium.
(A) UMAP plot of all immune cells by scRNA-seq of synovium from mice subjected to Sham, 7d ACLR and 28d ACLR, or (B) split by condition. (C) Breakdown of immune cell types by total abundance (left) or proportion (right) in Sham, 7d ACLR or 28d ACLR synovium. (D) t-SNE plot of immune cell types by flow cytometry of CD45+ synovial cells from mice subjected to Sham (left and right synovia from n=4 mice) and 7d ACLR (right synovia from n=4 mice). (E) t-SNE heatmaps of scatter and surface marker parameters used to define synovial immune cell identities by flow cytometry. Tregs: regulatory T cells; NK cells: natural killer cells; ILC: innate lymphoid cells; DC: dendritic cells; cDC: conventional DCs; MΦ: macrophages; FSC-A: forward scatter-area; SSC-A: side scatter-area.
Figure 2.
Figure 2.. Integration of joint immune cells from mouse arthritis scRNA-seq datasets.
(A) Integrated UMAP plot of all immune cells from GSE134420 (Culemann), GSE200843 (Sebastian), GSE211584 (Knights) and GSE184609 (Muench). (B) Violin plots showing gene markers for each cell cluster. (C) Proportional breakdown of each major immune cell type in each dataset. (D) UMAP plots showing immune cell clusters for each dataset. (E) CellChat outgoing communication patterns for each major immune cell group Neut: neutrophils; Mono: monocytes; Prolif: proliferating cells.
Figure 3.
Figure 3.. Comparison of macrophages between arthritis disease states.
(A) Monocytes and MΦ from all PTOA and RA immune cell datasets were computationally isolated, resulting in three clusters: MΦ, monocytes and osteoclast-like cells. (B) Feature plots showing expression levels of highly enriched genes unique to each cluster. (C) Side-by-side UMAP plot of monocytes and MΦ from PTOA and RA datasets and (D) the proportion of each cluster within each disease state. (E) Differential gene expression analyses were performed on the MΦ cluster specifically. Comparison groups were PTOA vs control (Ctrl) MΦ and RA vs control (Ctrl) MΦ, with overlapping and non-overlapping DEGs for each comparison shown in a Venn Diagram. Also see Supplementary Tables 3 and 4. (F-G) Enriched biological pathways in PTOA (F) and RA (G) MΦ when compared to their respective control MΦ. (H) Conserved enriched biological pathways between PTOA and RA MΦ, derived from common DEGs with the same directionality between both separate comparisons. Also see Supplementary Table 5. For all pathway analyses, statistical overrepresentation tests were performed with Fisher’s Exact testing and calculation of false discovery rate (FDR). GO:BP: Gene Ontology Biological Pathways; GO:MF: Gene Ontology Molecular Function.
Figure 4.
Figure 4.. Synovial macrophage subsets and trajectories in PTOA.
(A) UMAP plot of monocytes and MΦ from synovium of Sham, 7d ACLR and 28d ACLR mice, or split by condition (B). Cluster naming and top gene markers are given on the right. (C) Gene feature plots showing expression of key marker genes for each subset. (D) Pseudotime trajectories overlaid onto monocyte and MΦ subsets showing directionality (arrowheads), starting points (roots, stars), branching points (nodes, black circles), and endpoints (termini, grey circles with black outline). Partitions are shown as disconnected (separate) trajectory trails. Colored cell clusters are shown in the top plot and pseudotime scale is shown in the bottom plot. (E) Heatmaps of top differentially expressed genes (DEGs) in pairwise comparisons for basal resident MΦ, resident-like MΦ A, and resident-like MΦ B clusters (Padj < 0.05). (F) Enriched biological pathways in basal resident MΦ, resident-like MΦ A, and resident-like MΦ B clusters, derived from statistical overrepresentation tests of DEGs from corresponding pairwise comparisons in (E). Also see Supplementary Table 6. Fisher’s Exact testing was performed and false discovery rate (FDR) was calculated. GO:BP: Gene Ontology Biological Pathways.
Figure 5.
Figure 5.. Stromal-immune crosstalk via M-CSF signaling.
(A) Cartoon depicting multi-directional and uni-directional crosstalk between stromal and immune cells in synovium, used for calculation of crosstalk communication probability scores. (B) Induction ratio for multi-directional and uni-directional M-CSF signaling derived from crosstalk communication probability scores (7d ACLR/Sham). (C) Expression of M-CSF ligands Csf1 and Il34, and the M-CSF receptor Csf1r, from bulk RNA-seq of Sham, 7d ACLR, or 28d ACLR synovium (n=5–6 male and n=5–6 female synovia per condition) (dataset available at NCBI GEO – upload and acceptance pending; accession number will be added upon receipt). (D) CellChat hierarchy plots for the M-CSF signaling pathway in Sham, 7d ACLR and 28d ACLR. Circles with fill represent cells sending signals, circles without fill represent cells receiving signals, in each condition. Line thickness corresponds to strength of communication. (E-G) Feature plots showing expression of Csf1 (E), Il34 (F) and Csf1r (G) in all synovial cells, split by condition (Sham, 7d ACLR, or 28d ACLR). n/a: not applicable; Fibro: fibroblasts; Peri: pericytes.
Figure 6.
Figure 6.. Transcriptional control of monocyte differentiation in synovium.
(A-B) Pseudotime trajectory from monocytes to infiltrating MΦ showing directionality (arrowheads), starting point (root, star), branching points (nodes, black circles), and endpoints (termini, grey circles with black outline). Pseudotime scale is shown in (B). (C) Heatmap of gene module analysis of co-regulated genes across pseudotime trajectory from monocytes to infiltrating MΦ. Also see Supplementary Table 7. (D) Modules 1, 4 and 6 were subjected to promoter screening for putative transcriptional regulators of module genes, using RcisTarget. Top directly-annotated motif hits and their corresponding transcription factors (TFs) are shown. (E) Gene regulatory network for the TFs Pu.1 (Spi1), Jun, Cebpa, and Cebpb. (F) Pseudotime regression plots of selected gene from the gene regulatory network in (E). Monocytes to infiltrating MΦ, left to right.

References

    1. Lumeng CN, Deyoung SM, Bodzin JL, Saltiel AR. Increased inflammatory properties of adipose tissue macrophages recruited during diet-induced obesity. Diabetes 2007; 56: 16–23. - PubMed
    1. Lumeng CN, Bodzin JL, Saltiel AR. Obesity induces a phenotypic switch in adipose tissue macrophage polarization. J Clin Invest 2007; 117: 175–184. - PMC - PubMed
    1. Fang D, Chen B, Lescoat A, Khanna D, Mu R. Immune cell dysregulation as a mediator of fibrosis in systemic sclerosis. Nat Rev Rheumatol 2022; 18: 683–693. - PubMed
    1. Gao X, Jia G, Guttman A, DePianto DJ, Morshead KB, Sun KH, et al. Osteopontin Links Myeloid Activation and Disease Progression in Systemic Sclerosis. Cell Rep Med 2020; 1: 100140. - PMC - PubMed
    1. Bhattacharyya S, Kelley K, Melichian DS, Tamaki Z, Fang F, Su Y, et al. Toll-like receptor 4 signaling augments transforming growth factor-β responses: a novel mechanism for maintaining and amplifying fibrosis in scleroderma. Am J Pathol 2013; 182: 192–205. - PMC - PubMed

Publication types