[Preprint]. 2024 Oct 1:2023.10.14.562349.
doi: 10.1101/2023.10.14.562349.

STING induces HOIP-mediated synthesis of M1 ubiquitin chains to stimulate NFκB signaling

Affiliations

STING induces HOIP-mediated synthesis of M1 ubiquitin chains to stimulate NFκB signaling

Tara D Fischer et al. bioRxiv. .

Update in

Abstract

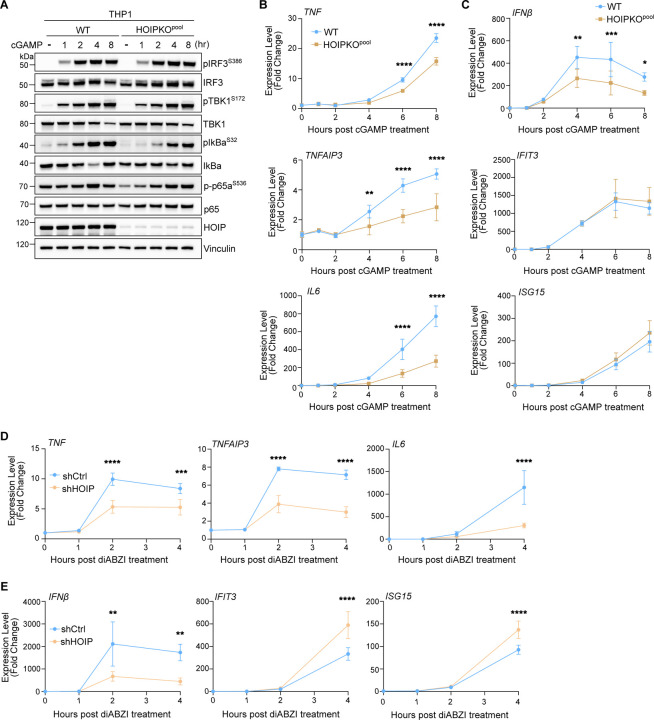
STING activation by cyclic dinucleotides in mammals induces IRF3- and NFκB -mediated gene expression, and the lipidation of LC3B at Golgi-related membranes. While mechanisms of the IRF3 response are well understood, the mechanisms of NFκB activation mediated by STING remain unclear. We report that STING activation induces linear/M1-linked ubiquitin chain (M1-Ub) formation and recruitment of the LUBAC E3 ligase, HOIP, to LC3B-associated Golgi membranes where ubiquitin is also localized. Loss of HOIP prevents formation of M1-Ub ubiquitin chains and reduces STING-induced NFκB and IRF3-mediated signaling in human monocytic THP1 cells and mouse bone marrow derived macrophages, without affecting STING activation. STING-induced LC3B lipidation is not required for M1-Ub chain formation or the immune-related gene expression, however the recently reported function of STING to neutralize the pH of the Golgi may be involved. Thus, LUBAC synthesis of M1 ubiquitin chains mediates STING-induced innate immune signaling.

Keywords: Golgi; Innate Immunity; Interferon; LC3B; LUBAC.


Figures

Figure 1.
Figure 1.. STING activation induces M1 and K63 ubiquitin chain formation.
A) Representative Airyscan-processed confocal images of Wild-type (WT) HeLa cells stably expressing BFP-P2A-STING (HeLaSTING) and mEGFP-LC3B (green) treated with 60 μg/mL of cGAMP for 8 hours prior to PFA-fixation and immunostaining with antibodies raised against mono- and poly-ubiquitin chains (Ub; magenta) and STING (cyan). Scale bar = 10 μm, and 2 μm (inset). Imaging was replicated in >3 independent experiments. B) Quantification of the percentage (%) of cells positive for mEGFP-LC3B foci and immunostained Ub foci (left panel), and the percentage (%) of mEGFP-LC3B foci with overlapping immunolabeled signal for Ub, STING, or both (right panel) from experiments represented in Fig. EV1A, and similar conditions to Fig. 1A. Error bars represent +/− s.d. from 3 replicates analyzed in the same experiment. Imaging was replicated in 3 independent experiments. C-F) Representative immunoblots of indicated proteins detected in HeLaSTING cell lysates prepared after treatment with 120 μg/mL cGAMP for 8 hours. Immunoblotting was replicated in 3 independent experiments. G) Quantification of immunoblots in (D-F). Values represent relative intensity of cGAMP treated to untreated lanes. Error bars represent mean +/− s.d. of three independent experiments. H) Quantification of ubiquitin-GG linked peptides from lysate (left) and Pan-TUBE (Tandem-Ubiquitin Binding Entities) enriched samples (right) identified by targeted LC-MS/MS. HeLaSTING cells stably expressing mEGFP-LC3B were treated with 120 μg/mL of cGAMP for 8 hours prior to cell lysis, Pan-TUBE enrichment, and LC-MS/MS analysis. Mass spectrometry data from cell lysates are from 2 independent experiments with 3–5 technical replicates each. Pan-TUBE enrichment was performed in technical triplicate from one of the same cell lysates analyzed in the left panel. Values represent relative amount of peptides detected in cGAMP treated cells over untreated cells. Error bars represent +/− s.d. from replicates described above. I) Representative Airyscan-processed confocal images of HeLaSTING; mEGFP-LC3B (green) cells treated with 100 μM Monensin for 1 hour prior to PFA-fixation and immunostaining with antibodies raised against mono- and poly-ubiquitin chains (Ub; magenta). Scale bar = 10 μm, and 2 μm (inset). Imaging was replicated in 2 independent experiments. J-K) Representative immunoblots for indicated linkage specific ubiquitin chains in HeLaSTING cell lysates prepared after treatment with 100 μM Monensin for 1 hour. Immunoblotting was replicated in 3 independent experiments. L) Quantification of immunoblots in (J-K). Values represent relative intensity of Monensin treated to untreated lanes. Error bars represent mean +/− s.d. of three independent experiments.
Figure 2.
Figure 2.. HOIP mediates STING activation induced M1 ubiquitin chain formation.
A) Representative Airyscan-processed confocal images of HeLaSTING cells stably expressing mScarletI-LC3B (magenta) and mEGFP-HOIP (green) treated with 120 μg/mL of cGAMP for 8 hours prior to saponin extraction and PFA-fixation. Scale bar = 10 μm, and 2 μm (inset). Imaging was replicated in 3 independent experiments. Representative images from non-saponin extracted cells are in Fig. EV2A. B) Quantification of the percentage (%) of mEGFP-LC3B foci with overlapping immunolabeled signal for HOIP, or HOIP and STING, from experiments represented in Fig. EV2B, and corresponding conditions to Fig. 2A. Error bars represent +/− s.d. from 3 replicates analyzed in the same experiment. Imaging was replicated in 3 independent experiments. Representative images are in Fig. EV2B. C) Representative immunoblots of indicated proteins detected in HeLaSTING cell lysates from WT, HOIPKO, and HOIPKO stably expressing untagged HOIP prepared following treatment with 120 μg/mL cGAMP for 8 hours. Immunoblotting was replicated in 3 independent experiments. D) Quantification of M1-Ub in (C). Values represent relative intensity of corresponding lanes to WT untreated lanes. Error bars represent mean +/− s.d. of three independent experiments. E) Representative immunoblots of indicated proteins detected in THP1 cell lysates from WT, HOIPKOpool, and HOIPKOpool stably expressing untagged HOIP prepared following treatment with 1 μM diABZI for 4 hours. Immunoblotting was replicated in 3 independent experiments. F) Quantification of M1-Ub in (E). Values represent relative intensity of corresponding lanes to WT untreated lanes. Error bars represent mean +/− s.d. of three independent experiments. G) Representative immunoblots of indicated proteins detected in THP1 cell lysates from WT and HOIPKOpool cells prepared following treatment with 1 μM diABZI for 1, 2, 4, and 8 hours. Immunoblotting was replicated in 3 independent experiments. H) Representative immunoblots of indicated proteins detected in iBMDM cell lysates from shCtrl and shHOIP cells prepared following treatment with 0.2 μM diABZI for 1, 2, and 4 hours. Immunoblotting was replicated in 3 independent experiments. I) Quantification of M1-Ub in (H). Values represent relative intensity of corresponding lanes to untreated lanes per cell line. Error bars represent mean +/− s.d. of three independent experiments.
Figure 3.
Figure 3.. Loss of STING-mediated VAIL disrupts the perinuclear localization of ubiquitin and HOIP, but not M1-Ub chain formation.
A) Representative immunoblots of indicated proteins detected lysates from HeLaSTING WT and HeLaSTING with stable overexpression of mEGFP-SopF prepared after treatment with 120 μg/mL cGAMP for 8 hours. Immunoblotting was replicated in 3 independent experiments. B) Quantification of M1-Ub in (A). Values represent relative intensity of lanes to WT cGAMP-treated lanes. Error bars represent mean +/− s.d. of three independent experiments. C) Representative Airyscan-processed confocal images of WT HeLaSTING cells stably expressing mScarletI-LC3B alone or with stable expression of mEGFP-SopF treated with 120 μg/mL of cGAMP for 8 hours prior to PFA-fixation and immunostaining with antibodies raised against mono- and poly-ubiquitin chains (Ub). Scale bar = 20 μm. Imaging was replicated in 3 independent experiments. D) Representative immunoblots of indicated proteins detected lysates from HeLaSTING WT and ATG16L1KO cells prepared after treatment with 120 μg/mL cGAMP for 8 hours. Immunoblotting was replicated in 3 independent experiments. E) Quantification of M1-Ub in (D). Values represent relative intensity of lanes to WT cGAMP-treated lanes. Error bars represent mean +/− s.d. of three independent experiments. F) Representative spinning disk confocal images of HeLaSTING; mEGFP-HOIP (green); mScarletI-LC3B (orange) cells treated with 120 μg/mL of cGAMP for 8 hours prior to prior to saponin extraction, PFA-fixation and immunostaining for ubiquitin (Ub; magenta). Scale bar = 20 μm. G) Quantification and distribution of the number and size of HOIP (top) and Ubiquitin punctae (bottom) in the experiment represented in (F). Large ‘punctae’ can be interpreted as ‘foci’. Imaging was replicated in 3 independent experiments.
Figure 4.
Figure 4.. M1 ubiquitin chains stimulate STING-mediated NFκB-related immune signaling.
A) Representative immunoblots of indicated proteins detected in THP1 cell lysates from WT and HOIPKOpool cells prepared following treatment with 1 μM diABZI for 1, 2, 4, and 8 hours. Immunoblotting was replicated in 3 independent experiments. B) Quantification of pIκBαS32 in (A). Values represent relative intensity of corresponding bands to untreated bands per cell line. Replicates for each condition from 2 independent experiments are shown. C) Quantification of pIκBαS32 in (D). Values represent relative intensity of bands to WT treated bands. Error bars represent mean +/− s.d. of three independent experiments. D) Representative immunoblots of indicated proteins detected in THP1 cell lysates from WT, HOIPKOpool, and HOIPKOpool stably expressing untagged HOIP prepared following treatment with 1 μM diABZI for 4 hours. Immunoblotting was replicated in 3 independent experiments. E-F) Relative expression changes of indicated NFκB- (E) and IRF3/interferon-related (F) genes detected by quantitative RT-PCR in WT and HOIPKOpool THP1 cells treated with 1 μM diABZI for 1, 2, 4, and 8 hours. Quantification of relative expression is from 3 independent experiments analyzed at the same time. A 2-way ANOVA with a Tukey’s multiple comparisons test was performed on 2−ΔΔCt values. Error bars represent s.d. *<0.05, **<0.01, ***<0.001, ****<0.0001. G-H) Relative expression changes of indicated NFκB- (G) and IRF3/interferon-related (H) genes detected by quantitative RT-PCR in THP1 WT, HOIPKOpool, and HOIPKOpool stably expressing untagged HOIP cells treated with 1 μM diABZI for 4 hours. Quantification of relative expression is from 4 independent experiments analyzed at the same time. A 2-way ANOVA with a Tukey’s multiple comparisons test was performed on 2−ΔΔCt values. Error bars represent s.d. *<0.05, **<0.01, ***<0.001, ****<0.0001.
Figure 5.
Figure 5.. LC3B lipidation is not required for STING-mediated innate immune responses.
A) Representative immunoblots of indicated proteins detected in THP1 cell lysates from WT and ATG16L1KO cells prepared following treatment with 1 μM diABZI for 1, 2, and 4 hours. Immunoblotting was replicated in 3 independent experiments. B-C) Relative expression changes of indicated NFκB- (B) and IRF3/interferon-related (C) genes detected by quantitative RT-PCR in WT and ATG16L1KO THP1 cells treated with 1 μM diABZI for 2, 4, 6, and 8 hours. Quantification of relative expression is from 3 independent experiments analyzed at the same time. A 2-way ANOVA with a Tukey’s multiple comparisons test was performed on 2−ΔΔCt values. Error bars represent s.d. *<0.05, **<0.01, ***<0.001, ****<0.0001.
Expanded View 1.
Expanded View 1.
A) Representative spinning disk confocal images of HeLaSTING; mEGFP-LC3B (green) cells treated with 120 μg/mL of cGAMP for 8 hours prior to PFA-fixation and immunostaining for mono- and poly-ubiquitin chains (Ub; magenta), and STING (cyan). Scale bar = 20 μm. Corresponding to quantification in Fig. 1B. B) Representative spinning disk confocal images of HeLaSTING; mEGFP-LC3B (green) cells treated with 1 μM diABZI for 4 hours prior to PFA-fixation and immunostaining for mono- and poly-ubiquitin chains (Ub; magenta), and STING (cyan). Scale bar = 20 μm. Corresponding to quantification in Fig. EV1C. C) Quantification of the percentage (%) of cells positive for mEGFP-LC3B foci and immunostained Ub foci (left panel), and the percentage (%) of mEGFP-LC3B foci with overlapping immunolabeled signal for Ub, STING, or both (right panel) from experiments represented in Fig. EV1B. Error bars represent +/− s.d. from 3 replicates analyzed in the same experiment. Imaging was replicated in 3 independent experiments. D-E) Representative spinning disk confocal images of HeLaSTING; mEGFP-LC3B cells treated with 120 μg/mL of cGAMP for 8 hours prior to PFA-fixation and immunostaining for K48- and K63-ubiquitin chains. Scale bar = 20 μm. F) Quantification of the percentage (%) of mEGFP-LC3B foci with overlapping signal for immunolabeled K48- and K63-ubiquitin chain from experiments represented in Fig. EV1D–E. Error bars represent +/− s.d. from 3 replicates analyzed in the same experiment. Imaging was replicated in 3 independent experiments. G) Pearson’s correlation coefficient of mScarletI-LC3B and Vx3-EGFP over time in the live imaging experiment represented in Movie 1. FRT/TREX HeLa cells stably expressing FRT/TO-DD-Vx3-EGFP, BFP-P2A-STING, and mScarletI-LC3B were incubated with 1 μg/mL Doxycycline and 500 nM Shield1 for 24 hours prior to treatment with either 120 μg/mL cGAMP or 1 μM diABZI and imaging every 30 minutes for 12 hours on a spinning disk confocal microscope. Error bars represent +/− s.d. from 3 replicates analyzed in the same experiment. Imaging was replicated in 3 independent experiments.
Expanded View 2.
Expanded View 2.
A) Representative Airyscan-processed confocal images of HeLaSTING cells stably expressing mScarletI-LC3B and mEGFP-HOIP treated with 120 μg/mL of cGAMP for 8 hours with no saponin extraction prior to PFA-fixation. Scale bar = 10 μm. Corresponding to representative images in Fig. 2A. Imaging was replicated in 3 independent experiments. B) Representative spinning disk confocal images of HeLaSTING; mEGFP-HOIP (green); mScarletI-LC3B (magenta) cells treated with 120 μg/mL of cGAMP for 8 hours prior to prior to saponin extraction and PFA-fixation. Scale bar = 20 μm. Corresponding to quantification in Fig. 2B. C-D) Representative immunoblots of indicated proteins detected in cell lysates from HeLaSTING WT and HOIPKO cells (C) or HeLaSTING and HeLaSTING stably expressing mEGFP-OTULIN (D) prepared following treatment with 120 μg/mL cGAMP for 8 hours. Immunoblotting was replicated in 3 independent experiments. E-F) Representative immunoblots of indicated proteins detected in HeLaSTING cell lysates from WT and HOIPKO cells prepared following treatment with 120 μg/mL cGAMP (E) or 1 μM diABZI (F) for 1, 2, 4, and 8 hours. Immunoblotting was replicated in 3 independent experiments. G) Representative immunoblots of endogenous STING detected in cell lysates from WT and HOIPKO HeLa cells without stable overexpression of STING. Cells were treated with 15 μg/mL cGAMP for 8 hours. Immunoblotting was replicated in 3 independent experiments. H) Representative immunoblots of indicated proteins detected in THP1 cell lysates from WT and HOIPKOpool cells prepared following treatment with 120 μg/mL cGAMP for 1, 2, 4, and 8 hours. Immunoblotting was replicated in 3 independent experiments.
Expanded View 3.
Expanded View 3.
A) Representative Airyscan-processed confocal images of HeLaSTING and HeLaSTING cells with stable overexpression of mEGFP-LC3B (green) treated with 120 μg/mL of cGAMP for 8 hours prior to PFA-fixation and immunostaining with antibodies raised against mono- and poly-ubiquitin chains (Ub; magenta) and STING (cyan). Scale bar = 20 μm, and 2 μm (inset). Imaging was replicated in 2 independent experiments. B) Representative immunoblots of indicated proteins detected lysates from HeLaSTING WT and HeLaSTING with stable overexpression of mEGFP-LC3B prepared after treatment with 120 μg/mL cGAMP for 8 hours. Immunoblotting was replicated in 3 independent experiments. C) Representative immunoblots of indicated proteins detected in HeLaSTING cell lysates prepared after treatment with either DMSO, 10 μM C53, 1 μM diABZI, or both C53 and diABZI for 4 hours. Immunoblotting was replicated in 3 independent experiments. D-E) Representative spinning disk confocal images of FRT/TREX HeLa cells stably expressing FRT/TO-DD-Vx3-EGFP, BFP-P2A-STING, and mScarletI-LC3B at the 6-hour timepoint following treatment (D) and quantification of the percentage (%) of cells positive for Vx3-EGFP foci over time (E). Cells were incubated with 1 μg/mL Doxycycline and 500 nM Shield1 for 24 hours prior to treatment with either DMSO, 10 μM C53, 1 μM diABZI, or both C53 and diABZI, and imaging every 30 minutes for 12 hours on a spinning disk confocal microscope. Scale bar = 50 μm. Quantification is from 3 wells analyzed in the same experiment. Imaging was replicated in 2 independent experiments.
Expanded View 4.
Expanded View 4.
A) Representative immunoblots of indicated proteins detected in THP1 cell lysates from WT and HOIPKOpool cells prepared following treatment with 120 μg/mL cGAMP for 1, 2, 4, and 8 hours. Immunoblotting was replicated in 3 independent experiments. B-C) Relative expression changes of indicated NFκB- (B) and IRF3/interferon-related (C) genes detected by quantitative RT-PCR in WT and HOIPKOpool THP1 cells treated with 120 μg/mL cGAMP for 1, 2, 4, and 8 hours. Quantification of relative expression is from 3 independent experiments analyzed at the same time. A 2-way ANOVA with a Tukey’s multiple comparisons test was performed on 2−ΔΔCt values. Error bars represent s.d. *<0.05, **<0.01, ***<0.001, ****<0.0001. D-E) Relative expression changes of indicated NFκB- (D) and IRF3/interferon-related (E) genes detected by quantitative RT-PCR in WT and shCtrl and shHOIP iBMDM cells treated with 0.2 μM diABZI for 1, 2, and 4 hours. Quantification of relative expression is from 3 independent experiments analyzed at the same time. A 2-way ANOVA with a Tukey’s multiple comparisons test was performed on 2−ΔΔCt values. Error bars represent s.d. *<0.05, **<0.01, ***<0.001, ****<0.0001.
Expanded View 5.
Expanded View 5.
A) Representative immunoblots of indicated proteins detected in THP1 cell lysates from WT and ATG16L1KO cells prepared following treatment with 1 μM diABZI for 1, 2, and 4 hours. Immunoblotting was replicated in 3 independent experiments. B) Representative immunoblots of indicated proteins detected in lysates from WT THP1 cells prepared following treatment with either DMSO, 10 μM C53, 1 μM diABZI, or both C53 and diABZI for 4 hours. Immunoblotting was replicated in 3 independent experiments. C-D) Relative expression changes of indicated NFκB-related genes (C) and interferon-related genes (D) detected by quantitative RT-PCR in THP1 cells treated with DMSO, 10 μM C53, 1 μM diABZI, or both C53 and diABZI for 4 hours. Quantification of relative expression is from 4 independent experiments analyzed at the same time. A one-way ANOVA with a Tukey’s multiple comparisons test was performed on 2−ΔΔCt values. Error bars represent Standard Deviation. *<0.05, **<0.01, ***<0.001, ****<0.0001.

References

    1. Abe T & Barber GN (2014) Cytosolic-DNA-Mediated, STING-Dependent Proinflammatory Gene Induction Necessitates Canonical NF-κB Activation through TBK1. J Virol 88: 5328–5341 - PMC - PubMed
    1. Ablasser A & Chen ZJ (2019) cGAS in action: Expanding roles in immunity and inflammation. Science 363: eaat8657. - PubMed
    1. Ahn J & Barber GN (2019) STING signaling and host defense against microbial infection. Exp Mol Med 51: 1–10 - PMC - PubMed
    1. Balka KR, Louis C, Saunders TL, Smith AM, Calleja DJ, D’Silva DB, Moghaddas F, Tailler M, Lawlor KE, Zhan Y, et al. (2020) TBK1 and IKKε Act Redundantly to Mediate STING-Induced NF-κB Responses in Myeloid Cells. Cell Reports 31 - PubMed
    1. Blasi E, Radzioch D, Durum SK & Varesio L (1987) A murine macrophage cell line, immortalized by v-raf and v-myc oncogenes, exhibits normal macrophage functions. Eur J Immunol 17: 1491–1498 - PubMed

Publication types