[Preprint]. 2023 Oct 2:2023.10.01.560370.
doi: 10.1101/2023.10.01.560370.

Growth Dynamics of Ductal Carcinoma in Situ Recapitulate Normal Breast Development

Affiliations

Growth Dynamics of Ductal Carcinoma in Situ Recapitulate Normal Breast Development

Marc D Ryser et al. bioRxiv. .

Abstract

Ductal carcinoma in situ (DCIS) and invasive breast cancer share many morphologic, proteomic, and genomic alterations. Yet in contrast to invasive cancer, many DCIS tumors do not progress and may remain indolent over decades. To better understand the heterogenous nature of this disease, we reconstructed the growth dynamics of 18 DCIS tumors based on the geo-spatial distribution of their somatic mutations. The somatic mutation topographies revealed that DCIS is multiclonal and consists of spatially discontinuous subclonal lesions. Here we show that this pattern of spread is consistent with a new 'Comet' model of DCIS tumorigenesis, whereby multiple subclones arise early and nucleate the buds of the growing tumor. The discontinuous, multiclonal growth of the Comet model is analogous to the branching morphogenesis of normal breast development that governs the rapid expansion of the mammary epithelium during puberty. The branching morphogenesis-like dynamics of the proposed Comet model diverges from the canonical model of clonal evolution, and better explains observed genomic spatial data. Importantly, the Comet model allows for the clinically relevant scenario of extensive DCIS spread, without being subjected to the selective pressures of subclone competition that promote the emergence of increasingly invasive phenotypes. As such, the normal cell movement inferred during DCIS growth provides a new explanation for the limited risk of progression in DCIS and adds biologic rationale for ongoing clinical efforts to reduce DCIS overtreatment.


Conflict of interest statement

COMPETING INTERESTS The authors declare no competing interests.

Figures

Figure 1:
Figure 1:. The female breast: From normal development to invasive cancer.
(A) At birth, the mammary gland consists of the simple embryonic rudiment. (B) During pubertal development, the embryonic rudiment undergoes branching morphogenesis and develops into the adult ductal tree. (C) Ductal carcinoma in situ (DCIS) consists of neoplastic cells that are contained within the ducts and lobules of the adult mammary gland. (D) During invasive progression, DCIS cells penetrate the basement membrane of the ducts and lobules and invade the breast stroma.
Figure 2:
Figure 2:. Multiregional sequencing reveals spatial mutation topographies of DCIS tumors.
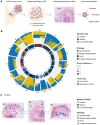
(A) Between 2 and 5 spatially separated microscope sections were obtained from 18 DCIS tumors. From each microscope slide, small tissue areas (spots) were microdissected, spatially registered, histologically annotated (normal breast duct, duct with benign breast disease, duct with DCIS, invasive breast cancer), and genotyped. Genotyping was based on targeted sequencing of tumor-specific mutation panels that had been derived from whole exome sequencing analyses of macro-dissected DCIS areas. (B) Summary of the genetic and phenotypic spot data for all 18 DCIS tumors. Each sector groups together spots of the same tumor, and tumor labels are shown at the periphery. Differences in height of the outermost track (mutation calls) reflect the varying mutation panel sizes for each tumor. (C) Spatial pattern of a select mutation in DCIS-66 (gene: EP400, chr12:132472310). Shapes indicate spot histology and colors the mutation status.
Figure 3:
Figure 3:. DCIS tumors are multiclonal and spatially heterogeneous.
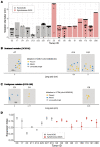
All analyses in this figure are restricted to DCIS spots. (A) The variant allele frequency (VAF) spectra of detected mutations are shown for 4 select spots in DCIS-173; the VAF of two select mutations in the genes SFXN1 (blue) and NAF1 (red) are highlighted. (B) Bivariate summary statistics for spot-level VAF spectra are shown across all DCIS spots (n=313) of the 18 tumors, with median VAF on the x-axis, and interquartile range (|QR) of the VAF on the y-axis. Red color scheme visualizes spot density. (C) Mutation patterns for all DCIS spots in DCIS-168 are organized by hierarchical clustering of mutations (rows) and spatial clustering of spots (columns); spatial clustering was based on one-dimensional t-distributed stochastic neighbor embedding (t-SNE) of the spots’ spatial coordinates. (D) Mutation patterns for all DCIS spots in DCIS-173, see panel C for details and color legend. (E) For each tumor, the spatial correlations of DCIS spot genotypes were quantified using Pearson’s R; DCIS-222 was excluded because it had only 2 DCIS spots. Monte Carlo sampling was used to account for posterior uncertainty of mutation calls, resulting in predicted means (circles) and 95% prediction intervals (bars). Median predicted mean correlation was −0.01, without detectable differences between pure DCIS and synchronous DCIS with adjacent invasive cancer (p=.81, Wilcoxon rank-sum test).
Figure 4:
Figure 4:. DCIS mutations form expansive skip lesions.
All analyses in this figure are restricted to DCIS spots; DCIS-222 was excluded because it only had 2 DCIS spots. (A) The diameter of restricted mutations (found in <90% of spots; black dots) relative to the extent of the DCIS tumor itself (bar). (B) Scattered mutations are characterized by a lack of spatial separation between spots that do and do not contain the mutation. An example from DCIS-91 is shown. Grey rectangles represent the microscope sections (x-y plane) along the tumor’s long (z-) axis. (C) Contiguous mutations are characterized by a spatial separation of spots that do and do not contain the mutation. An example from DCIS-168 is shown; see also description of panel B. (D) The expansion index (EI) of a tumor characterizes the degree of mutation scattering, ranging from contiguous ( ) to scattered ( ). Monte Carlo sampling was used to account for posterior uncertainty of mutation calls, resulting in predicted means (circles) and 95% prediction intervals (bars). Median EI was 0.74 across all tumors, without detectable difference between pure DCIS (median: 0.71) and synchronous DCIS with adjacent invasive cancer (median: 0.74; p=0.88, Wilcoxon rank-sum test).
Figure 5:
Figure 5:. The Comet model of DCIS tumorigenesis.
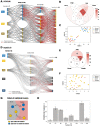
(A) A modified Muller plot illustrating the typically observed data in our cohort. After initial expansion of early subclones, the growth patterns are characterized by multiclonal ducts and disperse skip lesions. (B) The Comet model of DCIS growth recapitulates the dynamics of pubertal branching morphogenesis. During ductal elongation (top), the long-lived neoplastic cells of the DCIS end bud undergo intermittent proliferation; after transit-amplification, the clustered progenies of the long-lived cells become embedded in the growing multiclonal DCIS duct. During branching (bottom), the end bud cells are randomly distributed between the two daughter branches where they duplicate, and the two resulting end buds start growing along their respective daughter branches. (C) Mutation patterns resulting from the Comet model. Left: DCIS growth is initiated at the starting node and propagated across the ductal tree, with pie charts indicating the local variant allele frequencies (VAFs) of a select mutation. Right: the hierarchically clustered mutation pattern corresponding to the simulation in the left panel, illustrating the local presence/absence of mutations (rows) across the examined duct cross-sections (columns). (D) A modified Muller plot illustrating the expected subclone frequencies that arise from a canonical model of cancer evolution along the ductal tree. Initial expansion of the first DCIS cell and subsequent branching growth are governed by quasi-neutral clonal evolution. Due to the thin tube-like geometry of the ducts, individual subclones are expected to rapidly go extinct or fixate, resulting in monoclonal ducts. (E) As in C, but instead using a canonical model of cancer evolution, see Methods for details. (F) Spatial distribution of epithelial cell types in two DCIS-filled ducts, generated by multiplexed ion-beam imaging (MIBI). Each field of view (FOV) is of size 500μm×500μm; corresponding color legend at the bottom of panel G. (G) A total of 57 FOVs across 10 tumors, including 49 DCIS ducts, 2 normal breast ducts, and 8 areas of invasive cancer were analyzed using MIBI. Where applicable, spot ID (top) maps each FOV to the corresponding spot label from the mutational analysis. Epithelial cells (PanCK+) were classified as either luminal (BCL2+ and/or GATA3+), stem-like (PAX5+ and/or SOX10+), basal (CK5+), epithelial-to-mesenchymal (Vimentin+), or myoepithelial (SMA+); for cells assigned to multiple subtypes, we distinguished the three most common combinations, and grouped the less frequent combinations; cells that did not match any of the subtypes were classified as not otherwise specified (NOS).
Figure 6:
Figure 6:. Phenotypic plasticity and multiclonal expansion.
(A-C) Mutational summary of DCIS-66. (A) Mutation flow across the phenotypic spectrum of breast disease, from normal breast tissue and benign breast disease to DCIS and invasive cancer; n indicates the total number of mutations detected among spots of a given histology. The vertical rectangles represent individual spots, and their color indicates the corresponding microscope slide. Grey connections indicate one or more shared mutation(s) in the absence of shared putative driver mutations, and red connections indicate one or more shared putative driver mutation(s). (B) Venn diagram summarizing shared mutations (drivers and passengers) across spot histologies. (C) t-distributed stochastic neighbor embedding (t-SNE) of spot genotypes, with colors indicating spot histology. (D-F) Mutational summary of DCIS-173. See captions of panels A, B, and C for details about panels D, E and F, respectively. (G) Example of a mutation pattern that indicates multiclonal invasion: the mutation is present in some but not all DCIS spots, and in some but not all invasive spots. Such a pattern indicates that two distinct cell populations, one with and one without the mutation, are present both inside and outside the ducts. (H) Multiclonal invasion patterns were found in all 8 tumors that had both DCIS and invasive spots; duplicate patterns were excluded. Monte Carlo sampling was used to account for posterior uncertainty of mutation calls, resulting in predicted means (bars) and 95% prediction intervals (error bars).

References

    1. Plevritis S. K. et al. Association of Screening and Treatment With Breast Cancer Mortality by Molecular Subtype in US Women, 2000–2012. JAMA 319, 154–164 (2018). 10.1001/jama.2017.19130 - DOI - PMC - PubMed
    1. Berry D. A. et al. Effect of screening and adjuvant therapy on mortality from breast cancer. N Engl J Med 353, 1784–1792 (2005). 10.1056/NEJMoa050518 - DOI - PubMed
    1. Nelson H. D. et al. Effectiveness of Breast Cancer Screening: Systematic Review and Meta-analysis to Update the 2009 U.S. Preventive Services Task Force Recommendation. Ann Intern Med 164, 244–255 (2016). 10.7326/M15-0969 - DOI - PubMed
    1. Nelson H. D. et al. Harms of Breast Cancer Screening: Systematic Review to Update the 2009 U.S. Preventive Services Task Force Recommendation. Ann Intern Med 164, 256–267 (2016). 10.7326/M15-0970 - DOI - PubMed
    1. van Seijen M. et al. Ductal carcinoma in situ: to treat or not to treat, that is the question. British journal of cancer 121, 285–292 (2019). - PMC - PubMed

Publication types