

Modeling Transmission Dynamics of Tuberculosis-HIV Co-Infection in South Africa
- PMID: 37873885
- PMCID: PMC10594517
- DOI: 10.3390/epidemiologia4040036
Modeling Transmission Dynamics of Tuberculosis-HIV Co-Infection in South Africa
Abstract
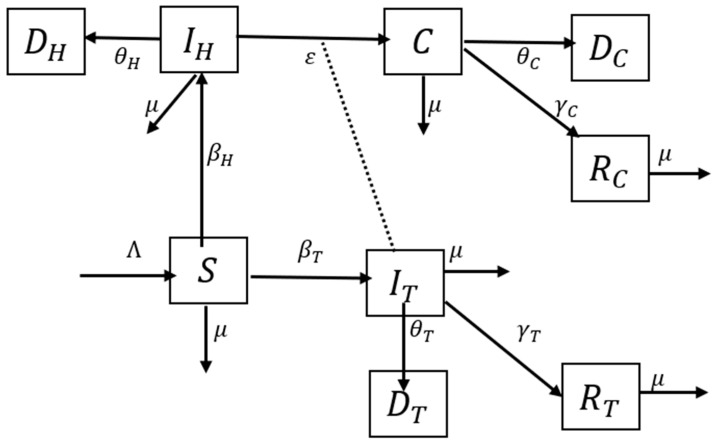
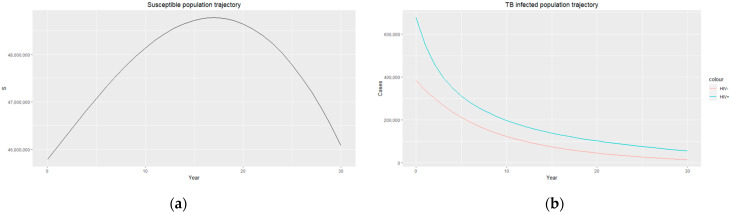
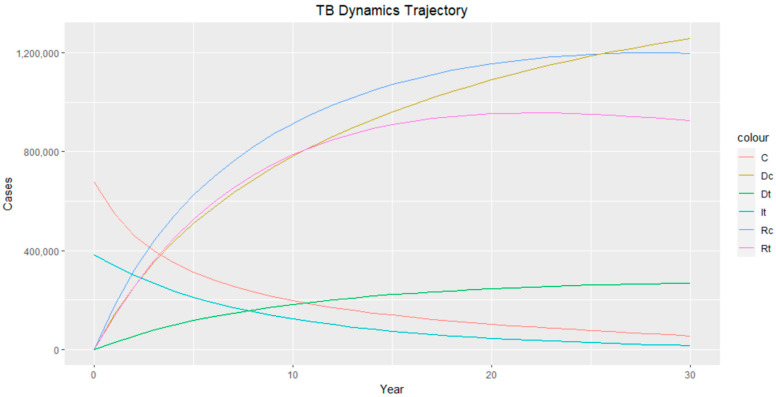
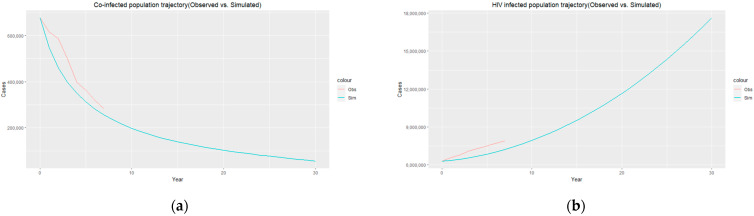
South Africa has the highest number of people living with the human immunodeficiency virus (HIV) in the world, accounting for nearly one in five people living with HIV globally. As of 2021, 8 million people in South Africa were infected with HIV, which is 13% of the country's total population. Approximately 450,000 people in the country develop tuberculosis (TB) disease every year, and 270,000 of those are HIV positive. This suggests that being HIV positive significantly increases one's susceptibility to TB, accelerating the spread of the epidemic. To better understand the disease burden at the population level, a Susceptible-Infected-Recovered-Dead (SIRD) TB-HIV co-infection epidemic model is presented. Parameter values are estimated using the method of moments. The disease-free equilibrium and basic reproduction number of the model are also obtained. Finally, numeric simulations are carried out for a 30-year period to give insights into the transmission dynamics of the co-infection.
Keywords: HIV; South Africa; co-infection dynamics; mathematical modeling; tuberculosis.
Conflict of interest statement
The authors declare no conflict of interest.
Figures


References
-
- World Health Organization . Global Tuberculosis Control: Epidemiology, Planning, Financing: WHO Report. World Health Organization; Geneva, Switzerland: 2009. [(accessed on 10 April 2023)]. Available online: https://apps.who.int/iris/handle/10665/44035.
-
- Vassal A. South Africa Perspective: Tuberculosis. Copenhagen Consensus Center 2015. [(accessed on 10 April 2023)]. Available online: https://www.copenhagenconsensus.com/publication/south-africa-perspective....
-
- Mekonen K.G., Balcha S.F., Obsu L.L., Hassen A. Mathematical Modeling and Analysis of TB and COVID-19 Coinfection. J. Appl. Math. 2022;2022:2449710. doi: 10.1155/2022/2449710. - DOI
LinkOut - more resources
Full Text Sources
Research Materials
