. 2024 Jan 12;14(1):104-119.
doi: 10.1158/2159-8290.CD-23-0456.

Early Cancer Detection in Li-Fraumeni Syndrome with Cell-Free DNA

Affiliations

Early Cancer Detection in Li-Fraumeni Syndrome with Cell-Free DNA

Derek Wong et al. Cancer Discov. .

Abstract

People with Li-Fraumeni syndrome (LFS) harbor a germline pathogenic variant in the TP53 tumor suppressor gene, face a near 100% lifetime risk of cancer, and routinely undergo intensive surveillance protocols. Liquid biopsy has become an attractive tool for a range of clinical applications, including early cancer detection. Here, we provide a proof-of-principle for a multimodal liquid biopsy assay that integrates a targeted gene panel, shallow whole-genome, and cell-free methylated DNA immunoprecipitation sequencing for the early detection of cancer in a longitudinal cohort of 89 LFS patients. Multimodal analysis increased our detection rate in patients with an active cancer diagnosis over uni-modal analysis and was able to detect cancer-associated signal(s) in carriers prior to diagnosis with conventional screening (positive predictive value = 67.6%, negative predictive value = 96.5%). Although adoption of liquid biopsy into current surveillance will require further clinical validation, this study provides a framework for individuals with LFS.

Significance: By utilizing an integrated cell-free DNA approach, liquid biopsy shows earlier detection of cancer in patients with LFS compared with current clinical surveillance methods such as imaging. Liquid biopsy provides improved accessibility and sensitivity, complementing current clinical surveillance methods to provide better care for these patients. See related commentary by Latham et al., p. 23. This article is featured in Selected Articles from This Issue, p. 5.


Figures

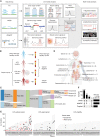
Figure 1. A, Illustrative abstract of sequencing protocol and analysis. B, Pictogram of the patient cohort and sample classification and terminology. C, Sankey diagram of patients in our cohort. Phenoconverter patients, those who transitioned between cancer statuses (negative/positive), were only counted once within the Active Cancer category. Cancer-free patients were those deemed clinically cancer-free at all time points collected. D, Location and number of cancer types clinically diagnosed in our LFS patient cohort. E, Line plots showing the time between each plasma sample collected per patient split by cancer status. Each line represents a patient, and points are colored by the patient's clinical cancer status at the time of collection. Xs denote patient death. F, Upset plot showing the number of samples across the different intersections of assays. B and C were created with BioRender.com.
Figure 1.
A, Illustrative abstract of sequencing protocol and analysis. B, Pictogram of the patient cohort and sample classification and terminology. C, Sankey diagram of patients in our cohort. Phenoconverter patients, those who transitioned between cancer statuses (negative/positive), were only counted once within the Active Cancer category. Cancer-free patients were those deemed clinically cancer-free at all time points collected. D, Location and number of cancer types clinically diagnosed in our LFS patient cohort. E, Line plots showing the time between each plasma sample collected per patient split by cancer status. Each line represents a patient, and points are colored by the patient's clinical cancer status at the time of collection. Xs denote patient death. F, Upset plot showing the number of samples across the different intersections of assays. B and C were created with BioRender.com.
Figure 2. A, Oncoplot showing germline and somatic variants identified in the plasma of TP53m-carriers using targeted panel sequencing. Germline and somatic TP53 mutations are separated. Clinical information is shown at the top. B, Oncoplot showing somatic TP53 variants, TP53 fragmentation score, genome-wide fragmentation score, and copy-number inferred predicted tumor fraction profiled using a targeted panel and shallow whole-genome sequencing in TP53m-carriers. Clinical information is displayed at the top. Detection thresholds using TP53 and genome-wide fragmentation scores were calculated using the 90th percentile of LFS Healthy samples. C, Matrix displaying overlap between detection of cancer-associated genomic alterations using targeted panel sequencing and shallow whole-genome sequencing.
Figure 2.
A, Oncoplot showing germline and somatic variants identified in the plasma of TP53m-carriers using targeted panel sequencing. Germline and somatic TP53 mutations are separated. Clinical information is shown at the top. B, Oncoplot showing somatic TP53 variants, TP53 fragmentation score, genome-wide fragmentation score, and copy-number inferred predicted tumor fraction profiled using a targeted panel and shallow whole-genome sequencing in TP53m-carriers. Clinical information is displayed at the top. Detection thresholds using TP53 and genome-wide fragmentation scores were calculated using the 90th percentile of LFS Healthy samples. C, Matrix displaying overlap between detection of cancer-associated genomic alterations using targeted panel sequencing and shallow whole-genome sequencing.
Figure 3. Fragment frequency distribution of samples from healthy non-LFS controls (black), LFS Healthy (blue), and LFS Active Cancer patients (red; top). Z-scores across the fragment size distribution comparing LFS Healthy to healthy non-LFS controls (middle) and LFS Active Cancer to LFS Healthy (bottom).
Figure 3.
Fragment frequency distribution of samples from healthy non-LFS controls (black), LFS Healthy (blue), and LFS Active Cancer patients (red; top). Z-scores across the fragment size distribution comparing LFS Healthy to healthy non-LFS controls (middle) and LFS Active Cancer to LFS Healthy (bottom).
Figure 4. Heat maps showing the methylation score at each methylation site in our pan-cancer (A) and breast-cancer (B) methylation signatures. A cumulative methylation score is plotted at the top. The methylation threshold was calculated using the 95th percentile of the healthy non-LFS controls.
Figure 4.
Heat maps showing the methylation score at each methylation site in our pan-cancer (A) and breast-cancer (B) methylation signatures. A cumulative methylation score is plotted at the top. The methylation threshold was calculated using the 95th percentile of the healthy non-LFS controls.
Figure 5. Upset plot showing the detection overlap between analyses in all cancer-positive samples (A) and cancer-negative samples (B). C, Tile plot comparison of cancer-associated signal detection across all analysis methods in cancer-positive samples. D, Confusion matrixes showing ctDNA and clinical detection rates for cancer-negative LFS samples and patients. Positive predictive values (PPV) and negative predictive values (NPV) are listed below.
Figure 5.
Upset plot showing the detection overlap between analyses in all cancer-positive samples (A) and cancer-negative samples (B). C, Tile plot comparison of cancer-associated signal detection across all analysis methods in cancer-positive samples. D, Confusion matrixes showing ctDNA and clinical detection rates for cancer-negative LFS samples and patients. Positive predictive values (PPV) and negative predictive values (NPV) are listed below.
Figure 6. Longitudinal tracks for select LFS patients showing ctDNA signal, clinical information, and imaging data. LFS3—Left: coronal T2 (upper) and axial FLAIR (lower) MRI. Middle: coronal T1 (upper) and fat-suppressed axial T2 (lower) MRI. Right: fat-suppressed coronal T1 (upper) and fat-suppressed axial T2 MRI. LFS15—Left: coronal inversion recovery MRI. Middle: coronal inversion recovery MRI. Right: reformatted coronal diffusion-weighted MRI. LFS78—Left: fat-suppressed axial T1 MRI. Right: contrast-enhanced CT.
Figure 6.
Longitudinal tracks for select LFS patients showing ctDNA signal, clinical information, and imaging data. LFS3—Left: coronal T2 (upper) and axial FLAIR (lower) MRI. Middle: coronal T1 (upper) and fat-suppressed axial T2 (lower) MRI. Right: fat-suppressed coronal T1 (upper) and fat-suppressed axial T2 MRI. LFS15—Left: coronal inversion recovery MRI. Middle: coronal inversion recovery MRI. Right: reformatted coronal diffusion-weighted MRI. LFS78—Left: fat-suppressed axial T1 MRI. Right: contrast-enhanced CT.

Comment in

References

    1. Kratz CP, Freycon C, Maxwell KN, Nichols KE, Schiffman JD, Evans DG, et al. . Analysis of the Li-Fraumeni spectrum based on an international germline TP53 variant data set: an international agency for research on cancer TP53 database analysis. JAMA Oncol 2021;7:1800. - PMC - PubMed
    1. Malkin D, Li FP, Strong LC, Fraumeni JF, Nelson CE, Kim DH, et al. . Germ line p53 mutations in a familial syndrome of breast cancer, sarcomas, and other neoplasms. Science 1990;250:1233–8. - PubMed
    1. Mai PL, Best AF, Peters JA, DeCastro RM, Khincha PP, Loud JT, et al. . Risks of first and subsequent cancers among TP53 mutation carriers in the National Cancer Institute Li-Fraumeni syndrome cohort: cancer risk in TP53 mutation carriers. Cancer. 2016;122:3673–81. - PMC - PubMed
    1. Guha T, Malkin D. Inherited TP53 mutations and the Li–Fraumeni syndrome. Cold Spring Harb Perspect Med 2017;7:a026187. - PMC - PubMed
    1. Malkin D. Li-Fraumeni syndrome. Genes Cancer 2011;2:475–84. - PMC - PubMed

Publication types

MeSH terms

Substances